EUR-CAD

Follow EURCAD!Once you know that we expect EURUSD to rise and USDCAD to rise
it is completely normal in their progress compared to the expectations to see an increase in EURCAD as well.
You can use Lot distribution between the three pairs and thus better manage your risk.
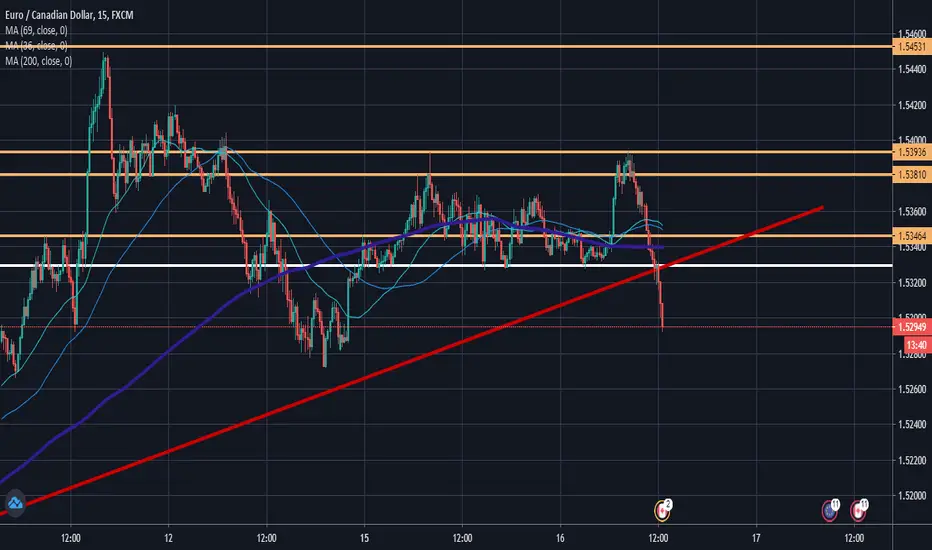
Resistance levels:
1.5458
1.5716
1.5919

EUR/CAD Waiting for the Breakout by ThinkingAntsOk🔸 4H CHART EXPLANATION:
.
.
🔸 Price bounced at the Support Zone.
.
🔸 It has broken the Descending Trendline.
.
🔸 Now, we are waiting for a breakout of the structure formed above the trendline. The target of the move is the Resistance Zone.
.
🔸 Will look for a lower timeframe bullish setup.
🔸DAILY CHART ANALYSIS:

EURCAD: Breakout Based Trading Plan
heeey traders,
EURCAD is still testing a major falling trend line.
we are still bearish biased here and wait for a confirmation to short the pair.
on 1H the price is contracting within a descending triangle formation.
1.5205 is the horizontal support that needs to be broken (1h candle close below) to initiate the selling order.
initial target will be 1.517
with stop above the last lower high.
in case of the violation of the triangle to the upside, trading plan will be invalid.
good luck this week!;)


Reversal de media semana EUR/CADposible seguimiento de tendencia alsista ya que vemos una falsa tendencia bajista creada para llegar a ese punto de liquidez para generar un reversal de media semana y seguir con su tendencia.

EURCAD Facing Strong Resistance
morning guys,
EURCAD is approaching a key daily/4H structure resistance.
it is based on a horizontal structure and a falling trend line.
1.5275 - 1.5335 is the zone from where I will expect a bearish continuation.
I will be waiting for a reversal formation on 1H within this area to short the market.
target levels:
1.519
1.51

EUR/CAD Short potentialEUR/CAD has fallen back into the Descending triangle pattern that has formed on the 1D,4HR,1HR chart.
With a strong rejection of higher prices, false break of the pattern and no immediate retest of these levels my bias is strongly toward the downside, I hope for the pattern to break to the downside and see a return back to normal prices before the outbreak in march.


EURCAD LONG - Strength against the loonie1. Price action on the 4 hourly is strong with bounce off market structure
2. EMAS are in line
3. TDI is showing bullish signals
4. Hourly Chart price action is strong as well with EMAs in line
5. Good RR trade set up


EURCAD - LONGPrice broke out of triangle and now retesting.
Waiting for a bounce and for extra confirmation break of 15min trendline

EUR/CAD - Simple Support and Resistance tradeHey, I am back with another Forex Idea, this time looking at EUR/CAD.
I will be using the Support and resistance strategy for this trade.
I reccomend to long this pair at area of 1.50750 to 1.51000, the higher your entry will be, the less Risk reward you will have, but also a higher chance of being filled, I will rather not be filled than having a bad risk reward ratio, but this time the risk reward ratio is very high so you can base your Entry even above this "Long entry area".
Don't forget to set up your Buy Limit to not miss out on this signal.
Don't forget to follow me, to not miss out on a good trade opportunities😉
Each Like is very much appreciated! 🙌
If you have any questions, feel free to ask.

EURCAD Price punch through our Make or break zone whats next?This is a full breakdown of my perception of price action on higher time frames! I take my entries using smaller time frame confirmation and you should, too. If you have any questions about this trade or my strategies feel free to ask them in the comment section below!
Let’s make some money together!


EURCAD price is testing smaller TF resistance will it bounce? This is a full breakdown of my perception of price action on higher time frames! I take my entries using smaller time frame confirmation and you should, too. If you have any questions about this trade or my strategies feel free to ask them in the comment section below!
Let’s make some money together!

I Don't Like To Say I Told You So... But I Told You SoPrice hit take profit level. Sweet bit of profit for the morning.
Now lets see how price reacts with the key level of 1.51000. currently see a retest. But lets watch this and see exactly what price wants to do.
Thanks :)

Head & ShouldersH & S, possible long. Probably wait for a break and retest. Although a dip in the oil price may have contributed the CAD weakening slightly, so it might bounce back downwards here again while oil gains some momentum back. Will wait and see what happens

Intraday ShortMN-W1 price above ema-20/50/200. D1 price is above ema-200, price appears to be consolidating on as ema-20/50 are intertwining with consolidating falling wedge pattern. Price has bounced back several times from the high of 24-03-20, each time before reaching its price target a correction appears suggested by price trending above H4-ema-20/50.
D1-MACD bearish with increase in divergence. H4-MACD bearish with increase in divergence. H1-MACD bullish with increase in divergence, however price is still below ema-20/50/200. This could suggest possible oversold condition on -H1 meaning a correction is due on the shorter timeframe before resuming bearish trends. From the bearish trend starting 05-06-20 price has constantly respected the 5m-ema-20 breaching it and testing 5m-ema-50, however, recently price has now gone as far as testing the 5m-ema-200 and reversing with the equal support from the macd which was not the case previously.
1) SELL -H1: Market Execution
Stop Loss: 1.5160
Take Profit: 1.5060
2) If price is still in its correction stage, wait for price to move above 1.5190 which 15m-ema-200 which may be prices next target.
SELL -H1: Sell Stop: 1.5190
Stop Loss: H1-ATR above entry
Take Profit: 1.5060
