Bullish bounce off 50% Fibonacci support?EUR/USD is falling towards the support level which is a pullback support that lines up with the 50% Fibonacci support and could bounce from this level to our take profit.
Entry: 1.1632
Why we like it:
There is a pullback support that lines up with the 50% Fibonacci retracement.
Stop loss: 1.1582
Why we like it:
There is an overlap support that is slightly below the 61.8% Fibonacci retracement.
Take profit: 1.1738
Why we like it:
There is an overlap resistance.
Enjoying your TradingView experience? Review us!
Please be advised that the information presented on TradingView is provided to Vantage (‘Vantage Global Limited’, ‘we’) by a third-party provider (‘Everest Fortune Group’). Please be reminded that you are solely responsible for the trading decisions on your account. There is a very high degree of risk involved in trading. Any information and/or content is intended entirely for research, educational and informational purposes only and does not constitute investment or consultation advice or investment strategy. The information is not tailored to the investment needs of any specific person and therefore does not involve a consideration of any of the investment objectives, financial situation or needs of any viewer that may receive it. Kindly also note that past performance is not a reliable indicator of future results. Actual results may differ materially from those anticipated in forward-looking or past performance statements. We assume no liability as to the accuracy or completeness of any of the information and/or content provided herein and the Company cannot be held responsible for any omission, mistake nor for any loss or damage including without limitation to any loss of profit which may arise from reliance on any information supplied by Everest Fortune Group.
EUR (Euro)

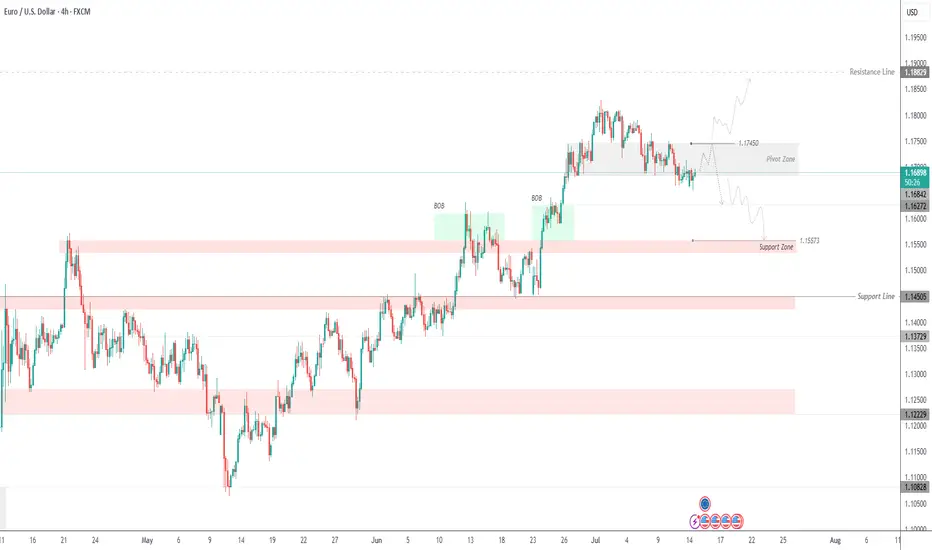
EURUSD Testing Patience – Bearish Trend Not Over YetEURUSD – Overview
EURUSD continues to trade under pressure amid bearish momentum, respecting key technical levels.
The price maintains bearish momentum as long as it trades below 1.1745, with downside targets at 1.1627 and 1.1557.
A retest of 1.1745 is possible and considered normal in this structure. However, if the price stabilizes below 1.1684, it will likely continue dropping toward the support targets.
To shift back to a bullish bias, the pair must break and hold above 1.1745.
Pivot Line: 1.1695
Support Levels: 1.1627 – 1.1557
Resistance Levels: 1.1745 – 1.1810
previous idea:
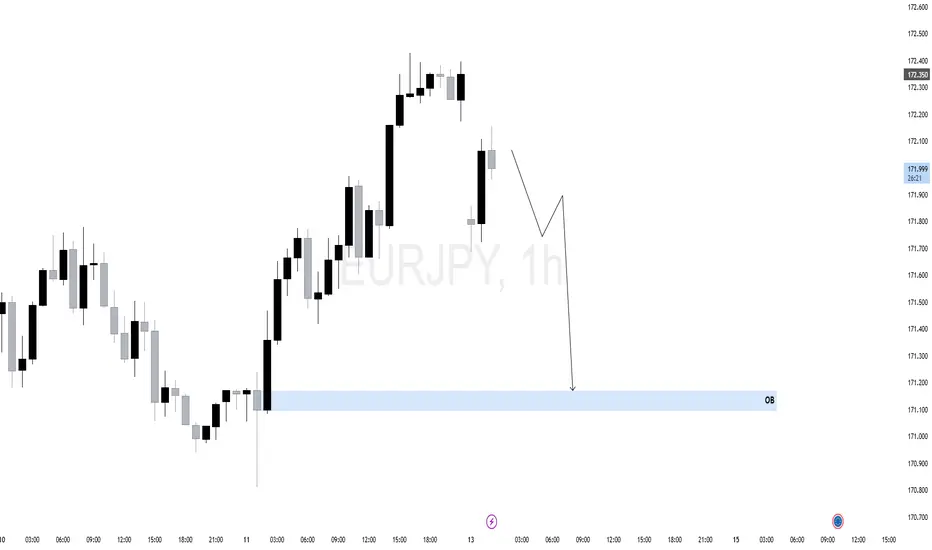
$EJ (EURJPY) 1HEURJPY recently showed a strong bullish rally off a key 1H Order Block (OB) near 171.200. This rally swept sell-side liquidity before shifting short-term structure.
However, current price action shows signs of weakness — multiple rejection wicks near 172.350 and a potential shift in momentum.
The corrective structure forming suggests the bullish move may have been a liquidity run. A clean lower high may confirm bearish intent.
As long as price remains below the recent swing high, we anticipate a short-term retracement toward the OB zone (171.200), which aligns with an area of unfilled orders and possible rebalancing.
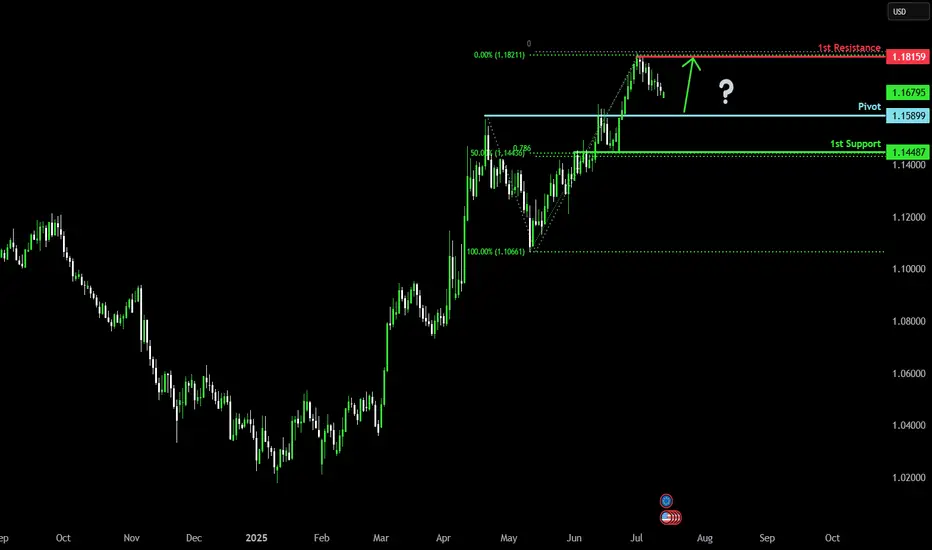
Bullish continuation?The Fiber (EUR/USD) is falling towards the pivot, which has been identified as a pullback support and could bounce to the 1st resistance.
Pivot: 1.1589
1st Support: 1.1448
1st Resistance: 1.1815
Risk Warning:
Trading Forex and CFDs carries a high level of risk to your capital and you should only trade with money you can afford to lose. Trading Forex and CFDs may not be suitable for all investors, so please ensure that you fully understand the risks involved and seek independent advice if necessary.
Disclaimer:
The above opinions given constitute general market commentary, and do not constitute the opinion or advice of IC Markets or any form of personal or investment advice.
Any opinions, news, research, analyses, prices, other information, or links to third-party sites contained on this website are provided on an "as-is" basis, are intended only to be informative, is not an advice nor a recommendation, nor research, or a record of our trading prices, or an offer of, or solicitation for a transaction in any financial instrument and thus should not be treated as such. The information provided does not involve any specific investment objectives, financial situation and needs of any specific person who may receive it. Please be aware, that past performance is not a reliable indicator of future performance and/or results. Past Performance or Forward-looking scenarios based upon the reasonable beliefs of the third-party provider are not a guarantee of future performance. Actual results may differ materially from those anticipated in forward-looking or past performance statements. IC Markets makes no representation or warranty and assumes no liability as to the accuracy or completeness of the information provided, nor any loss arising from any investment based on a recommendation, forecast or any information supplied by any third-party.
EUR-NZD Will Fall! Sell!
Hello,Traders!
EUR-NZD made a retest
Of the horizontal resistance
Of 1.9480 from where we
Will be expecting a local
Pullback and a move down
Sell!
Comment and subscribe to help us grow!
Check out other forecasts below too!
Disclosure: I am part of Trade Nation's Influencer program and receive a monthly fee for using their TradingView charts in my analysis.

Gold vs Euro: Heist Plan Activated – Watch the Breakout🏆XAU/EUR Golden Robbery Masterplan: Steal from Weak Hands, Escape with Gold!💰✨
🌍Hi! Hola! Ola! Bonjour! Hallo! Marhaba!🌍
Welcome, Money Makers & Market Robbers! 🤑💰💸✈️
Another top-secret robbery mission drops now — this time on the XAU/EUR battlefield! Gold vs Euro... Who wins? We do! 🏴☠️🎯
🔍The Setup:
Thief Trading Strategy™ Active – Bullish Breakout Mode Engaged
🔒 Resistance wall at 3400 is the lock.
💣 Breakout is the detonation point.
🟢 Target: 2970.00 (but smart robbers always escape before the sirens ring 🚨).
⚠️ATR Zone = danger zone = potential trend reversal trap = don’t get greedy.
🛠️Execution Plan (aka How to Rob the Market Clean)
📈 Entry Plan
"The vault’s about to open..."
💥 Breakout above Moving Average (3400) = BUY confirmation.
☑️ Set Buy Stop Orders just above MA.
☑️ OR plan a Pullback Buy Limit on recent swing low/high in 15–30M TF.
🛎️ SET ALERTS like a real thief waiting for the back door to open!
🛑 Stop Loss Strategy
"Don’t be a hero – be a survivor."
📍 SL suggestion: 2845.00 (2H swing low)
💡 Customize SL based on lot size & risk appetite.
🚨 Only set SL after breakout confirmation (don’t let false alarms shake you).
🎯 Profit Target / Exit Strategy
⛏️ Dig for gold at 2970.00, but
🏃♂️Escape before the trap springs.
🧲 Scalpers: Stick to LONGS only!
💼 Big accounts: hit hard.
🧠 Small robbers: join swing crew and trail the stop — protect the loot 💰
📊 Trend & Fundamentals Summary
⚖️ Current Trend: Neutral → Bullish Bias
🔍 Influenced by:
Macro Data
Euro Sentiment Shift
COT Positioning
Central Bank Whispers
Intermarket Forces
Geopolitical Sparks 🔥
🧠 Full breakdown in the fundamental zone (liinkk 🔗 Klik).
🚨 News Warning Alert
📰 Avoid entries near major news releases.
🎯 If in trade, manage with trailing SL to lock profits & limit damage.
🔥💖 Support the Mission
Hit that BOOST 💥 button — fuel our next big heist.
Let’s show the market we rob, we don't beg!
💪 Be loyal to the crew. Trade smart. Escape rich. 🐱👤📈
🔐 Disclaimer:
This is for education & entertainment – not financial advice.
💡 Always DYOR & adjust risk per your capital.
🧠 Stay sharp. Stay rich. See you on the next score! 💼🚁💸

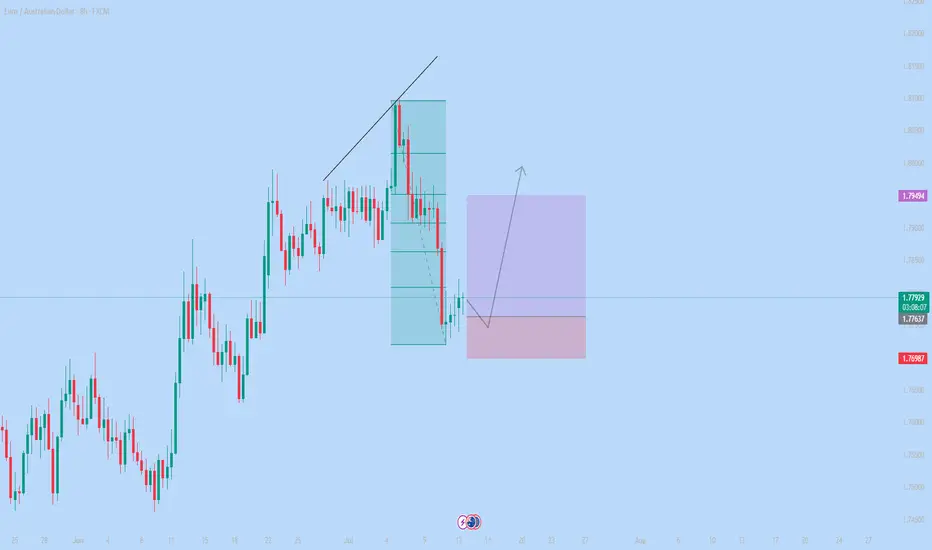
#009: EUR/AUD Long Investment Opportunity
We placed a buy limit order at 1,776, waiting for a bearish spike that would allow us to enter alongside the institutions, not against them.
Why this entry?
🔻 We're waiting for a false breakout at 1,776, a key level where big players are accumulating liquidity with technical stop hunts.
🔐 The SL is below the levels where banking systems have protective orders for the future.
📊 Retailers are still heavily short and aren't exiting, confirming that the upside movement hasn't started yet.
📈 Open interest shows anticipation of an imminent breakout, with progressive loading by large players.
⏳ We're staying out now to avoid being victims of the retracement, but ready to enter on the institutional bearish spike.
A violent expansion toward 1.79, with a directional candlestick that will start as soon as the retail cleanup below 1.776 is completed.
The trade has all the hallmarks of a perfect institutional entry: early positioning, patience, and a defensive stop.
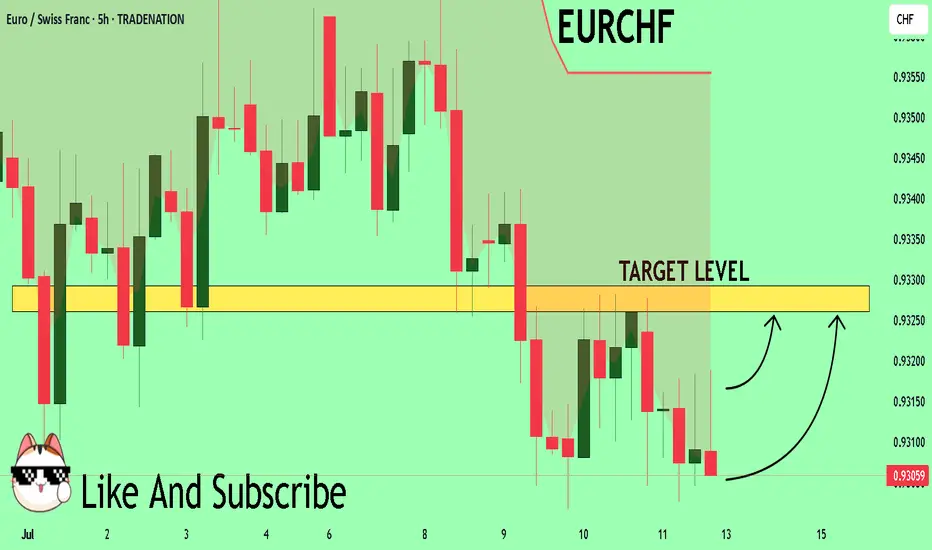
EUR-CHF Local Long! Buy!
Hello,Traders!
EUR-CHF is about to retest
The strong horizontal support
Of 0.9298 and as the pair
Is locally oversold we will be
Expecting a local bullish
Rebound and a move up
Buy!
Comment and subscribe to help us grow!
Check out other forecasts below too!
Disclosure: I am part of Trade Nation's Influencer program and receive a monthly fee for using their TradingView charts in my analysis.

XAU/EUR Bear Raid – High-Risk, High-Reward Short!🔥 XAU/EUR GOLD HEIST – BEARISH BREAKOUT ALERT! 🚨💰
🌟 Greetings, Market Pirates & Profit Raiders! 🌟
(Hola! Oi! Bonjour! Hallo! Marhaba!)
🤑 TRADE IDEA: XAU/EUR (Gold vs. Euro) – BEARISH SWING PLAY
Based on the 🔥Thief Trading Style🔥, we’re plotting a strategic heist on Gold! Our analysis signals a short entry with high-risk, high-reward potential. The market is oversold, consolidating, and primed for a reversal trap—bullish traders are about to get ambushed!
🎯 TRADE SETUP (SWING/DAY TRADE)
📉 ENTRY:
"The Heist Begins!" Wait for Neutral Zone breakout near 2800.00 (Bearish confirmation).
Pro Tip: Place sell-stop orders above neutral OR sell-limit near swing highs/lows (15-30 min timeframe).
📌 Set an ALERT! Don’t miss the breakout moment.
🛑 STOP LOSS:
"Stop right there, cowboy! 🤠"
If using a sell-stop, set SL only after breakout (don’t get faked out!).
Thief SL Zone: 2870.00 (4H swing high).
⚠️ Adjust based on your risk & lot size! (Your money, your rules—but trade smart!).
🎯 TARGET:
2720.00 (or escape early if momentum fades).
🚨 CRITICAL ALERTS:
📰 News = Volatility! Avoid new trades during major releases.
🔒 Lock profits with trailing stops—don’t let winners turn to losers!
📉 Market Context: Bearish trend fueled by .
💥 BOOST THIS HEIST! 👊
🔥 Like & Boost to fuel our next Thief Trading raid!
🚀 More profitable setups coming—stay tuned!
(Disclaimer: Trade at your own risk. This is not financial advice.)

EURCAD - Weekly Resistance Might Shift The Momentum!Hello TradingView Family / Fellow Traders. This is Richard, also known as theSignalyst.
📈EURCAD has been overall bullish trading within the rising channel marked in blue. However, it is currently approaching the upper bound of the channel.
Moreover, the red zone is a strong weekly resistance.
🏹 Thus, the highlighted red circle is a strong area to look for sell setups as it is the intersection of the upper blue trendline and resistance.
📚 As per my trading style:
As #EURCAD approaches the red circle zone, I will be looking for bearish reversal setups (like a double top pattern, trendline break , and so on...)
📚 Always follow your trading plan regarding entry, risk management, and trade management.
Good luck!
All Strategies Are Good; If Managed Properly!
~Rich
Disclosure: I am part of Trade Nation's Influencer program and receive a monthly fee for using their TradingView charts in my analysis.

EURUSD The 4H MA200 distinguishes bullish from bearish.The EURUSD pair has been trading within a (blue) 2-month Channel Up since the May 12 Low and it just broke below its 4H MA100 (green trend-line). The previous two Bearish Legs of this pattern bottomed (made a Higher Low) on or just above the 0.5 Fibonacci retracement level.
As a result, the price is very close to the most optimal buy level of this pattern and as long as it holds, we expect to start the new Bullish Leg and target the 1.5 Fibonacci extension (1.20000 our Target just below), which is in line with the previous two Bullish Legs.
If however the 4H MA200 (orange trend-line) breaks, we will take the loss on that long and go short as technically the price should seek the bottom of the (dotted) wider Channel Up. Our Target on that occasion will be 1.14000, right at the top of the High Volatility Zone.
-------------------------------------------------------------------------------
** Please LIKE 👍, FOLLOW ✅, SHARE 🙌 and COMMENT ✍ if you enjoy this idea! Also share your ideas and charts in the comments section below! This is best way to keep it relevant, support us, keep the content here free and allow the idea to reach as many people as possible. **
-------------------------------------------------------------------------------
Disclosure: I am part of Trade Nation's Influencer program and receive a monthly fee for using their TradingView charts in my analysis.
💸💸💸💸💸💸
👇 👇 👇 👇 👇 👇

EURCHF: Bullish Forecast & Bullish Scenario
The recent price action on the EURCHF pair was keeping me on the fence, however, my bias is slowly but surely changing into the bullish one and I think we will see the price go up.
Disclosure: I am part of Trade Nation's Influencer program and receive a monthly fee for using their TradingView charts in my analysis.
❤️ Please, support our work with like & comment! ❤️

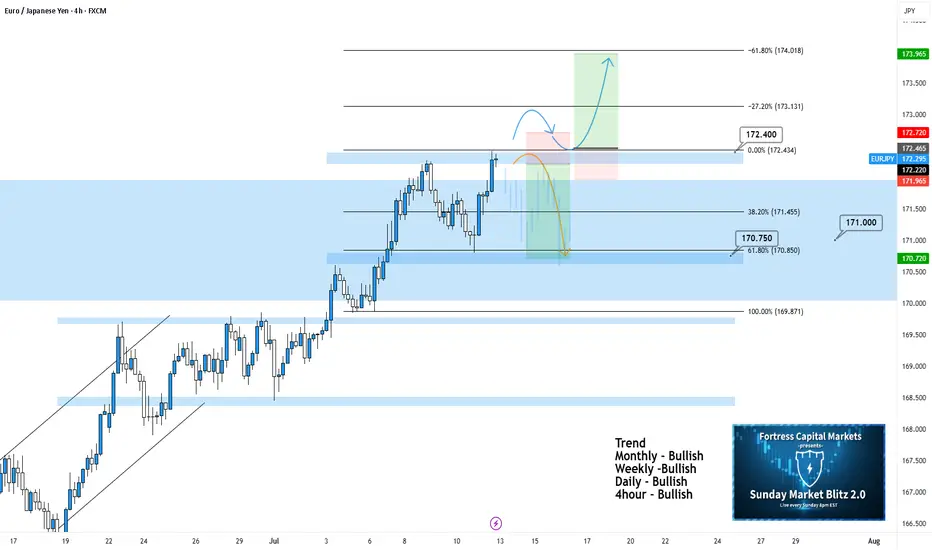
EURJPY 4hour TF - July 13th, 2025EURJPY 7/13/2025
EURJPY 4hour Bullish Idea
Monthly - Bullish
Weekly - Bullish
Daily - Bullish
4hour - Bullish
EJ has been paying out for the last couple weeks and the analysis has been spot on for these setups. Going into this week though we’re starting to get a bit uncertain. The fact that we’ve been in a rally since late June leaves me wondering how much more EJ has in it before a correction. So I think this week warrants some caution on EJ especially as we remain around this monthly 171.000 zone.
Let’s keep a look out for two potential scenarios going into this week:
Bullish Continuation - This is the most likely scenario and this idea lines up with all the major trends as well. For us to comfortably consider long setups I’d like to see a clear break above 172.400 zone / our 0% fib level followed by a retest for confirmation. This is what we would like to see but keep in mind price action has been moving aggressively and may not provide a retest.
Bearish Reversal into Range - This is a possibility but could also be a sign of consolidation around 171.000. There may be a decent short opportunity if we see the right kind of rejection/reversal from 172.400. In this scenario, it looks like this would be a potential range trade and I wouldn’t try to repeat this setup more than once.
EURCHF On The Rise! BUY!
My dear subscribers,
This is my opinion on the EURCHF next move:
The instrument tests an important psychological level 0.9305
Bias - Bullish
Technical Indicators: Supper Trend gives a precise Bullish signal, while Pivot Point HL predicts price changes and potential reversals in the market.
Target - 0.9326
About Used Indicators:
On the subsequent day, trading above the pivot point is thought to indicate ongoing bullish sentiment, while trading below the pivot point indicates bearish sentiment.
Disclosure: I am part of Trade Nation's Influencer program and receive a monthly fee for using their TradingView charts in my analysis.
———————————
WISH YOU ALL LUCK
EURGBP SHORT – WEEKLY FORECAST Q3 | W29 | Y25💼 EURGBP SHORT – WEEKLY FORECAST
Q3 | W29 | Y25
📊 MARKET STRUCTURE SNAPSHOT
EURGBP is currently reacting from a key higher time frame supply zone, with price action showing weakness at premium levels. Momentum has slowed, and early signs of distribution are appearing. With structure aligning bearishly across multiple timeframes, the pair presents a short bias opportunity.
🔍 Confluences to Watch 📝
✅ Daily Order Block (OB)
Price reacted from a high-probability bearish OB.
Rejection wicks and a shift in candle body control point to supply dominance.
Momentum is fading, confirming the presence of smart money sellers.
✅ 4H Order Block
Clear mitigation of 4H OB followed by an internal break of structure (iBoS).
Price is respecting the OB zone, printing lower highs beneath key supply.
Perfect mid-timeframe confirmation of trend transition.
✅ 1H Order Block
1H structure shifted bearish, validating LTF trend alignment.
Price building supply chain with continued lower highs and bearish engulfing patterns.
Ideal zone for entry on pullback or liquidity sweep.
📈 Risk Management Protocols
🔑 Core Principles:
💰 Max 1% risk per trade
📍 Only execute at pre-identified zones
⏰ Set alerts — avoid impulsive trades
📉 Respect RR — minimum 1:2 per position
🧠 You're not paid for frequency. You're paid for discipline and execution quality.
🧠 Weekly FRGNT Insight
“Trade what the market gives, not what your ego wants.”
Stay mechanical, stay focused, and allow the probabilities to play out. Your job is to control risk — not the outcome.
🏁 Final Thoughts from FRGNT
📌 The structure is clear.
📌 The confluences are stacked.
📌 The bias is confirmed.
Let your execution reflect your discipline, not your emotions.
❤️ Good luck this week, and as always – I’ll see you at the very top.

EURJPY SHORT – WEEKLY FORECAST Q3 | W29 | Y25💼 EURJPY SHORT – WEEKLY FORECAST
Q3 | W29 | Y25
📊 MARKET STRUCTURE SNAPSHOT
EURJPY is currently reacting from a key higher time frame supply zone, with price action showing weakness at premium levels. Structure and momentum are now aligning for a short opportunity backed by multi-timeframe confluence.
🔍 Confluences to Watch 📝
✅ Daily Order Block (OB)
Strong reaction and early signs of distribution.
Previous bullish momentum is losing steam; structure is flattening with rejection wicks forming.
✅ 4H Order Block
Break of internal structure (iBoS) confirms a short-term bearish transition.
✅ 1H Order Block
1H structure shift bearish
📈 Risk Management Protocols
🔑 Core principles:
Max 1% risk per trade
Only execute at pre-identified levels
Use alerts, not emotion
Stick to your RR plan — minimum 1:2
🧠 You’re not paid for how many trades you take, you’re paid for how well you manage risk.
🧠 Weekly FRGNT Insight
"Trade what the market gives, not what your ego wants."
Stay mechanical. Stay focused. Let the probabilities work.
🏁 Final Thoughts from FRGNT
📌 The structure is clear.
The confluences are stacked.
Let execution follow discipline, not emotion.

EURNZD Will Go Lower From Resistance! Sell!
Take a look at our analysis for EURNZD.
Time Frame: 15m
Current Trend: Bearish
Sentiment: Overbought (based on 7-period RSI)
Forecast: Bearish
The market is on a crucial zone of supply 1.945.
The above-mentioned technicals clearly indicate the dominance of sellers on the market. I recommend shorting the instrument, aiming at 1.943 level.
P.S
Overbought describes a period of time where there has been a significant and consistent upward move in price over a period of time without much pullback.
Disclosure: I am part of Trade Nation's Influencer program and receive a monthly fee for using their TradingView charts in my analysis.
Like and subscribe and comment my ideas if you enjoy them!

EUR_NZD RESISTANCE AHEAD|SHORT|
✅EUR_NZD has been growing recently
And the pair seems locally overbought
So as the pair is approaching a horizontal resistance of 1.9500
Price decline is to be expected
SHORT🔥
✅Like and subscribe to never miss a new idea!✅
Disclosure: I am part of Trade Nation's Influencer program and receive a monthly fee for using their TradingView charts in my analysis.

EURGBP Perfect Channel Up giving one more buy opportunity.Last time we looked at the EURGBP pair (May 30, see chart below) we gave the most timely buy signal right at the bottom (Higher Lows trend-line) of the Bullish Megaphone, and the price is only a few candles away from the 0.87400 Target:
If we look at the price action from a 4H perspective we can see that it is a Channel Up that has been driving the pair upwards since the May 28 bottom and today's rebound is taking place after a direct hit on the 4H MA50 (blue trend-line).
This is the start of the new Bullish Leg. Since the previous two have increased by +1.90%, this rally has the potential to even exceed our 0.87400 Target marginally. Still, this is a perfect bullish set-up.
-------------------------------------------------------------------------------
** Please LIKE 👍, FOLLOW ✅, SHARE 🙌 and COMMENT ✍ if you enjoy this idea! Also share your ideas and charts in the comments section below! This is best way to keep it relevant, support us, keep the content here free and allow the idea to reach as many people as possible. **
-------------------------------------------------------------------------------
Disclosure: I am part of Trade Nation's Influencer program and receive a monthly fee for using their TradingView charts in my analysis.
💸💸💸💸💸💸
👇 👇 👇 👇 👇 👇

EURGBP SHORT DAILY FORECAST Q3 D11 W28 Y25EURGBP SHORT DAILY FORECAST Q3 D11 W28 Y25
It’s Fun Coupon Friday! 💸🔥
Professional Risk Managers👋
Welcome back to another FRGNT chart update📈
Diving into some Forex setups using predominantly higher time frame order blocks alongside confirmation breaks of structure.
Let’s see what price action is telling us today! 👀
💡Here are some trade confluences📝
✅Daily Order block identified
✅4H Order Block identified
✅1H Order Block identified
🔑 Remember, to participate in trading comes always with a degree of risk, therefore as professional risk managers it remains vital that we stick to our risk management plan as well as our trading strategies.
📈The rest, we leave to the balance of probabilities.
💡Fail to plan. Plan to fail.
🏆It has always been that simple.
❤️Good luck with your trading journey, I shall see you at the very top.
🎯Trade consistent, FRGNT X

EURJPY SHORT DAILY FORECAST Q3 D11 W28 Y25EURJPY SHORT DAILY FORECAST Q3 D11 W28 Y25
It’s Fun Coupon Friday! 💸🔥
Professional Risk Managers👋
Welcome back to another FRGNT chart update📈
Diving into some Forex setups using predominantly higher time frame order blocks alongside confirmation breaks of structure.
Let’s see what price action is telling us today! 👀
💡Here are some trade confluences📝
✅Daily Order block identified
✅4H Order Block identified
✅1H Order Block identified
🔑 Remember, to participate in trading comes always with a degree of risk, therefore as professional risk managers it remains vital that we stick to our risk management plan as well as our trading strategies.
📈The rest, we leave to the balance of probabilities.
💡Fail to plan. Plan to fail.
🏆It has always been that simple.
❤️Good luck with your trading journey, I shall see you at the very top.
🎯Trade consistent, FRGNT X

Bullish reevrsal?EUR/NZD has bounced off the pivot and could rise to the 61.8% Fibonacci resistance.
Pivot: 1.93667
1st Support: 1.93001
1st Resistance: 1.94871
Risk Warning:
Trading Forex and CFDs carries a high level of risk to your capital and you should only trade with money you can afford to lose. Trading Forex and CFDs may not be suitable for all investors, so please ensure that you fully understand the risks involved and seek independent advice if necessary.
Disclaimer:
The above opinions given constitute general market commentary, and do not constitute the opinion or advice of IC Markets or any form of personal or investment advice.
Any opinions, news, research, analyses, prices, other information, or links to third-party sites contained on this website are provided on an "as-is" basis, are intended only to be informative, is not an advice nor a recommendation, nor research, or a record of our trading prices, or an offer of, or solicitation for a transaction in any financial instrument and thus should not be treated as such. The information provided does not involve any specific investment objectives, financial situation and needs of any specific person who may receive it. Please be aware, that past performance is not a reliable indicator of future performance and/or results. Past Performance or Forward-looking scenarios based upon the reasonable beliefs of the third-party provider are not a guarantee of future performance. Actual results may differ materially from those anticipated in forward-looking or past performance statements. IC Markets makes no representation or warranty and assumes no liability as to the accuracy or completeness of the information provided, nor any loss arising from any investment based on a recommendation, forecast or any information supplied by any third-party.

Bullish bounce off overlap support?EUR/GBP is falling towards the pivot, which has been identified as an overlap support and could bounce to the 1st resistance, which acts as a pullback resistance.
Pivot: 0.8569
1st Support: 0.8538
1st Resistance: 0.8640
Risk Warning:
Trading Forex and CFDs carries a high level of risk to your capital and you should only trade with money you can afford to lose. Trading Forex and CFDs may not be suitable for all investors, so please ensure that you fully understand the risks involved and seek independent advice if necessary.
Disclaimer:
The above opinions given constitute general market commentary, and do not constitute the opinion or advice of IC Markets or any form of personal or investment advice.
Any opinions, news, research, analyses, prices, other information, or links to third-party sites contained on this website are provided on an "as-is" basis, are intended only to be informative, is not an advice nor a recommendation, nor research, or a record of our trading prices, or an offer of, or solicitation for a transaction in any financial instrument and thus should not be treated as such. The information provided does not involve any specific investment objectives, financial situation and needs of any specific person who may receive it. Please be aware, that past performance is not a reliable indicator of future performance and/or results. Past Performance or Forward-looking scenarios based upon the reasonable beliefs of the third-party provider are not a guarantee of future performance. Actual results may differ materially from those anticipated in forward-looking or past performance statements. IC Markets makes no representation or warranty and assumes no liability as to the accuracy or completeness of the information provided, nor any loss arising from any investment based on a recommendation, forecast or any information supplied by any third-party.
