EURUSD Breakout and Potential RetraceHey Traders, in today's trading session we are monitoring EURUSD for a buying opportunity around 1.13700 zone, EURUSD was trading in a downtrend and successfully managed to break it out. Currently is in a correction phase in which it is approaching the retrace area at 1.13700 support and resistance area.
Trade safe, Joe.
EUR (Euro)

EURUSD: Twin Channel Up structure aims for 1.14950.EURUSD is bullish on its 1D technical outlook (RSI = 59.016, MACD = 0.005, ADX = 22.852) as it maintains a bullish structure consisting of successive Channel Up patterns. We are currently on the 2nd, with the price supported by both the 30m MA50 and MA200. The 1st Channel Up peaked after a +1.29% rise. We remain bullish, aiming for a similar rise, TP = 1.14950.
See how our prior idea has worked out:
## If you like our free content follow our profile to get more daily ideas. ##
## Comments and likes are greatly appreciated. ##

EURCHF Set To Fall! SELL!
My dear followers,
I analysed this chart on EURCHF and concluded the following:
The market is trading on 0.9375 pivot level.
Bias - Bearish
Technical Indicators: Both Super Trend & Pivot HL indicate a highly probable Bearish continuation.
Target - 0.9356
About Used Indicators:
A super-trend indicator is plotted on either above or below the closing price to signal a buy or sell. The indicator changes color, based on whether or not you should be buying. If the super-trend indicator moves below the closing price, the indicator turns green, and it signals an entry point or points to buy.
Disclosure: I am part of Trade Nation's Influencer program and receive a monthly fee for using their TradingView charts in my analysis.
———————————
WISH YOU ALL LUCK

PMI Divergence & ECB Rate Decision Looms:0.84 Key Level in PlayEURGBP 04/06 – PMI Divergence & ECB Rate Decision Looms: 0.84 Key Level in Play
EUR/GBP is hovering around the 0.8420 mark after mixed PMI releases from the Eurozone and Germany. Traders are cautiously awaiting the ECB’s interest rate decision this Thursday, while the Bank of England signals potential easing — but remains non-committal on timing.
🌍 MACRO OUTLOOK
Eurozone & German PMI:
Eurozone Composite PMI eased to 50.2, still above forecasts (49.5) but reflecting slowing momentum.
German Composite dropped to 48.5; Services fell further to 47.1 — signaling contraction risk in Europe’s largest economy.
ECB Dovish Expectations:
Core inflation fell to 1.9% YoY in May — below the 2% ECB target for the first time in eight months.
Markets are fully pricing in a 25bps rate cut this week.
BoE Shifts Cautiously Dovish:
Governor Andrew Bailey acknowledged that monetary easing is likely, but warned of "uncertainty ahead."
The MPC is split — some fear sticky inflation; others warn that rates staying too high too long may damage growth.
Market Sentiment:
EUR remains pressured by ECB dovish expectations.
GBP is also under pressure from weak UK macro indicators and global trade tensions.
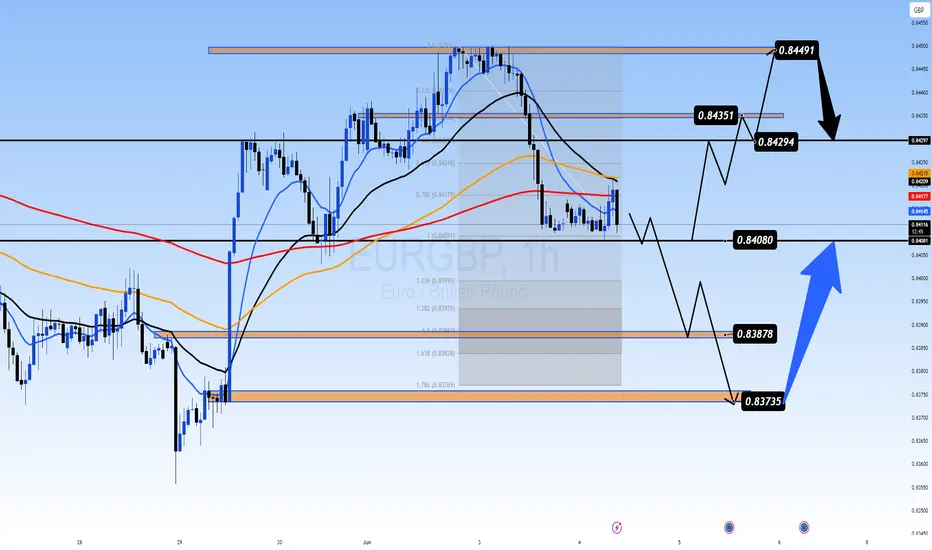
📉 TECHNICAL OUTLOOK (H1 Chart)
Price is consolidating near the EMA200 (0.8409) — a crucial dynamic support.
A tight sideways range has formed; 0.8408 is a key horizontal level to watch for breakout/breakdown confirmation.
Break below 0.8408 could send price toward Fibo 1.618 at 0.8383 or psychological support at 0.8373.
If bulls defend 0.8408, we may see a bounce toward 0.8429 → 0.8449 resistance zone.
🔑 KEY TRADE ZONES
🟢 BUY ZONE: 0.8380 – 0.8373
SL: 0.8358
TP: 0.8400 → 0.8415 → 0.8429 → 0.8435
🔴 SELL ZONE: 0.8448 – 0.8450
SL: 0.8460
TP: 0.8435 → 0.8420 → 0.8408 → 0.8388
⚠️ TRADE STRATEGY
Watch the 0.8408 area closely. If price holds → short-term BUY scalp opportunities.
If it breaks strongly → consider SELL toward lower Fibo/structure levels at 0.838x.
Be cautious around ECB release — avoid trading during the spike. Wait for structure confirmation post-news.
📌 CONCLUSION
"EUR/GBP is entering a critical zone near 0.8400. With ECB and BoE both leaning dovish, expect increased volatility. Hold or break at this key level will likely define the next directional leg. Stay patient and let the market show its hand."
EUR/CHFLooking for the market to retrace, only entering once the market enters my area.
This will be confirmed with my RSI.
But if it takes the high before the retracing, I will not look for a trade anymore, as one of the targets have already been taken

Bearish drop?EUR/AUD has reacted off the pivot, which is a pullback resistance and could drop to he 1st support that lines up with the 61.8% Fibonacci retracement.
Pivot: 1.77100
1st Support: 1.73968
1st Resistance: 1.78859
Risk Warning:
Trading Forex and CFDs carries a high level of risk to your capital and you should only trade with money you can afford to lose. Trading Forex and CFDs may not be suitable for all investors, so please ensure that you fully understand the risks involved and seek independent advice if necessary.
Disclaimer:
The above opinions given constitute general market commentary, and do not constitute the opinion or advice of IC Markets or any form of personal or investment advice.
Any opinions, news, research, analyses, prices, other information, or links to third-party sites contained on this website are provided on an "as-is" basis, are intended only to be informative, is not an advice nor a recommendation, nor research, or a record of our trading prices, or an offer of, or solicitation for a transaction in any financial instrument and thus should not be treated as such. The information provided does not involve any specific investment objectives, financial situation and needs of any specific person who may receive it. Please be aware, that past performance is not a reliable indicator of future performance and/or results. Past Performance or Forward-looking scenarios based upon the reasonable beliefs of the third-party provider are not a guarantee of future performance. Actual results may differ materially from those anticipated in forward-looking or past performance statements. IC Markets makes no representation or warranty and assumes no liability as to the accuracy or completeness of the information provided, nor any loss arising from any investment based on a recommendation, forecast or any information supplied by any third-party.

Falling towards pullback support?EUR/USD is falling towards the support level which is a pullback support that aligns with the 50% Fibonacci retracement and could bounce from this level to our take profit.
Entry: 1.1325
Why we like it:
There is a pullback support level that lines up with the 50% Fibonacci retracement.
Stop loss: 1.1266
Why we like it:
There is a pullback support level that lines up with the 78.6% Fibonacci retracement.
Take profit: 1.1418
Why we like it:
There is a pullback resistance level.
Enjoying your TradingView experience? Review us!
Please be advised that the information presented on TradingView is provided to Vantage (‘Vantage Global Limited’, ‘we’) by a third-party provider (‘Everest Fortune Group’). Please be reminded that you are solely responsible for the trading decisions on your account. There is a very high degree of risk involved in trading. Any information and/or content is intended entirely for research, educational and informational purposes only and does not constitute investment or consultation advice or investment strategy. The information is not tailored to the investment needs of any specific person and therefore does not involve a consideration of any of the investment objectives, financial situation or needs of any viewer that may receive it. Kindly also note that past performance is not a reliable indicator of future results. Actual results may differ materially from those anticipated in forward-looking or past performance statements. We assume no liability as to the accuracy or completeness of any of the information and/or content provided herein and the Company cannot be held responsible for any omission, mistake nor for any loss or damage including without limitation to any loss of profit which may arise from reliance on any information supplied by Everest Fortune Group.

EURUSD – Retracement Expected Before Further UpsideEURUSD – Retracement Expected Before Further Upside
The EURUSD pair has seen strong bullish momentum over the past two days, mainly driven by the weakening U.S. dollar. Last week’s softer-than-expected U.S. Core PCE and PMI data fueled speculation that the Federal Reserve may hold rates steady for longer, weighing on USD sentiment.
However, with upcoming speeches from FOMC members and the Non-Farm Payrolls (NFP) data due later this week, traders may look to take profit or step aside, leading to a short-term retracement before any continuation of the bullish trend.
🔍 Macro & Fundamental Overview:
USD remains under pressure amid declining inflation signals and weakening economic data.
ECB is expected to cut rates, but at a slower pace than the Fed, creating a divergence that supports the Euro in the near term.
Political uncertainties in the EU, including upcoming elections, are worth monitoring.
📉 Technical Analysis:
The medium-term trend remains bullish with EMA 13–34–89–200 aligned to the upside.
Price is currently reacting at the 0.0 FIBO level (1.1420), suggesting a potential pullback.
Key support lies between 1.1345 – 1.1317. If this zone holds, it could serve as a solid base for a bullish continuation.
🧭 Suggested Trade Scenarios:
🔵 BUY ZONE: 1.1317 – 1.1345
SL: 1.1285
TP: 1.1370 → 1.1400 → 1.1420 → 1.1450+
🔻 SELL ZONE (Short-term counter-trade): 1.1418 – 1.1425
SL: 1.1450
TP: 1.1385 → 1.1350 → 1.1320

EURCHF INTRADAY capped by 0.9430The pair is in a bearish trend, with recent price action showing a bounce (oversold rally) that was rejected near 0.9430, a key resistance level from previous consolidation.
This rejection suggests sellers are still in control.
Key Levels to Watch:
Resistance: 0.9430 (key level), then 0.9500 and 0.9600 if broken.
Support: 0.9155, followed by 0.9100 and 0.9050.
Trading Outlook:
Bearish scenario: If price fails to break above 0.9430, expect a move lower toward 0.9300, with extended downside to 0.9200 and 0.9130 over time.
Bullish scenario: A daily close above 0.9430 would invalidate the bearish view and could lead to a move toward 0.9500 and possibly 0.9600.
Conclusion: EUR/CHF remains bearish unless price breaks and holds above 0.9430. Traders may look for short opportunities below resistance or switch to a bullish bias on a confirmed breakout.
This communication is for informational purposes only and should not be viewed as any form of recommendation as to a particular course of action or as investment advice. It is not intended as an offer or solicitation for the purchase or sale of any financial instrument or as an official confirmation of any transaction. Opinions, estimates and assumptions expressed herein are made as of the date of this communication and are subject to change without notice. This communication has been prepared based upon information, including market prices, data and other information, believed to be reliable; however, Trade Nation does not warrant its completeness or accuracy. All market prices and market data contained in or attached to this communication are indicative and subject to change without notice.

Bullish bounce off pullback support?The Fiber (EUR/USD) is falling towards the pivot and could bounce to the 1st resistance.
Pivot: 1.1367
1st Support: 1.1278
1st Resistance: 1.1475
Risk Warning:
Trading Forex and CFDs carries a high level of risk to your capital and you should only trade with money you can afford to lose. Trading Forex and CFDs may not be suitable for all investors, so please ensure that you fully understand the risks involved and seek independent advice if necessary.
Disclaimer:
The above opinions given constitute general market commentary, and do not constitute the opinion or advice of IC Markets or any form of personal or investment advice.
Any opinions, news, research, analyses, prices, other information, or links to third-party sites contained on this website are provided on an "as-is" basis, are intended only to be informative, is not an advice nor a recommendation, nor research, or a record of our trading prices, or an offer of, or solicitation for a transaction in any financial instrument and thus should not be treated as such. The information provided does not involve any specific investment objectives, financial situation and needs of any specific person who may receive it. Please be aware, that past performance is not a reliable indicator of future performance and/or results. Past Performance or Forward-looking scenarios based upon the reasonable beliefs of the third-party provider are not a guarantee of future performance. Actual results may differ materially from those anticipated in forward-looking or past performance statements. IC Markets makes no representation or warranty and assumes no liability as to the accuracy or completeness of the information provided, nor any loss arising from any investment based on a recommendation, forecast or any information supplied by any third-party.

EURNZD H2 Best Level to SHORT/HOLD +100/+200 pips🏆 EURNZD Market Update H2 chart
📊 Technical Outlook
🔸trading in well defined range
🔸trading mid range now
🔸range highs set at 9150
🔸range lows set at 8850
🔸strategy: SHORT SELL from resistance
🔸SL 40 pips TP1 +100 pips TP2 +200 pips
🔸swing trade setup for patient traders
📊Forex Market Update (June 3, 2025)
🇪🇺EUR/USD
📉Price:\~1.1410
Euro holds steady near 1.14 amid stable ECB policy and improving German sentiment. However, a drop in eurozone CPI to 2.0% from 2.2% may exert downward pressure
🔑Key Levels Support 1.1365|Resistance 1.1445
🇬🇧GBP/USD
📈Price:\~1.3530
Pound reaches a three-year high, trading around 1.3530, supported by a modest upward revision to May’s UK manufacturing PMI. Lack of UK economic data leaves Sterling influenced by global trends.
🔑Key Levels\:Support 1.3450|Resistance 1.3560
🇺🇸DXY (US Dollar Index)
📉Price:\~98.79
US dollar index falls to a six-week low amid persistent trade tensions and weak US manufacturing data for May. Investors await upcoming US nonfarm payrolls data, which could influence the Federal Reserve’s monetary stance.
🔑Key Levels\:Support 98.00|Resistance 100.00.00

DAILY CLOSE ABOVE D50 EMA - EURGBP LONG FORECAST Q2 W23 D3 Y25
EURGBP LONG FORECAST Q2 W23 D3 Y25
Professional Risk Managers👋
Welcome back to another FRGNT chart update📈
Diving into some Forex setups using predominantly higher time frame order blocks alongside confirmation breaks of structure.
Let’s see what price action is telling us today!
💡Here are some trade confluences📝
✅Daily close above Daily 50EMA
✅15' order block
✅Intraday breaks of structure
✅Tokyo ranges to be filled
🔑 Remember, to participate in trading comes always with a degree of risk, therefore as professional risk managers it remains vital that we stick to our risk management plan as well as our trading strategies.
📈The rest, we leave to the balance of probabilities.
💡Fail to plan. Plan to fail.
🏆It has always been that simple.
❤️Good luck with your trading journey, I shall see you at the very top.
🎯Trade consistent, FRGNT X

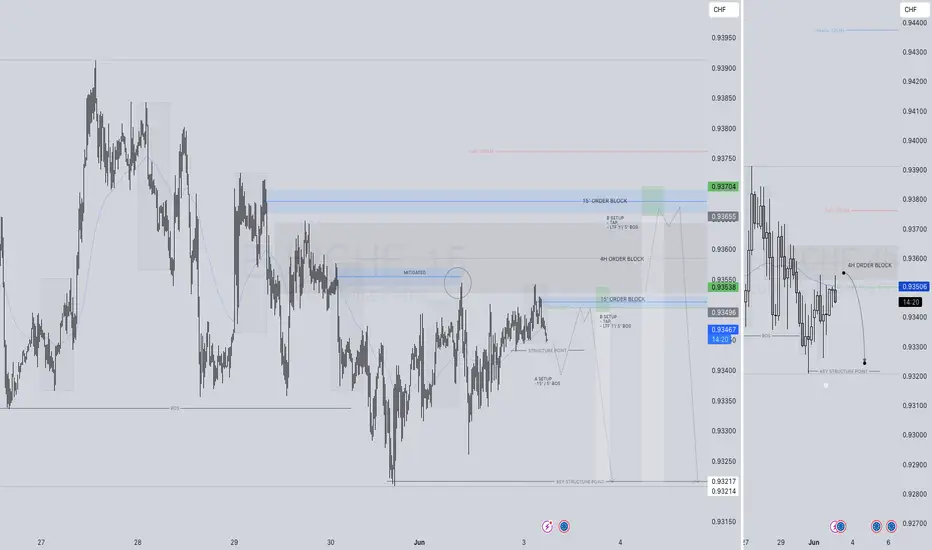
QUICK PLAY - EURCHF SHORT FORECAST Q2 W23 D3 Y25EURCHF SHORT FORECAST Q2 W23 D3 Y25
Professional Risk Managers👋
Welcome back to another FRGNT chart update📈
Diving into some Forex setups using predominantly higher time frame order blocks alongside confirmation breaks of structure.
Let’s see what price action is telling us today!
💡Here are some trade confluences📝
✅4 hour order block
✅4 hour 50 EMA rejection
✅Intraday 15' order block to be identified
✅Tokyo ranges to be filled
🔑 Remember, to participate in trading comes always with a degree of risk, therefore as professional risk managers it remains vital that we stick to our risk management plan as well as our trading strategies.
📈The rest, we leave to the balance of probabilities.
💡Fail to plan. Plan to fail.
🏆It has always been that simple.
❤️Good luck with your trading journey, I shall see you at the very top.
🎯Trade consistent, FRGNT X
EURUSD Channel Up targeting 1.15000.The EURUSD pair just broke above the Resistance 1 level (1.14250) confirming the extension of the current Bullish Leg of the short-term Channel Up.
With their 4H RSI patterns very similar, the previous Bullish Leg rose by +2.58% before a pull-back to the 4H MA50 (blue trend-line). That gives us a potential Target of 1.15000 on the short-term.
-------------------------------------------------------------------------------
** Please LIKE 👍, FOLLOW ✅, SHARE 🙌 and COMMENT ✍ if you enjoy this idea! Also share your ideas and charts in the comments section below! This is best way to keep it relevant, support us, keep the content here free and allow the idea to reach as many people as possible. **
-------------------------------------------------------------------------------
Disclosure: I am part of Trade Nation's Influencer program and receive a monthly fee for using their TradingView charts in my analysis.
💸💸💸💸💸💸
👇 👇 👇 👇 👇 👇

EURCHF SHORT FORECAST Q2 W23 D2 Y25EURCHF SHORT FORECAST Q2 W23 D2 Y25
Professional Risk Managers👋
Welcome back to another FRGNT chart update📈
Diving into some Forex setups using predominantly higher time frame order blocks alongside confirmation breaks of structure.
Let’s see what price action is telling us today!
💡Here are some trade confluences📝
✅4 hour order block
✅4 hour 50 EMA rejection
✅Intraday 15' order block to be identified
✅Tokyo ranges to be filled
🔑 Remember, to participate in trading comes always with a degree of risk, therefore as professional risk managers it remains vital that we stick to our risk management plan as well as our trading strategies.
📈The rest, we leave to the balance of probabilities.
💡Fail to plan. Plan to fail.
🏆It has always been that simple.
❤️Good luck with your trading journey, I shall see you at the very top.
🎯Trade consistent, FRGNT X

Bearish reversal off pullback resistance?The Fiber (EUR/USD) is rising towards the pivot, which is a pullback resistance, and could drop to the 1st support, which is a pullback support.
Pivot: 1.1521
1st Support: 1.1065
1st Resistance: 1.1665
Risk Warning:
Trading Forex and CFDs carries a high level of risk to your capital and you should only trade with money you can afford to lose. Trading Forex and CFDs may not be suitable for all investors, so please ensure that you fully understand the risks involved and seek independent advice if necessary.
Disclaimer:
The above opinions given constitute general market commentary, and do not constitute the opinion or advice of IC Markets or any form of personal or investment advice.
Any opinions, news, research, analyses, prices, other information, or links to third-party sites contained on this website are provided on an "as-is" basis, are intended only to be informative, is not an advice nor a recommendation, nor research, or a record of our trading prices, or an offer of, or solicitation for a transaction in any financial instrument and thus should not be treated as such. The information provided does not involve any specific investment objectives, financial situation and needs of any specific person who may receive it. Please be aware, that past performance is not a reliable indicator of future performance and/or results. Past Performance or Forward-looking scenarios based upon the reasonable beliefs of the third-party provider are not a guarantee of future performance. Actual results may differ materially from those anticipated in forward-looking or past performance statements. IC Markets makes no representation or warranty and assumes no liability as to the accuracy or completeness of the information provided, nor any loss arising from any investment based on a recommendation, forecast or any information supplied by any third-party.

6E Weekly Trajections I've marked out the FVG's on the 15m TF. This is my idea on where the price will be going over the next week. Make sure we watch for tariff news since a lot is going on with the courts.

EURUSD Possible AnalysisEURUSD has been overall bullish with retracemets here and there. It has recently made a deep retracement that could be mistaken for a shift in market structure, while in reality it's just liquidity accumulation. Price recently shifted structure back to bullish on 4h timeframe where it preceded to break more structure before retracing to sweep liquidity below a low and tap a fvg in the process. It preceded to shift structure on the 1h time frame, breaking with a huge bullish candle symbolizing increase in bullish momentum. It is currently retracing towards an orderblock that was responsible for the break and could possibly retest it and fill the imbalance above it before it continues its bullish move up to take out the latest weak high.

EURUSD Bull Flag and 1week Golden Cross pushing it higher.EURUSD is on a Bull Flag pattern and just completed a 1week Golden Cross.
The structure is identical to the last 1week Golden Cross on January 11th 2021, which was also formed at the end of a Bull Flag pattern.
That formation pushed the pair higher to complete a 2.0 Fibonacci extension Top.
Buy and target 1.1800.
Follow us, like the idea and leave a comment below!!

EURGBP Megaphone bottom. Strong buy opportunity.The EURGBP pair is trading within a Bullish Megaphone since the start of the year. For the past 2 weeks it has been ranging within the 1D MA50 (blue trend-line) and 1D MA200 (orange trend-line).
This is technically the bottom formation of the pattern on its new Higher Low, as the 1D RSI has been printing the same sequence as February's which priced the previous Higher Low.
We are expecting at least a Resistance 1 test at 0.87400.
-------------------------------------------------------------------------------
** Please LIKE 👍, FOLLOW ✅, SHARE 🙌 and COMMENT ✍ if you enjoy this idea! Also share your ideas and charts in the comments section below! This is best way to keep it relevant, support us, keep the content here free and allow the idea to reach as many people as possible. **
-------------------------------------------------------------------------------
Disclosure: I am part of Trade Nation's Influencer program and receive a monthly fee for using their TradingView charts in my analysis.
💸💸💸💸💸💸
👇 👇 👇 👇 👇 👇

EURNZDHello Traders! 👋
What are your thoughts on EURNZD?
The EURNZD pair is currently trading below a key resistance zone, showing signs of hesitation near this level.
We expect the price to consolidate briefly within this area, and then decline toward the specified support level if the resistance holds.
As long as the pair remains below resistance, the bearish bias remains intact, and a move lower is likely.
Don’t forget to like and share your thoughts in the comments! ❤️

EUR/CHF Triangle Setup- Breakout or Breakdown ImminentThe EUR/CHF pair is currently consolidating within a triangle pattern on the 1-hour chart. This type of pattern typically forms when neither buyers nor sellers are in full control, leading to a tightening price range between descending resistance and ascending or flat support. In this case, the resistance trendline (marked in red) is sloping downward, while the support zone (highlighted in green) remains relatively flat around the 0.9330–0.9335 region.
The repeated tests of both resistance and support lines suggest that a major breakout or breakdown is likely approaching. The height of the triangle (measured from the initial impulse move) provides the basis for projecting potential breakout and breakdown targets.
🔼 Breakout Scenario (Bullish):
If price breaks above the descending resistance line, especially with volume confirmation, it may trigger a bullish move toward the breakout target of 0.9406. This level is calculated by adding the height of the triangle to the breakout point. Traders could look for buying opportunities upon breakout with stops placed below the breakout candle or just under the triangle.
🔽 Breakdown Scenario (Bearish):
Alternatively, if price breaks below the flat support zone, a bearish continuation is expected, targeting 0.9281, which is derived by subtracting the triangle's height from the breakdown level. This would indicate sellers regaining control, and the pair may revisit recent swing lows. A breakdown with strong bearish candles would validate this move.
📌 Strategy Notes:
This is a neutral-to-directional setup, meaning traders should wait for a confirmed breakout or breakdown before entering.
Volatility contraction inside the triangle typically precedes an explosive move.
Entry can be taken post-breakout with volume, or with a retest of the broken trendline for confirmation.
===============================================================
Disclosure: I am part of Trade Nation's Influencer program and receive a monthly fee for using their TradingView charts in my analysis.

Bearish reversal off pullback resistance?The Fiber (EUR/USD) is rising towards the pivot and could reverse to the support.
Pivot: 1.1424
1st Support: 1.1237
1st Resistance: 1.1555
Risk Warning:
Trading Forex and CFDs carries a high level of risk to your capital and you should only trade with money you can afford to lose. Trading Forex and CFDs may not be suitable for all investors, so please ensure that you fully understand the risks involved and seek independent advice if necessary.
Disclaimer:
The above opinions given constitute general market commentary, and do not constitute the opinion or advice of IC Markets or any form of personal or investment advice.
Any opinions, news, research, analyses, prices, other information, or links to third-party sites contained on this website are provided on an "as-is" basis, are intended only to be informative, is not an advice nor a recommendation, nor research, or a record of our trading prices, or an offer of, or solicitation for a transaction in any financial instrument and thus should not be treated as such. The information provided does not involve any specific investment objectives, financial situation and needs of any specific person who may receive it. Please be aware, that past performance is not a reliable indicator of future performance and/or results. Past Performance or Forward-looking scenarios based upon the reasonable beliefs of the third-party provider are not a guarantee of future performance. Actual results may differ materially from those anticipated in forward-looking or past performance statements. IC Markets makes no representation or warranty and assumes no liability as to the accuracy or completeness of the information provided, nor any loss arising from any investment based on a recommendation, forecast or any information supplied by any third-party.
