EURUSD: Bullish Megaphone unfolds its new bullish wave.EURUSD just turned bullish on its 1D technical outlook (RSI = 56.015, MACD = 0.004, ADX = 31.789) as it maintains a sustainable short term uptrend through a Bullish Megaphone pattern. The 1D MA50 has assumed the role of the medium term Support and the 3rd bullish wave is already under way. We expect it to repeat at least the previous +2.59% wave, having a TP = 1.14950.
## If you like our free content follow our profile to get more daily ideas. ##
## Comments and likes are greatly appreciated. ##
EUR (Euro)

EURUSD PLAN – Is the Rebound Just a Pause Before the Drop? EURUSD PLAN – Is the Rebound Just a Pause Before the Drop? | All Eyes on PCE
📊 MACRO OUTLOOK:
Following the latest FOMC meeting, the Fed kept interest rates unchanged, as expected, but maintained a hawkish tone. Chair Powell reiterated that inflation remains too sticky to consider rate cuts in the near term.
Markets now await this week’s US PCE data — the Fed’s preferred inflation gauge — which could provide the next major catalyst for USD strength or weakness.
On the Euro side, weak consumer confidence and tepid growth have strengthened expectations for an ECB rate cut in June. This divergence in monetary policy is weighing on the Euro, as the Dollar finds new demand amid global risk recalibration.
📉 TECHNICAL OUTLOOK (H1):
EURUSD has broken down from recent highs near 1.1412 and is now forming a bearish retracement pattern.
Price has broken below the 89-EMA and 200-EMA, signaling bearish structure.
Current price action suggests a temporary bounce from the 1.1260–1.1280 support zone (Fibo 38.2%–50%), but the broader trend remains bearish.
Fibonacci retracement from recent swing lows highlights 1.1338 and 1.1372 as key resistance levels to watch.
🔑 KEY TECHNICAL ZONES:
Resistance Zones:
• 1.1313 – Minor intraday level (Fibo 0.5)
• 1.1338 – EMA confluence + former structure
• 1.1372 – Major rejection zone (previous distribution top)
Support Zones:
• 1.1280 – 1.1260 – Current support bounce area
• 1.1220 – Key liquidity sweep zone
🧭 TRADE STRATEGY:
Scenario A – Sell the Pullback:
• Wait for a rebound into the 1.1313 – 1.1338 zone
• Enter SELL if bearish rejection forms
• SL: 1.1376
• TP: 1.1280 → 1.1260 → 1.1220
Scenario B – Invalid Breakout:
• If price breaks above 1.1372 with momentum, this plan is invalidated — wait for a confirmed breakout retest.
Scenario C – Reactive Buy Scalp:
• If price shows strong rejection from 1.1260 again, scalpers may consider a temporary BUY back toward 1.1300–1.1310
• This is high-risk and counter-trend.
⚠️ STRATEGIC NOTES:
EURUSD remains in a bearish bias until major resistance levels are broken. With PCE data approaching, volatility is likely. Trade setups should be based on confirmation signals and managed tightly as macro data can shift momentum rapidly.

EURCHF SHORT FORECAST Q2 W22 D29 Y25EURCHF SHORT FORECAST Q2 W22 D29 Y25
😎PLAN OF ACTION - Correct, no higher time frame order blocks, we get in, we get out. we collect our money & we move on !
NOTE - ✅Intraday 15' order block to be identified. Sit on your hands until this materialises.
Professional Risk Managers👋
Welcome back to another FRGNT chart update📈
Diving into some Forex setups using predominantly higher time frame order blocks alongside confirmation breaks of structure.
Let’s see what price action is telling us today!
💡Here are some trade confluences📝
✅Daily 50 EMA rejection
✅Weekly 50 EMA rejection
✅Intraday 15' order block to be identified
✅Tokyo ranges to be filled
🔑 Remember, to participate in trading comes always with a degree of risk, therefore as professional risk managers it remains vital that we stick to our risk management plan as well as our trading strategies.
📈The rest, we leave to the balance of probabilities.
💡Fail to plan. Plan to fail.
🏆It has always been that simple.
❤️Good luck with your trading journey, I shall see you at the very top.
🎯Trade consistent, FRGNT X

SCALP LTF - EURCHF SHORT FORECAST Q2 W22 D28 Y25EURCHF SHORT FORECAST Q2 W22 D28 Y25
😎PLAN OF ACTION - Correct, no higher time frame order blocks, we get in, we get out. we collect our money & we move on !
Professional Risk Managers👋
Welcome back to another FRGNT chart update📈
Diving into some Forex setups using predominantly higher time frame order blocks alongside confirmation breaks of structure.
Let’s see what price action is telling us today!
💡Here are some trade confluences📝
✅Daily 50 EMA rejection
✅Weekly 50 EMA rejection
✅Intraday 15' order block
✅Tokyo ranges to be filled
🔑 Remember, to participate in trading comes always with a degree of risk, therefore as professional risk managers it remains vital that we stick to our risk management plan as well as our trading strategies.
📈The rest, we leave to the balance of probabilities.
💡Fail to plan. Plan to fail.
🏆It has always been that simple.
❤️Good luck with your trading journey, I shall see you at the very top.
🎯Trade consistent, FRGNT X

EURO - Price can rise a little and then start to declineHi guys, this is my overview for EURUSD, feel free to check it and write your feedback in comments👊
Some time ago, price entered a falling channel, where it broke through $1.1310 level at once, but soon broke it again.
Price traded near this level for some time, after which it reached resistance line and continued to decline.
Then price broke $1.1310 level and dropped to $1.1065 level, after which it turned around and started to grow within the channel.
In the rising channel, Euro broke $1.1140 level and continued to grow, but later made a correction to this level.
After this, price continued to grow and later broke $1.1310 level, then rose to the resistance line of the channel.
I expect that Euro will rise to resistance line and then start to decline to the $1.1310 support level.
If this post is useful to you, you can support me with like/boost and advice in comments❤️
Disclaimer: As part of ThinkMarkets’ Influencer Program, I am sponsored to share and publish their charts in my analysis.

EURNZD Set To Grow! BUY!
My dear subscribers,
EURNZD looks like it will make a good move, and here are the details:
The market is trading on 1.8983 pivot level.
Bias - Bullish
Technical Indicators: Both Super Trend & Pivot HL indicate a highly probable Bullish continuation.
Target - 1.9022
About Used Indicators:
The average true range (ATR) plays an important role in 'Supertrend' as the indicator uses ATR to calculate its value. The ATR indicator signals the degree of price volatility.
Disclosure: I am part of Trade Nation's Influencer program and receive a monthly fee for using their TradingView charts in my analysis.
———————————
WISH YOU ALL LUCK

EURNZD: Double Confluence with Fibonacci and Head & Shoulders
EURNZD shows a potential bearish reversal setup after hitting the resistance zone at 1.9100 . The price has rejected from the 0.786 Fibonacci retracement level , aligning closely with the psychological resistance at 1.9100 — forming a double confluence.
A potential short-term retracement is expected toward the 1.88300 zone, which is projected by the 1.618 Fibonacci extension and acts as a round figure support level .
🟩 Key Levels:
- Resistance: 1.9100 (also recent swing high)
- Expected Target: 1.88300
- Invalidation Above: A clean breakout and close above 1.9100
---------------------
📍 4H Chart Analysis
A Head and Shoulders pattern is clearly forming on the 4H timeframe. The price is currently testing the neckline zone , and if a breakdown occurs, it may confirm a deeper bearish movement , adding higher timeframe support to the bearish idea.
This structure further strengthens the bias that the recent bullish retracement might have ended, and the next leg could be downward toward the expected zone.
The confluence of Fibonacci levels on the 1H chart and the bearish Head & Shoulders formation on the 4H chart suggests that bears might take control below 1.9100 . As long as the price stays under this key resistance, the bearish outlook remains valid, targeting 1.88300.

Bullish bounce?EUR/USD is falling towards the support level which is an overlap support that aligns with the 38.2% Fibonacci retracement and could bounce from this level to our take profit.
Entry: 1.1273
Why we like it:
There is an overlap support level that lines up with the 38.2% Fibonacci retracement.
Stop loss: 1.1164
Why we like it:
There is a pullback support level that is slightly above the 78.6% Fibonacci retracement.
Take profit: 1.1415
Why we like it:
There is a pullback resistance level.
Enjoying your TradingView experience? Review us!
Please be advised that the information presented on TradingView is provided to Vantage (‘Vantage Global Limited’, ‘we’) by a third-party provider (‘Everest Fortune Group’). Please be reminded that you are solely responsible for the trading decisions on your account. There is a very high degree of risk involved in trading. Any information and/or content is intended entirely for research, educational and informational purposes only and does not constitute investment or consultation advice or investment strategy. The information is not tailored to the investment needs of any specific person and therefore does not involve a consideration of any of the investment objectives, financial situation or needs of any viewer that may receive it. Kindly also note that past performance is not a reliable indicator of future results. Actual results may differ materially from those anticipated in forward-looking or past performance statements. We assume no liability as to the accuracy or completeness of any of the information and/or content provided herein and the Company cannot be held responsible for any omission, mistake nor for any loss or damage including without limitation to any loss of profit which may arise from reliance on any information supplied by Everest Fortune Group.

Bullish bounce off overlap support?The Fiber (EUR/USD) is falling towards the pivot and could bounce to the 1st resistance.
Pivot: 1.1263
1st Support: 1.1166
1st Resistance: 1.1423
Risk Warning:
Trading Forex and CFDs carries a high level of risk to your capital and you should only trade with money you can afford to lose. Trading Forex and CFDs may not be suitable for all investors, so please ensure that you fully understand the risks involved and seek independent advice if necessary.
Disclaimer:
The above opinions given constitute general market commentary, and do not constitute the opinion or advice of IC Markets or any form of personal or investment advice.
Any opinions, news, research, analyses, prices, other information, or links to third-party sites contained on this website are provided on an "as-is" basis, are intended only to be informative, is not an advice nor a recommendation, nor research, or a record of our trading prices, or an offer of, or solicitation for a transaction in any financial instrument and thus should not be treated as such. The information provided does not involve any specific investment objectives, financial situation and needs of any specific person who may receive it. Please be aware, that past performance is not a reliable indicator of future performance and/or results. Past Performance or Forward-looking scenarios based upon the reasonable beliefs of the third-party provider are not a guarantee of future performance. Actual results may differ materially from those anticipated in forward-looking or past performance statements. IC Markets makes no representation or warranty and assumes no liability as to the accuracy or completeness of the information provided, nor any loss arising from any investment based on a recommendation, forecast or any information supplied by any third-party.

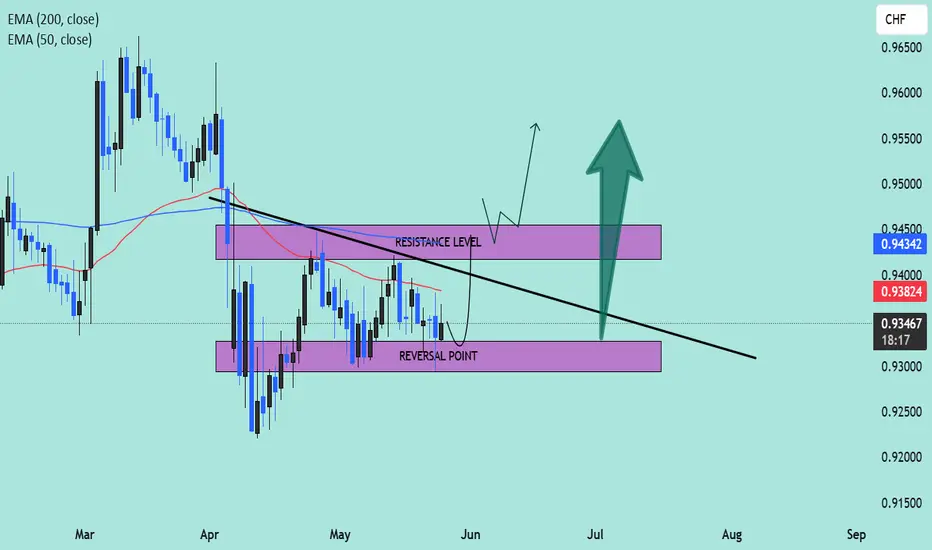
EUR/CHF Technical Outlook – Potential Bullish Reversal Setup📈 Pair: EUR/CHF
📆 Date: May 27, 2025
📊 Timeframe: Daily (D1)
📌 Technical Highlights:
🔹 Current Price: 0.93456
🔹 Key Indicators:
50 EMA (Red): 0.93824
200 EMA (Blue): 0.94342
🧠 Chart Analysis:
🔻 Downtrend Resistance Line: A clear descending trendline is pressing price lower, reinforcing a bearish structure since March.
🟣 Reversal Zone (Support Area):
Price is currently hovering just above the marked Reversal Point, a demand zone between 0.93000–0.93400. Historically, this zone has acted as a launch pad for upward momentum.
🟪 Resistance Level:
Located around 0.94300–0.94600, this zone is reinforced by the 200 EMA, making it a critical breakout area. A strong bullish close above this region could invalidate the downtrend.
🔄 Two Scenarios to Watch:
✅ Bullish Breakout Scenario:
Price may bounce from the reversal zone.
A break and retest above the resistance level could lead to bullish continuation toward 0.9500–0.9550.
Confirmation above the 200 EMA will add confidence to the breakout.
📈 Potential Buy Entry: On breakout and retest of 0.9450
🎯 Target: 0.9550
🛡️ Stop Loss: Below 0.9320
❌ Bearish Continuation Scenario:
If price fails to hold above the reversal point, sellers may regain control.
A breakdown below 0.9300 could trigger further downside toward 0.9200 or lower.
📉 Sell Setup Invalid Until: Price closes below 0.9300 on strong volume.
🧭 Conclusion:
This chart suggests a critical decision point for EUR/CHF. A bounce from the reversal zone followed by a confirmed break above resistance could signal the start of a medium-term uptrend. Traders should monitor price action closely for confirmation signals near the trendline and EMA zones.
🚦 Bias: Neutral to Bullish, awaiting confirmation
🧠 Tip: Watch for candlestick patterns (like bullish engulfing or pin bars) near the support zone for early entries.
EURUSDThis is the most awaited push.
With the re-tests and each weak hand to strong hand transfer I see this level as a very strong support and the area to start the most expected rally of the USD alternative.

EURNZD My Opinion! BUY!
My dear followers,
I analysed this chart on EURNZD and concluded the following:
The market is trading on 1.8990 pivot level.
Bias - Bullish
Technical Indicators: Both Super Trend & Pivot HL indicate a highly probable Bullish continuation.
Target - 1.9043
About Used Indicators:
A super-trend indicator is plotted on either above or below the closing price to signal a buy or sell. The indicator changes color, based on whether or not you should be buying. If the super-trend indicator moves below the closing price, the indicator turns green, and it signals an entry point or points to buy.
Disclosure: I am part of Trade Nation's Influencer program and receive a monthly fee for using their TradingView charts in my analysis.
———————————
WISH YOU ALL LUCK

EURCHF INTRADAY Bearish below 0.9430 The pair is in a bearish trend, with recent price action showing a bounce (oversold rally) that was rejected near 0.9430, a key resistance level from previous consolidation.
This rejection suggests sellers are still in control.
Key Levels to Watch:
Resistance: 0.9430 (key level), then 0.9500 and 0.9600 if broken.
Support: 0.9155, followed by 0.9100 and 0.9050.
Trading Outlook:
Bearish scenario: If price fails to break above 0.9430, expect a move lower toward 0.9300, with extended downside to 0.9200 and 0.9130 over time.
Bullish scenario: A daily close above 0.9430 would invalidate the bearish view and could lead to a move toward 0.9500 and possibly 0.9600.
Conclusion: EUR/CHF remains bearish unless price breaks and holds above 0.9430. Traders may look for short opportunities below resistance or switch to a bullish bias on a confirmed breakout.
This communication is for informational purposes only and should not be viewed as any form of recommendation as to a particular course of action or as investment advice. It is not intended as an offer or solicitation for the purchase or sale of any financial instrument or as an official confirmation of any transaction. Opinions, estimates and assumptions expressed herein are made as of the date of this communication and are subject to change without notice. This communication has been prepared based upon information, including market prices, data and other information, believed to be reliable; however, Trade Nation does not warrant its completeness or accuracy. All market prices and market data contained in or attached to this communication are indicative and subject to change without notice.

Deciphering EURUSD —Highest Level Since 2018 (1.40)This was a hard chart, I couldn't quite put my finger on it. I had to check multiple timeframes and several indicators, it was all mixed, plus, I had the geopolitical landscape in mind which made it even harder. All is clear after looking at the monthly timeframe. The weekly and daily MACD were also of help. MA200 revealed the trend. The RSI as well.
Here is the conclusion: The Euro is going to rally against the dollar. Next long-term target is 1.40 as shown on the chart. There will be a strong rise on this pair.
Current monthly candle is quite revealing, this month will close ultra-strong, super bullish signal. Four months closing green. Rising volume.
I don't know how you trade this stuff but the trend is up. Betting with the trend can increase positive results. EURUSD is going up. Up, up, up, up, up, up, up.
Namaste.

Bullish bounce?EUR/GBP is falling towards the pivot and could bounce to the 1st resistance, which has been identified as an overlap resistance.
Pivot: 0.8377
1st Support: 0.8326
1st Resistance: 0.8461
Risk Warning:
Trading Forex and CFDs carries a high level of risk to your capital and you should only trade with money you can afford to lose. Trading Forex and CFDs may not be suitable for all investors, so please ensure that you fully understand the risks involved and seek independent advice if necessary.
Disclaimer:
The above opinions given constitute general market commentary, and do not constitute the opinion or advice of IC Markets or any form of personal or investment advice.
Any opinions, news, research, analyses, prices, other information, or links to third-party sites contained on this website are provided on an "as-is" basis, are intended only to be informative, is not an advice nor a recommendation, nor research, or a record of our trading prices, or an offer of, or solicitation for a transaction in any financial instrument and thus should not be treated as such. The information provided does not involve any specific investment objectives, financial situation and needs of any specific person who may receive it. Please be aware, that past performance is not a reliable indicator of future performance and/or results. Past Performance or Forward-looking scenarios based upon the reasonable beliefs of the third-party provider are not a guarantee of future performance. Actual results may differ materially from those anticipated in forward-looking or past performance statements. IC Markets makes no representation or warranty and assumes no liability as to the accuracy or completeness of the information provided, nor any loss arising from any investment based on a recommendation, forecast or any information supplied by any third-party.

Bullish bounce off pullback support?EUR/AUD has bounced off the pivot, which is a pullback support, and could rise to the 1st resistance, which acts as a pullback resistance.
Pivot: 1.75099
1st Support: 1.73653
1st Resistance: 1.77533
Risk Warning:
Trading Forex and CFDs carries a high level of risk to your capital and you should only trade with money you can afford to lose. Trading Forex and CFDs may not be suitable for all investors, so please ensure that you fully understand the risks involved and seek independent advice if necessary.
Disclaimer:
The above opinions given constitute general market commentary, and do not constitute the opinion or advice of IC Markets or any form of personal or investment advice.
Any opinions, news, research, analyses, prices, other information, or links to third-party sites contained on this website are provided on an "as-is" basis, are intended only to be informative, is not an advice nor a recommendation, nor research, or a record of our trading prices, or an offer of, or solicitation for a transaction in any financial instrument and thus should not be treated as such. The information provided does not involve any specific investment objectives, financial situation and needs of any specific person who may receive it. Please be aware, that past performance is not a reliable indicator of future performance and/or results. Past Performance or Forward-looking scenarios based upon the reasonable beliefs of the third-party provider are not a guarantee of future performance. Actual results may differ materially from those anticipated in forward-looking or past performance statements. IC Markets makes no representation or warranty and assumes no liability as to the accuracy or completeness of the information provided, nor any loss arising from any investment based on a recommendation, forecast or any information supplied by any third-party.

Momentum builds in GBP/USD and NZD/USD following tariff delayThe U.S. dollar weakened sharply in recent sessions as President Trump's announcement that the proposed 50% tariffs on EU imports will now be delayed until July 9, giving markets temporary relief.
GBP/USD edged toward 1.3600, testing levels last seen three years ago. The RSI sits just under 60, suggesting there’s still room before overbought conditions are reached. Volume has been gradually increasing, potentially reinforcing the strength of the breakout.
Risk-on flows also lifted the Australian and New Zealand dollars. NZD/USD has broken above the Ichimoku cloud and rose 0.62% on the day. Price is well above the Tenkan-sen (blue) and Kijun-sen (red), indicating strong upward momentum. However, the pair is pulling back slightly after the sharp breakout, suggesting short-term consolidation.

Bearish reversal?EUR/JPY is rising towards the resistance level which is an overlap resistance that lines up with the 50% Fibonacci retracement and could drop from this level to our take profit.
Entry: 163.18
Why we like it:
There is an overlap resistance level that lines up with the 50% Fibonacci retracement.
Stop loss: 163.18
Why we like it:
There is a pullback resistance level that is slightly above the 61.8% Fibonacci retracement.
Take profit: 161.61
Why we like it:
There is a pullback support level.
Enjoying your TradingView experience? Review us!
Please be advised that the information presented on TradingView is provided to Vantage (‘Vantage Global Limited’, ‘we’) by a third-party provider (‘Everest Fortune Group’). Please be reminded that you are solely responsible for the trading decisions on your account. There is a very high degree of risk involved in trading. Any information and/or content is intended entirely for research, educational and informational purposes only and does not constitute investment or consultation advice or investment strategy. The information is not tailored to the investment needs of any specific person and therefore does not involve a consideration of any of the investment objectives, financial situation or needs of any viewer that may receive it. Kindly also note that past performance is not a reliable indicator of future results. Actual results may differ materially from those anticipated in forward-looking or past performance statements. We assume no liability as to the accuracy or completeness of any of the information and/or content provided herein and the Company cannot be held responsible for any omission, mistake nor for any loss or damage including without limitation to any loss of profit which may arise from reliance on any information supplied by Everest Fortune Group.

Could the price bounce from here?EUR/GBP is falling towards the support level that lines up with the 127.2% Fibonacci extension and the 61.8% Fibonacci projection and could bounce from this level too ur take profit.
Entry: 0.8373
Why we like it:
There is an overlap support level that lines up with the 127.2% Fibonacci extension and the 61.8% Fibonacci projection.
Stop loss: 0.8322
Why we like it:
There is a pullback support level that is slightly above the 100% Fibonacci projection.
Take profit: 0.8444
Why we lik eit:
There is a pullback resistance level.
Enjoying your TradingView experience? Review us!
Please be advised that the information presented on TradingView is provided to Vantage (‘Vantage Global Limited’, ‘we’) by a third-party provider (‘Everest Fortune Group’). Please be reminded that you are solely responsible for the trading decisions on your account. There is a very high degree of risk involved in trading. Any information and/or content is intended entirely for research, educational and informational purposes only and does not constitute investment or consultation advice or investment strategy. The information is not tailored to the investment needs of any specific person and therefore does not involve a consideration of any of the investment objectives, financial situation or needs of any viewer that may receive it. Kindly also note that past performance is not a reliable indicator of future results. Actual results may differ materially from those anticipated in forward-looking or past performance statements. We assume no liability as to the accuracy or completeness of any of the information and/or content provided herein and the Company cannot be held responsible for any omission, mistake nor for any loss or damage including without limitation to any loss of profit which may arise from reliance on any information supplied by Everest Fortune Group.

EURUSD Rally already underway on the 1D MA50.The EURUSD pair has been trading within a Channel Up since practically the beginning of the year. The recent rebound (May 12) on its 1D MA50 (blue trend-line) has technically started the pattern's new Bullish Leg.
Given that the previous two have risen by +7.50% on average, and were both confirmed by a 1D MACD Bullish Cross like the one formed today, we expect a minimum +7.20% rise from the bottom. Our Target is 1.18500.
-------------------------------------------------------------------------------
** Please LIKE 👍, FOLLOW ✅, SHARE 🙌 and COMMENT ✍ if you enjoy this idea! Also share your ideas and charts in the comments section below! This is best way to keep it relevant, support us, keep the content here free and allow the idea to reach as many people as possible. **
-------------------------------------------------------------------------------
Disclosure: I am part of Trade Nation's Influencer program and receive a monthly fee for using their TradingView charts in my analysis.
💸💸💸💸💸💸
👇 👇 👇 👇 👇 👇

EURNZD: Bulls Will Push Higher
Looking at the chart of EURNZD right now we are seeing some interesting price action on the lower timeframes. Thus a local move up seems to be quite likely.
Disclosure: I am part of Trade Nation's Influencer program and receive a monthly fee for using their TradingView charts in my analysis.
❤️ Please, support our work with like & comment! ❤️

Pullback or Deeper Reversal After False Breakout Near 1.1425? EUR/USD Weekly Plan: Pullback or Deeper Reversal After False Breakout Near 1.1425?
🧭 MARKET OVERVIEW
EUR/USD surged toward a new monthly high at 1.1425 earlier this week but quickly lost momentum and retraced to the 1.137x zone as the US Dollar bounced back. While the short-term recovery in DXY supported the dip, macro uncertainty surrounding Trump’s erratic trade policies continues to raise questions about the dollar’s long-term credibility.
Meanwhile, Germany’s revised Q1 GDP growth of 0.4% (vs. 0.2% prior) helped support EUR, reinforcing its appeal as a safe alternative to the greenback.
📊 TECHNICAL ANALYSIS (H1 Chart)
Main Trend: Short-term correction after strong bullish rally
Resistance Levels:
1.14165 → Previous top, strong reversal zone
1.14017 → Minor supply zone
Support Levels:
1.13476 → Key break structure zone
1.12791 → Daily demand zone & previous FVG bottom
Indicators:
EMA 20 & EMA 50 crossover signals weakening bullish momentum
Price Pattern: Potential double top forming below 1.1425
🌐 MACRO & FUNDAMENTAL CONTEXT
Trump’s tariff threat postponed to July 9, but his unpredictable tone weakens USD trust.
Germany Q1 GDP upgraded to 0.4% → boosts confidence in Eurozone’s economic resilience.
ECB expected to cut rates in June, with policymakers showing confidence inflation will reach 2% target this year.
This week’s key focus:
→ US PCE Price Index (April)
→ EU May HICP (CPI)
These will drive short-term volatility and determine breakout/reversal confirmation.
✅ TRADE SETUPS
🔴 SELL ZONE:
Entry: 1.1400–1.1416
SL: 1.1440
TP: 1.1382 → 1.1347 → 1.1279
🟢 BUY SCALP ZONE:
Entry: 1.1345–1.1347
SL: 1.1320
TP: 1.1382 → 1.1400
📌 Preferred scenario: Look for bearish confirmation around 1.1400–1.1416 to enter short. Avoid aggressive buys unless price strongly holds above 1.1384.
🧩 CONCLUSION
EUR/USD is showing signs of exhaustion after testing 1.1425. If bears reclaim 1.1384 and hold below 1.1347, deeper correction toward 1.1279 is likely. Conversely, if bulls defend 1.1345 and CPI/PCE data disappoints, price may retest highs.

eurnzd buy signal. Don't forget about stop-loss.
Write in the comments all your questions and instruments analysis of which you want to see.
Friends, push the like button, write a comment, and share with your mates - that would be the best THANK YOU.
P.S. I personally will open entry if the price will show it according to my strategy.
Always make your analysis before a trade
