EURNZD Bullish Reversal from Demand Zone (1H Chart)✅ 1. Market Context & Structure Analysis
The pair (EUR/NZD) was in a short-term downtrend before forming a higher low, indicating a potential bullish reversal.
A W-shaped structure is visible, suggesting a double bottom around the 1.8960–1.8970 zone.
The price has bounced multiple times from the demand zone (green box), confirming strong buying interest.
The recent price action shows the market respecting structure with a clean impulse–correction–impulse pattern, creating a potential continuation leg.
📍 2. Entry Criteria
Entry Price Range: 1.8960 – 1.8970
Why?
This area coincides with a tested support zone, from where price previously rallied.
The current pullback to this area presents a low-risk buying opportunity.
Candlestick confirmation (e.g., bullish engulfing or pin bar) would further validate the entry.
🔐 3. Stop Loss (Risk Management)
Stop Loss Placement: Below 1.8930
Reasoning:
Keeps SL below the structure low and the demand zone.
If price breaks this level, it invalidates the bullish setup and prevents deeper losses.
🎯 4. Take Profit Levels (Targets)
TP1 -1.9050 Minor resistance / partial booking
TP2 -1.9100 First key resistance zone
TP3 -1.9140 Swing high and strong supply area (red zone)
Risk-to-Reward (R:R): ~1:2.5 to 1:3+
You can trail your stop as price moves toward these levels.
📊 5. Technical Confluences
✅ Support Zone: Price bounced multiple times from 1.8960
✅ Bullish Market Structure: Higher highs and higher lows are forming
✅ Chart Pattern: Double bottom / W-pattern breakout potential
✅ Fibonacci (optional): The zone may also align with a 61.8% retracement (not shown but often observed)
⚙️ 6. Trade Management Strategy
🔄 Partial Exit: Book 50% profits at TP1
⏫ Trail SL: Move SL to entry after TP1 hit to make trade risk-free
🔚 Full Exit: At TP3 or if strong bearish reversal candle forms near resistance
⚠️ 7. Risk Disclaimer & Notes
Avoid overleveraging. Only risk 1–2% of your capital.
Reconfirm the trade setup during the London or early NY session for better volatility.
News events (like RBNZ or ECB speeches) could increase volatility — always check the economic calendar before entry.
========================================================
Disclosure: I am part of Trade Nation's Influencer program and receive a monthly fee for using their TradingView charts in my analysis.
EUR (Euro)


Bearish drop?The Fiber (EUR/USD) is rejecting off the pivot and could drop to the 1st support.
Pivot: 1.1273
1st Support: 1.1084
1st Resistance: 1.1371
Risk Warning:
Trading Forex and CFDs carries a high level of risk to your capital and you should only trade with money you can afford to lose. Trading Forex and CFDs may not be suitable for all investors, so please ensure that you fully understand the risks involved and seek independent advice if necessary.
Disclaimer:
The above opinions given constitute general market commentary, and do not constitute the opinion or advice of IC Markets or any form of personal or investment advice.
Any opinions, news, research, analyses, prices, other information, or links to third-party sites contained on this website are provided on an "as-is" basis, are intended only to be informative, is not an advice nor a recommendation, nor research, or a record of our trading prices, or an offer of, or solicitation for a transaction in any financial instrument and thus should not be treated as such. The information provided does not involve any specific investment objectives, financial situation and needs of any specific person who may receive it. Please be aware, that past performance is not a reliable indicator of future performance and/or results. Past Performance or Forward-looking scenarios based upon the reasonable beliefs of the third-party provider are not a guarantee of future performance. Actual results may differ materially from those anticipated in forward-looking or past performance statements. IC Markets makes no representation or warranty and assumes no liability as to the accuracy or completeness of the information provided, nor any loss arising from any investment based on a recommendation, forecast or any information supplied by any third-party.

EUR/GBP - Blue Box is Strong SupportIn our recent EUR / GBP analysis we observed a substantial 226‑pip decline from the peak.() Price has now settled into the blue‑boxed support area, a level at which previous pullbacks found buyers and genuine value emerged.
It follows, then, that if price can break above the nearby red‑boxed resistance on lower‑time‑frame charts, with clear follow‑through rather than a fleeting spike, a long position would be entirely reasonable. Such a breakout would signal that demand has overcome supply pressure, restoring the upward trend in a disciplined, verifiable way.
Throughout our work, we have never relied on guesswork or emotion. Every level is chosen through careful study of price behavior and hard data, and our methodology has consistently delivered high accuracy as a result. In the spirit of prudent analysis, we ask only for confirmation of these key levels before committing capital, an approach that has served us well and should serve our followers equally.
📌I keep my charts clean and simple because I believe clarity leads to better decisions.
📌My approach is built on years of experience and a solid track record. I don’t claim to know it all but I’m confident in my ability to spot high-probability setups.
📌If you would like to learn how to use the heatmap, cumulative volume delta and volume footprint techniques that I use below to determine very accurate demand regions, you can send me a private message. I help anyone who wants it completely free of charge.
🔑I have a long list of my proven technique below:
🎯 ZENUSDT.P: Patience & Profitability | %230 Reaction from the Sniper Entry
🐶 DOGEUSDT.P: Next Move
🎨 RENDERUSDT.P: Opportunity of the Month
💎 ETHUSDT.P: Where to Retrace
🟢 BNBUSDT.P: Potential Surge
📊 BTC Dominance: Reaction Zone
🌊 WAVESUSDT.P: Demand Zone Potential
🟣 UNIUSDT.P: Long-Term Trade
🔵 XRPUSDT.P: Entry Zones
🔗 LINKUSDT.P: Follow The River
📈 BTCUSDT.P: Two Key Demand Zones
🟩 POLUSDT: Bullish Momentum
🌟 PENDLEUSDT.P: Where Opportunity Meets Precision
🔥 BTCUSDT.P: Liquidation of Highly Leveraged Longs
🌊 SOLUSDT.P: SOL's Dip - Your Opportunity
🐸 1000PEPEUSDT.P: Prime Bounce Zone Unlocked
🚀 ETHUSDT.P: Set to Explode - Don't Miss This Game Changer
🤖 IQUSDT: Smart Plan
⚡️ PONDUSDT: A Trade Not Taken Is Better Than a Losing One
💼 STMXUSDT: 2 Buying Areas
🐢 TURBOUSDT: Buy Zones and Buyer Presence
🌍 ICPUSDT.P: Massive Upside Potential | Check the Trade Update For Seeing Results
🟠 IDEXUSDT: Spot Buy Area | %26 Profit if You Trade with MSB
📌 USUALUSDT: Buyers Are Active + %70 Profit in Total
🌟 FORTHUSDT: Sniper Entry +%26 Reaction
🐳 QKCUSDT: Sniper Entry +%57 Reaction
📊 BTC.D: Retest of Key Area Highly Likely
📊 XNOUSDT %80 Reaction with a Simple Blue Box!
📊 BELUSDT Amazing %120 Reaction!
📊 Simple Red Box, Extraordinary Results
I stopped adding to the list because it's kinda tiring to add 5-10 charts in every move but you can check my profile and see that it goes on..

Unlock XAUEUR Riches: Thief Trading’s Epic Long Setup!💎 Epic Gold Heist: XAUEUR Trade Plan💎
Greetings, Wealth Raiders & Market Mavericks! 👋🌍
Ready to pull off a legendary heist in the XAUEUR "Gold vs Euro" market? Our Thief Trading Style blends slick technicals with sharp fundamentals to unlock the vault. Follow this cunning plan, aim for the high-stakes Red Zone, and let’s swipe the profits! 🤑💰 This is a high-risk, overbought setup with potential for consolidation or a trend reversal—perfect for bold traders. Stay sharp, trade safe, and let’s get rich! 💪🎉
📈 Entry: Crack the Vault!
The bullish trend is ripe for the taking! 💥
Place buy limit orders at the most recent swing low or high within a 15 or 30-minute timeframe.
Pro tip: Set price alerts on your chart to catch the perfect entry.
For the fearless, jump in at market price—the heist is LIVE! 🚀
🛑 Stop Loss: Guard Your Loot
Protect your stash with a Thief Stop Loss:
Set SL at the nearest/recent low on the 4H timeframe (~€2800.00 for swing trades).
Adjust SL based on your risk tolerance, lot size, and number of orders.
Stay disciplined—don’t let the bears snatch your gains! 🐻
🎯 Target: Grab the Gold
Aim for €3070.00 or exit early to secure profits.
Scalpers: Stick to long-side scalps with quick hits. Use trailing SL to lock in gains.
Swing Traders: Hold for the big score, trailing your SL to ride the trend safely. 💸
🧠 Why This Trade? Real-Time Data & Insights (May 19, 2025)
The XAUEUR market is riding a bullish wave, fueled by macro and fundamental drivers. Here’s the latest scoop:
Technical Analysis 📊:
Gold broke key support at $3200 (~€3000) last week but is showing signs of consolidation near €3050.
RSI indicates overbought conditions, hinting at a potential pullback or reversal. Watch for bearish traps at €3070.
4H chart shows a strong uptrend with support at €3000 and resistance at €3070.
Fundamental Drivers 📰:
US-China Trade Deal Hopes: Easing tensions are weighing on gold’s safe-haven appeal, pushing prices lower.
Central Bank Buying: Demand from China and emerging markets (1,136 tonnes in 2022) supports long-term bullishness.
US Economic Data: Mixed signals from April’s US CPI and a Q1 2025 GDP contraction (-0.3%) keep markets volatile.
Macro Economics 🌍:
Trump’s tariffs (25% on Mexico/Canada, 20% on China) are stoking inflation fears, which could boost gold if growth falters.
A weaker USD (down 3% from February highs) supports XAUEUR’s upside.
ECB may cut rates below 2%, weakening the Euro and lifting XAUEUR.
COT Report & Positioning 📋:
OANDA sentiment shows 73% of traders net-long on gold, signaling bullish bias but potential for a squeeze if sentiment shifts.
Comex gold inventories are rising, indicating arbitrage opportunities and strong physical demand.
Seasonal Factors 📅:
Gold typically sees strength in Q2 due to wedding season demand in Asia and safe-haven buying amid geopolitical noise.
May often marks consolidation after Q1 rallies, so watch for volatility.
Sentiment Outlook (May 19, 2025) 😊:
Real-Time Sentiment: Market mood is cautiously bullish, with 65% of analysts favoring longs but warning of overbought risks.
Risk appetite is improving due to trade deal optimism, but geopolitical tensions (e.g., EU-US tariff threats) keep gold attractive.
Social media buzz on gold’s resilience despite recent dips, with traders eyeing €3100 by June.
Future Trend Outlook Score ⭐:
Short-Term (1-2 weeks): 7/10 (Bullish with caution due to overbought signals).
Medium-Term (1-3 months): 8/10 (Supported by central bank demand and inflation fears).
Long-Term (6-12 months): 9/10 (Gold could hit €3200 if trade wars escalate).
⚠️ Trading Alert: News & Position Management
News releases can flip the market faster than a getaway car! 🚗💨
Avoid new trades during high-impact events (e.g., US CPI, Fed speeches).
Use trailing stop-loss orders to lock in profits and protect running positions.
Check economic calendars for updates—Thursday’s macro data could shake things up!
💥 Boost the Heist!
Love this plan? Smash the Boost Button to supercharge our robbery squad! 🚀 Every like and view fuels our mission to conquer the markets. Join the Thief Trading Style crew, steal profits daily, and live the wealthy life! 🤝💖
Stay tuned for the next heist—I’ll be back with another epic plan! 🐱👤🤑

Potential bearish drop?EUR/USD is reacting off the resistance level which is an overlap resistance and could drop from this level to our take profit.
Entry: 1.1270
Why we like it:
There is an overlap resistance level.
Stop loss: 1.1374
Why we like it:
There is a pullback resistance level that lines up with the 61.8% Fibonacci retracement.
Take profit: 1.1139
Why we like it:
There is a pullback support level.
Enjoying your TradingView experience? Review us!
Please be advised that the information presented on TradingView is provided to Vantage (‘Vantage Global Limited’, ‘we’) by a third-party provider (‘Everest Fortune Group’). Please be reminded that you are solely responsible for the trading decisions on your account. There is a very high degree of risk involved in trading. Any information and/or content is intended entirely for research, educational and informational purposes only and does not constitute investment or consultation advice or investment strategy. The information is not tailored to the investment needs of any specific person and therefore does not involve a consideration of any of the investment objectives, financial situation or needs of any viewer that may receive it. Kindly also note that past performance is not a reliable indicator of future results. Actual results may differ materially from those anticipated in forward-looking or past performance statements. We assume no liability as to the accuracy or completeness of any of the information and/or content provided herein and the Company cannot be held responsible for any omission, mistake nor for any loss or damage including without limitation to any loss of profit which may arise from reliance on any information supplied by Everest Fortune Group.

EURUSD 1st 4H Death Cross after 7 months. Is it enough to short?The EURUSD pair just formed its first Death Cross on the 4H time-frame since October 04 2024. The last such formation signaled the bearish extension of the trend by breaking below its Higher Lows trend-line.
That was a similar Higher Lows trend-line the price rebounded on on May 12, exactly on the 1D MA50 (red trend-line). With the 1D RSI on levels similar with that previous Death Cross, we will wait for confirmation before shorting again and the price to break is the Higher Low/ 1D MA50 Cluster.
If broken, our Target will be just above the 0.618 Fibonacci from the bottom at 1.07350.
-------------------------------------------------------------------------------
** Please LIKE 👍, FOLLOW ✅, SHARE 🙌 and COMMENT ✍ if you enjoy this idea! Also share your ideas and charts in the comments section below! This is best way to keep it relevant, support us, keep the content here free and allow the idea to reach as many people as possible. **
-------------------------------------------------------------------------------
Disclosure: I am part of Trade Nation's Influencer program and receive a monthly fee for using their TradingView charts in my analysis.
💸💸💸💸💸💸
👇 👇 👇 👇 👇 👇

EUR/USD DAILY PLAN – BREAKOUT CONFIRMATION OR FAKEOUT TRAP?EUR/USD DAILY PLAN – BREAKOUT CONFIRMATION OR FAKEOUT TRAP?
🧠 Macro Overview
This week’s trading landscape is influenced by both European and U.S. developments:
EU Side: There are no major macroeconomic releases ahead, but expectations are growing that the ECB may adopt a more dovish tone in upcoming meetings. If inflation continues to cool, the euro may face downside pressure.
U.S. Side: Last week’s CPI and PPI data showed signs of cooling inflation, yet not enough for the Fed to shift gears. The U.S. dollar remains supported by the prospect of “higher for longer” interest rates.
Global Sentiment: Ongoing U.S.–China tensions and trade policy updates in Europe are keeping risk appetite cautious. The EUR/USD pair is testing a key zone and may break out of the descending channel soon — or reject hard if buyers fail to hold.
📊 Technical Analysis (H1 Chart)
EUR/USD bounced strongly from the 1.1160 – 1.1180 demand zone and is now testing the key resistance at 1.1237 — a confluence of descending trendline and the 200 EMA on the 1H chart.
A clean breakout above and sustained hold of 1.1237 could pave the way toward higher resistance levels at 1.1270 and 1.1325.
However, if the pair gets rejected at 1.1237, it may fall back to test the lower support at 1.1160 – 1.1180, possibly forming a range before a larger move.
📌 Key Levels to Watch
🔺 Resistance Levels:
1.1237 → Key confluence zone (EMA200 + trendline)
1.1270 → Previous swing high
1.1302 – 1.1325 → Upper resistance zone with Fibo confluence
🔻 Support Levels:
1.1180 → Immediate demand area
1.1160 → Critical trendline support
A break below 1.1160 could trigger stronger bearish momentum
🎯 Trading Scenarios
1. Bullish Breakout Above 1.1237
🔹 Entry: 1.1240 – 1.1250
🔹 SL: 1.1210
🔹 TP: 1.1270 → 1.1302 → 1.1325
2. Bearish Rejection at 1.1237
🔻 Entry: 1.1230 – 1.1225
🔻 SL: 1.1255
🔻 TP: 1.1180 → 1.1160
3. Buy-the-Dip at Key Support
🔹 Entry: 1.1165 – 1.1170
🔹 SL: 1.1135
🔹 TP: 1.1200 → 1.1230
⚠️ Key Notes:
Avoid entering trades during chop between 1.1215 – 1.1237 unless breakout confirmation appears.
Be cautious of liquidity grabs during London and NY session opens.
Stick to tight risk management as market remains uncertain and range-bound.
📌 Conclusion:
EUR/USD is at a decision point. Whether bulls take control or sellers defend key resistance will determine short-term trend direction. Trade the breakout or the reaction — not the prediction.

Bearish drop?The Fiber (EUR/USD) is rising towards the pivot and could drop to the 1st support.
Pivot: 1.1281
1st Support: 1.1051
1st Resistance: 1.1424
Risk Warning:
Trading Forex and CFDs carries a high level of risk to your capital and you should only trade with money you can afford to lose. Trading Forex and CFDs may not be suitable for all investors, so please ensure that you fully understand the risks involved and seek independent advice if necessary.
Disclaimer:
The above opinions given constitute general market commentary, and do not constitute the opinion or advice of IC Markets or any form of personal or investment advice.
Any opinions, news, research, analyses, prices, other information, or links to third-party sites contained on this website are provided on an "as-is" basis, are intended only to be informative, is not an advice nor a recommendation, nor research, or a record of our trading prices, or an offer of, or solicitation for a transaction in any financial instrument and thus should not be treated as such. The information provided does not involve any specific investment objectives, financial situation and needs of any specific person who may receive it. Please be aware, that past performance is not a reliable indicator of future performance and/or results. Past Performance or Forward-looking scenarios based upon the reasonable beliefs of the third-party provider are not a guarantee of future performance. Actual results may differ materially from those anticipated in forward-looking or past performance statements. IC Markets makes no representation or warranty and assumes no liability as to the accuracy or completeness of the information provided, nor any loss arising from any investment based on a recommendation, forecast or any information supplied by any third-party.

EURNZD at Key Decision Zone | Breakout or Breakdown?📊 Pair: EURNZD
🕒 Timeframe: Likely H1 or H4
📅 Date: May 18, 2025
🔍 Technical Analysis
🔁 Key Zones
🔴 Resistance-Turned-Support (RTS):
1.8975 – 1.8990
This area was previously a resistance level that price broke above, and is now acting as a critical support zone (flip zone). Price is currently retesting this area.
🎯 Target Zone (Resistance):
1.9085 – 1.9110
This is the next projected bullish target if price successfully rebounds from current support.
🛑 Major Support Zone:
1.8840 – 1.8860
Strong buying interest was seen here previously, acting as a safety net in case of bearish rejection from the current level.
🔄 EMA Confluence
📘 EMA 200 (Blue): 1.8975
📕 EMA 50 (Red): 1.8981
Price is hovering around the EMAs, indicating a moment of decision. A decisive move above these EMAs could trigger bullish momentum. 📈
🔮 Scenario Outlook
🟢 Bullish Scenario (Preferred Setup)
✅ Confirmation above 1.8990
➡️ Retest and continuation could push price toward the 1.9100 target zone.
🔼 Momentum supported by prior breakout and higher lows.
📌 Entry Idea: Above 1.8995
🎯 Target: 1.9100
🛡️ Stop: Below 1.8950
🔴 Bearish Scenario
❌ If price fails to hold the 1.8970–1.8990 zone, a breakdown could follow.
⬇️ Likely move toward 1.8850 support zone.
🚨 Watch for bearish engulfing or rejection candles near resistance.
🧠 Summary
Price is at a key decision point.
✅ Bullish bias is slightly stronger due to market structure (higher highs & higher lows).
⚠️ But a clean break below support would shift focus to the downside.
📈 Strategy: Wait for confirmation ⚖️
Bullish: Break + retest of 1.8990
Bearish: Breakdown below 1.8950 and close under EMAs
Bullish bounce?EUR/USD is falling towards the support level which is an overlap support that aligns with the 61.8% Fibonacci projection and could bouce from this level to our take profit.
Entry: 1.1083
Why we like it:
There is an overlap support level that lines up with the 61.8% Fibonacci projection.
Stop loss: 1.1098
Why we like it:
There is a pullback support level that lines up with the 138.2% Fibonacci extension.
Take profit: 1.1265
Why we like it:
There is an overlap resistance level.
Enjoying your TradingView experience? Review us!
Please be advised that the information presented on TradingView is provided to Vantage (‘Vantage Global Limited’, ‘we’) by a third-party provider (‘Everest Fortune Group’). Please be reminded that you are solely responsible for the trading decisions on your account. There is a very high degree of risk involved in trading. Any information and/or content is intended entirely for research, educational and informational purposes only and does not constitute investment or consultation advice or investment strategy. The information is not tailored to the investment needs of any specific person and therefore does not involve a consideration of any of the investment objectives, financial situation or needs of any viewer that may receive it. Kindly also note that past performance is not a reliable indicator of future results. Actual results may differ materially from those anticipated in forward-looking or past performance statements. We assume no liability as to the accuracy or completeness of any of the information and/or content provided herein and the Company cannot be held responsible for any omission, mistake nor for any loss or damage including without limitation to any loss of profit which may arise from reliance on any information supplied by Everest Fortune Group.

EURCHF (Order Flow + BOS + Demand + OTE)Hello traders!
As you can see our previous OB was mitigated and now we have BOS 1 H - we see good reaction, but at least 1-5min confirmation and we have green light.
Target new HH.
Have a profitable day and don't forget to subscribe for updates!

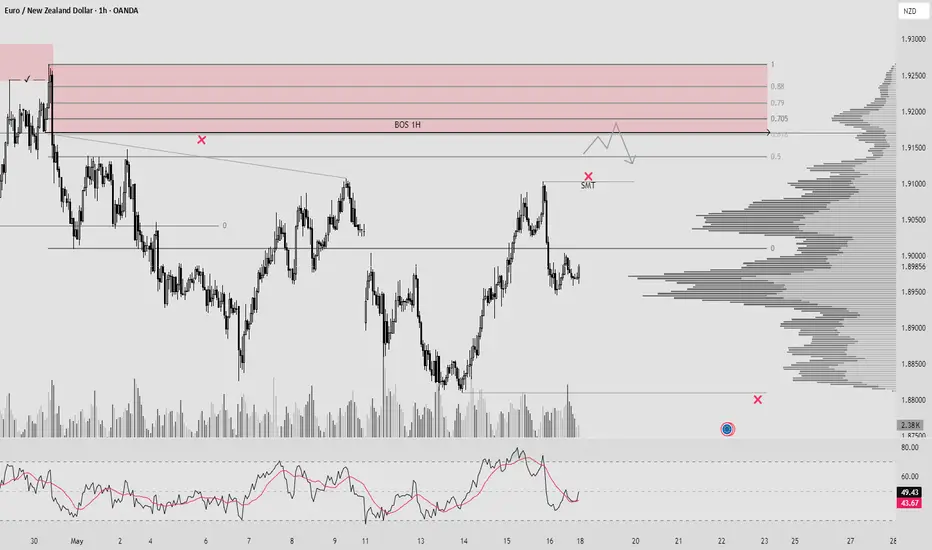
EURNZD (BOS 1H + INDUCEMENT + OTE + SMT + ORDER FLOW) Hello traders!
As you can noticed, we have unmitigated BOS on 1H - which is also our Supply Zone, under zone price built liquidity and make even SMT(Fake BOS). In Supply zone expecting reversal.
Have a profitable day and don't forget to subscribe for updates!
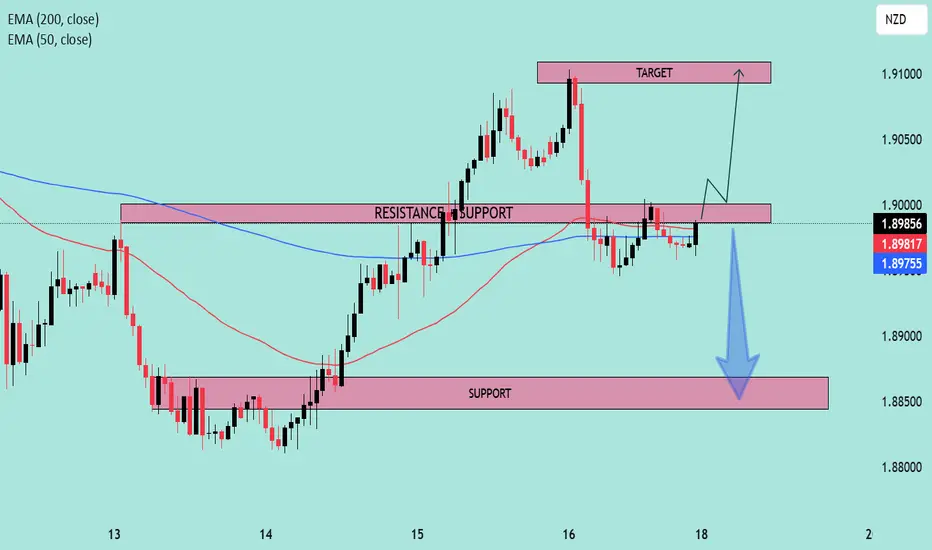
EURNZD Analysis: Bounce & BreakoutHello traders!
EURNZD is in a 1h range and is offering two trading scenarios.
The first scenario suggests the pair may react bearishly from the resistance zone, setting up a bounce opportunity that could drive price lower toward the 1.90000 area.
The second scenario anticipates a breakout above the resistance zone, followed by a retest, which could present a strong opportunity for continuation toward the 1.92000 area.
Discretionary Trading: Where Experience Becomes the Edge
Discretionary trading is all about making decisions based on what you see, what you feel, and what you've learned through experience. Unlike systematic strategies that rely on fixed rules or algorithms, discretionary traders use their judgment to read the market in real time. It's a skill that can't be rushed, because it's built on screen time, pattern recognition, and the ability to stay calm under pressure.
There's no shortcut here. You need to see enough market conditions, wins, and losses to build that intuition—the kind that tells you when to pull the trigger or sit on your hands. Charts might look the same, but context changes everything, and that's something only experience can teach you.
At the end of the day, discretionary trading is an art, refined over time, sharpened through mistakes, and driven by instinct. It's not for everyone, but for those who've put in the work, it can be a powerful way to trade.

EURCHF Is Going Up! Long!
Please, check our technical outlook for EURCHF.
Time Frame: 15m
Current Trend: Bullish
Sentiment: Oversold (based on 7-period RSI)
Forecast: Bullish
The price is testing a key support 0.934.
Current market trend & oversold RSI makes me think that buyers will push the price. I will anticipate a bullish movement at least to 0.936 level.
P.S
Overbought describes a period of time where there has been a significant and consistent upward move in price over a period of time without much pullback.
Disclosure: I am part of Trade Nation's Influencer program and receive a monthly fee for using their TradingView charts in my analysis.
Like and subscribe and comment my ideas if you enjoy them!

EUR_CHF LOCAL LONG|
✅EUR_CHF is trading along the rising support
And as the pair will soon retest it
I am expecting the price to go up
To retest the supply levels above of 0.9360
LONG🚀
✅Like and subscribe to never miss a new idea!✅
Disclosure: I am part of Trade Nation's Influencer program and receive a monthly fee for using their TradingView charts in my analysis.

EURNZD What Next? BUY!
My dear followers,
This is my opinion on the EURNZD next move:
The asset is approaching an important pivot point 1.8840
Bias - Bullish
Technical Indicators: Supper Trend generates a clear long signal while Pivot Point HL is currently determining the overall Bullish trend of the market.
Goal - 1.8961
About Used Indicators:
For more efficient signals, super-trend is used in combination with other indicators like Pivot Points.
Disclosure: I am part of Trade Nation's Influencer program and receive a monthly fee for using their TradingView charts in my analysis.
———————————
WISH YOU ALL LUCK

EURUSD - Shift In Momentum Confirmed!Hello TradingView Family / Fellow Traders. This is Richard, also known as theSignalyst.
📈After breaking below the structure marked in orange, EURUSD's momentum has been shifted from bullish to bearish.
EURUSD is currently rejecting the upper bound of its falling channel marked in red.
Moreover, it is retesting the orange structure.
🏹 Thus, the highlighted red circle is a strong area to look for sell setups as it is the intersection of structure and upper red trendline acting as a non-horizontal resistance.
📚 As per my trading style:
As #EURUSD is around the red circle zone, I will be looking for bearish reversal setups (like a double top pattern, trendline break , and so on...)
📚 Always follow your trading plan regarding entry, risk management, and trade management.
Good luck!
All Strategies Are Good; If Managed Properly!
~Rich
Disclosure: I am part of Trade Nation's Influencer program and receive a monthly fee for using their TradingView charts in my analysis.

EUR/USD – BEARISH BIAS IN PLAY, IS A FAKEOUT COMING?EUR/USD – BEARISH BIAS IN PLAY, IS A FAKEOUT COMING?
🧠 Market Context:
After a technical rebound earlier this week, EUR/USD is now consolidating inside a symmetrical triangle. Despite buyers attempting a breakout, low volume and price action still below the 200 EMA indicate weak bullish momentum.
The DXY is recovering on expectations the Fed will hold rates higher for longer.
Meanwhile, the Euro lacks fundamental support as the ECB remains cautious with policy moves.
👉 Given the current technical setup, the higher probability scenario (70%) is a bearish breakout, continuing the dominant downtrend.
📊 Trade Scenarios for Today:
✅ High Probability – SITUATION 1 (70%):
Price breaks below the triangle’s base near 1.1185–1.1190 and continues lower toward the 1.1110 demand zone.
⛔ SELL ZONE: 1.1210 – 1.1220 (after minor retest of broken trendline)
🎯 TP: 1.1180 → 1.1150 → 1.1120 → 1.1100
🛑 SL: 1.1245 (above EMA200)
🚨 Lower Probability – SITUATION 2 (30%):
Price breaks out and closes firmly above the triangle and 200 EMA (~1.124x) → short-term bullish reversal.
🔵 BUY ZONE: 1.1250 – 1.1260 (only after confirmed breakout with volume)
🎯 TP: 1.1290 → 1.1325 → 1.1350
🛑 SL: 1.1215
🔍 Key Technical Levels & EMA:
Resistance (200 EMA on H1): ~1.1247
Major Support Zones: 1.1180 – 1.1150 – 1.1110
🎯 Execution Strategy:
Favor short setups unless a clear bullish breakout occurs above 1.1247 with strong volume.
Watch for a breakdown and retest below 1.1180 to confirm bearish continuation.
Avoid premature entries — let price come to your levels.
⚠️ News to Watch:
No major data today, but USD is still sensitive to Fed tone and macro headlines.
Keep an eye on Fed speakers later in the NY session for potential impact on dollar direction.
✅ Final Thoughts:
The triangle pattern is coiling tight, but overall momentum favors sellers.
Expect liquidity sweeps and volatility traps, especially around session transitions.
Stick to your plan, respect your levels, and let the market decide the breakout direction.

EUR IS DANGER!!!!We are in the final phase of a major correction that has been ongoing for over 10 years. Prepare for significant instability in this region!!!!!! And take care of yourselves.
The only way this scenario would be invalidated is if the 1.26 mark is crossed — which is highly unlikely.

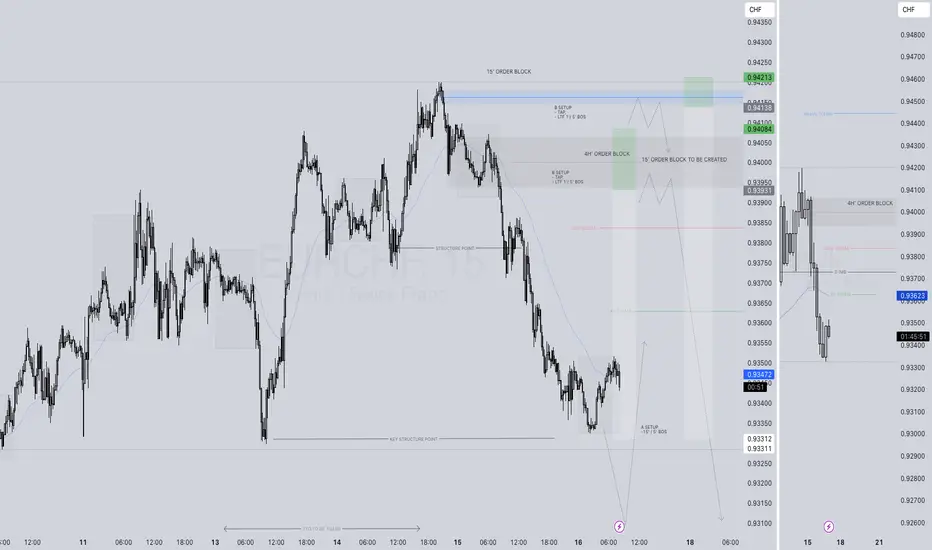
EURCHF SHORT FORECAST Q2 W20 D16 Y25EURCHF SHORT FORECAST Q2 W20 D16 Y25
Professional Risk Managers👋
Welcome back to another FRGNT chart update📈
Diving into some Forex setups using predominantly higher time frame order blocks alongside confirmation breaks of structure.
Let’s see what price action is telling us today!
💡Here are some trade confluences📝
✅4 Hour order block rejection
✅4 Hour 50 EMA rejection
✅Intraday 15' order block
✅Tokyo ranges to be filled
🔑 Remember, to participate in trading comes always with a degree of risk, therefore as professional risk managers it remains vital that we stick to our risk management plan as well as our trading strategies.
📈The rest, we leave to the balance of probabilities.
💡Fail to plan. Plan to fail.
🏆It has always been that simple.
❤️Good luck with your trading journey, I shall see you at the very top.
🎯Trade consistent, FRGNT X
EUR/USD - Triangle Formation (16.05.2025)The EUR/USD pair on the M30 timeframe presents a Potential Buying Opportunity due to a recent Formation of a Triangle Pattern. This suggests a shift in momentum towards the upside and a higher likelihood of further advances in the coming hours.
Possible Long Trade:
Entry: Consider Entering A Long Position around Trendline Of The Pattern.
Target Levels:
1st Resistance – 1.1321
2nd Resistance – 1.1376
🎁 Please hit the like button and
🎁 Leave a comment to support for My Post !
Your likes and comments are incredibly motivating and will encourage me to share more analysis with you.
Best Regards, KABHI_TA_TRADING
Thank you.

Bearish reversal off 61.8% Fibonacci resistance?The Fiber (EUR/USD) has rejected off the pivot and could drop to the 1st support.
Pivot: 1.1265
1st Support: 1.1071
1st Resistance: 1.1367
Risk Warning:
Trading Forex and CFDs carries a high level of risk to your capital and you should only trade with money you can afford to lose. Trading Forex and CFDs may not be suitable for all investors, so please ensure that you fully understand the risks involved and seek independent advice if necessary.
Disclaimer:
The above opinions given constitute general market commentary, and do not constitute the opinion or advice of IC Markets or any form of personal or investment advice.
Any opinions, news, research, analyses, prices, other information, or links to third-party sites contained on this website are provided on an "as-is" basis, are intended only to be informative, is not an advice nor a recommendation, nor research, or a record of our trading prices, or an offer of, or solicitation for a transaction in any financial instrument and thus should not be treated as such. The information provided does not involve any specific investment objectives, financial situation and needs of any specific person who may receive it. Please be aware, that past performance is not a reliable indicator of future performance and/or results. Past Performance or Forward-looking scenarios based upon the reasonable beliefs of the third-party provider are not a guarantee of future performance. Actual results may differ materially from those anticipated in forward-looking or past performance statements. IC Markets makes no representation or warranty and assumes no liability as to the accuracy or completeness of the information provided, nor any loss arising from any investment based on a recommendation, forecast or any information supplied by any third-party.
