EUR/USD Triangle Breakout (15.05.2025)The EUR/USD Pair on the M30 timeframe presents a Potential Selling Opportunity due to a recent Formation of a Triangle Breakout Pattern. This suggests a shift in momentum towards the downside in the coming hours.
Possible Short Trade:
Entry: Consider Entering A Short Position around Trendline Of The Pattern.
Target Levels:
1st Support – 1.1085
2nd Support – 1.1030
🎁 Please hit the like button and
🎁 Leave a comment to support for My Post !
Your likes and comments are incredibly motivating and will encourage me to share more analysis with you.
Best Regards, KABHI_TA_TRADING
Thank you.
EUR (Euro)

EUR/CHF BULLS WILL DOMINATE THE MARKET|LONG
Hello, Friends!
EUR/CHF pair is in the downtrend because previous week’s candle is red, while the price is obviously falling on the 1H timeframe. And after the retest of the support line below I believe we will see a move up towards the target above at 0.942 because the pair oversold due to its proximity to the lower BB band and a bullish correction is likely.
Disclosure: I am part of Trade Nation's Influencer program and receive a monthly fee for using their TradingView charts in my analysis.
✅LIKE AND COMMENT MY IDEAS✅

EUR/NZD SENDS CLEAR BEARISH SIGNALS|SHORT
Hello, Friends!
EUR/NZD pair is trading in a local downtrend which know by looking at the previous 1W candle which is red. On the 5H timeframe the pair is going up. The pair is overbought because the price is close to the upper band of the BB indicator. So we are looking to sell the pair with the upper BB line acting as resistance. The next target is 1.891 area.
Disclosure: I am part of Trade Nation's Influencer program and receive a monthly fee for using their TradingView charts in my analysis.
✅LIKE AND COMMENT MY IDEAS✅

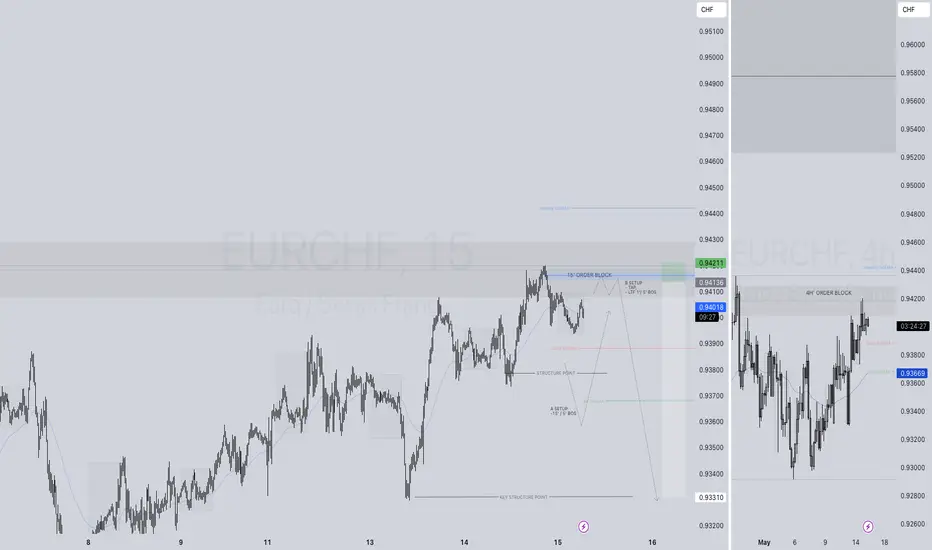
EURCHF SHORT FORECAST Q2 W20 D15 Y25EURCHF SHORT FORECAST Q2 W20 D15 Y25
Professional Risk Managers👋
Welcome back to another FRGNT chart update📈
Diving into some Forex setups using predominantly higher time frame order blocks alongside confirmation breaks of structure.
Let’s see what price action is telling us today!
💡Here are some trade confluences📝
✅4 Hour order block rejection
✅4 Hour 50 EMA rejection
✅Intraday 15' order block
✅Tokyo ranges to be filled
🔑 Remember, to participate in trading comes always with a degree of risk, therefore as professional risk managers it remains vital that we stick to our risk management plan as well as our trading strategies.
📈The rest, we leave to the balance of probabilities.
💡Fail to plan. Plan to fail.
🏆It has always been that simple.
❤️Good luck with your trading journey, I shall see you at the very top.
🎯Trade consistent, FRGNT X
EURAUD to continue in the downward move?EURAUD - 24h expiry
The medium term bias remains bearish.
Bullish divergence is expected to support prices.
Preferred trade is to sell into rallies.
Risk/Reward would be poor to call a sell from current levels.
Bespoke resistance is located at 1.7500.
We look to Sell at 1.7500 (stop at 1.7560)
Our profit targets will be 1.7260 and 1.7230
Resistance: 1.7450 / 1.7500 / 1.7570
Support: 1.7300 / 1.7250 / 1.7220
Risk Disclaimer
The trade ideas beyond this page are for informational purposes only and do not constitute investment advice or a solicitation to trade. This information is provided by Signal Centre, a third-party unaffiliated with OANDA, and is intended for general circulation only. OANDA does not guarantee the accuracy of this information and assumes no responsibilities for the information provided by the third party. The information does not take into account the specific investment objectives, financial situation, or particular needs of any particular person. You should take into account your specific investment objectives, financial situation, and particular needs before making a commitment to trade, including seeking advice from an independent financial adviser regarding the suitability of the investment, under a separate engagement, as you deem fit.
You accept that you assume all risks in independently viewing the contents and selecting a chosen strategy.
Where the research is distributed in Singapore to a person who is not an Accredited Investor, Expert Investor or an Institutional Investor, Oanda Asia Pacific Pte Ltd (“OAP“) accepts legal responsibility for the contents of the report to such persons only to the extent required by law. Singapore customers should contact OAP at 6579 8289 for matters arising from, or in connection with, the information/research distributed.

Could the Fiber bounce from here?The price is falling towards the pivot and could bounce to the 1st resistance.
Pivot: 1.1137
1st Support: 1.1077
1st Resistance: 1.1241
Risk Warning:
Trading Forex and CFDs carries a high level of risk to your capital and you should only trade with money you can afford to lose. Trading Forex and CFDs may not be suitable for all investors, so please ensure that you fully understand the risks involved and seek independent advice if necessary.
Disclaimer:
The above opinions given constitute general market commentary, and do not constitute the opinion or advice of IC Markets or any form of personal or investment advice.
Any opinions, news, research, analyses, prices, other information, or links to third-party sites contained on this website are provided on an "as-is" basis, are intended only to be informative, is not an advice nor a recommendation, nor research, or a record of our trading prices, or an offer of, or solicitation for a transaction in any financial instrument and thus should not be treated as such. The information provided does not involve any specific investment objectives, financial situation and needs of any specific person who may receive it. Please be aware, that past performance is not a reliable indicator of future performance and/or results. Past Performance or Forward-looking scenarios based upon the reasonable beliefs of the third-party provider are not a guarantee of future performance. Actual results may differ materially from those anticipated in forward-looking or past performance statements. IC Markets makes no representation or warranty and assumes no liability as to the accuracy or completeness of the information provided, nor any loss arising from any investment based on a recommendation, forecast or any information supplied by any third-party.

Bearish drop?EUR/USD has rejected off the resistance level which is an overlap resistance and could drop from this level to our take profit.
Entry: 1.1274
Why we like it:
There is an overlap resistance level which is an overlap resistance that lines up with the 61.8% Fibonacci retracement.
Stop loss: 1.1373
Why we like it:
There is a pullback resistance level.
Take profit: 1.1084
Why we like it:
There is an overlap support level.
Enjoying your TradingView experience? Review us!
Please be advised that the information presented on TradingView is provided to Vantage (‘Vantage Global Limited’, ‘we’) by a third-party provider (‘Everest Fortune Group’). Please be reminded that you are solely responsible for the trading decisions on your account. There is a very high degree of risk involved in trading. Any information and/or content is intended entirely for research, educational and informational purposes only and does not constitute investment or consultation advice or investment strategy. The information is not tailored to the investment needs of any specific person and therefore does not involve a consideration of any of the investment objectives, financial situation or needs of any viewer that may receive it. Kindly also note that past performance is not a reliable indicator of future results. Actual results may differ materially from those anticipated in forward-looking or past performance statements. We assume no liability as to the accuracy or completeness of any of the information and/or content provided herein and the Company cannot be held responsible for any omission, mistake nor for any loss or damage including without limitation to any loss of profit which may arise from reliance on any information supplied by Everest Fortune Group.

EUR/USD Daily Short SetupSetup: Retest of the former support zone (now supply) after the recent pullback from the mid-April highs
Entry: Short around 1.1336 (within the shaded resistance box)
Stop-Loss: Above the recent swing high at 1.1390
Take-Profit: Near the lower range support at 1.0735
Risk : Reward: ~1 : 5
Rationale:
Following a strong rally from early March to mid-April, EUR/USD has corrected sharply and is now back into the grey supply area that previously acted as support. This zone is likely to cap upside moves, making a short entry here attractive. The next major support lies around 1.0735, offering a high reward relative to risk. A break above 1.1390 would invalidate the setup.

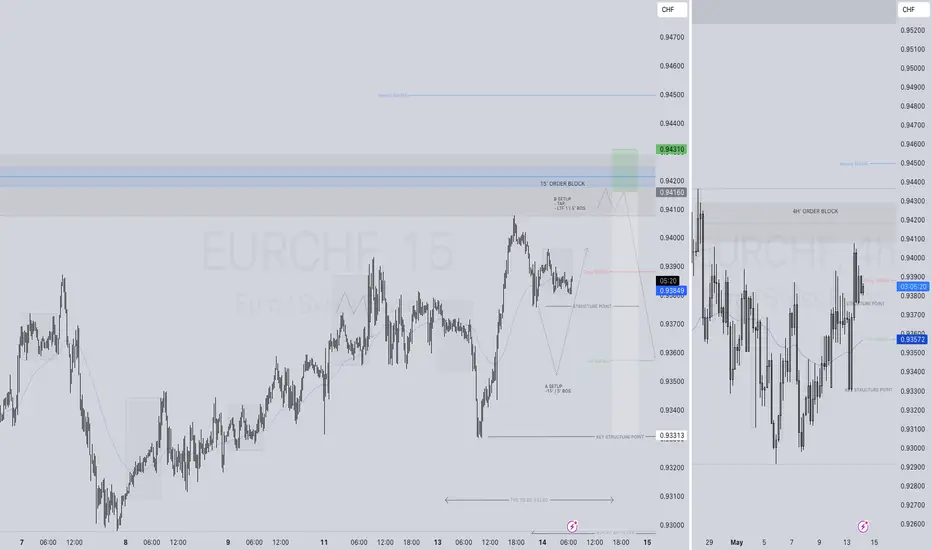
EURCHF SHORT FORECAST Q2 W20 D14 Y25EURCHF SHORT FORECAST Q2 W20 D14 Y25
Professional Risk Managers👋
Welcome back to another FRGNT chart update📈
Diving into some Forex setups using predominantly higher time frame order blocks alongside confirmation breaks of structure.
Let’s see what price action is telling us today!
💡Here are some trade confluences📝
✅4 Hour order block rejection
✅4 Hour 50 EMA rejection
✅Intraday 15' order block
✅Tokyo ranges to be filled
🔑 Remember, to participate in trading comes always with a degree of risk, therefore as professional risk managers it remains vital that we stick to our risk management plan as well as our trading strategies.
📈The rest, we leave to the balance of probabilities.
💡Fail to plan. Plan to fail.
🏆It has always been that simple.
❤️Good luck with your trading journey, I shall see you at the very top.
🎯Trade consistent, FRGNT X
eurnzd analysis elliot. Don't forget about stop-loss.
Write in the comments all your questions and instruments analysis of which you want to see.
Friends, push the like button, write a comment, and share with your mates - that would be the best THANK YOU.
P.S. I personally will open entry if the price will show it according to my strategy.
Always make your analysis before a trade

Could the Fiber reverse from here?The price is rising towards the pivot and could reverse to the 1st support.
Pivot: 1.1208
1st Support: 1.1117
1st Resistance: 1.1244
Risk Warning:
Trading Forex and CFDs carries a high level of risk to your capital and you should only trade with money you can afford to lose. Trading Forex and CFDs may not be suitable for all investors, so please ensure that you fully understand the risks involved and seek independent advice if necessary.
Disclaimer:
The above opinions given constitute general market commentary, and do not constitute the opinion or advice of IC Markets or any form of personal or investment advice.
Any opinions, news, research, analyses, prices, other information, or links to third-party sites contained on this website are provided on an "as-is" basis, are intended only to be informative, is not an advice nor a recommendation, nor research, or a record of our trading prices, or an offer of, or solicitation for a transaction in any financial instrument and thus should not be treated as such. The information provided does not involve any specific investment objectives, financial situation and needs of any specific person who may receive it. Please be aware, that past performance is not a reliable indicator of future performance and/or results. Past Performance or Forward-looking scenarios based upon the reasonable beliefs of the third-party provider are not a guarantee of future performance. Actual results may differ materially from those anticipated in forward-looking or past performance statements. IC Markets makes no representation or warranty and assumes no liability as to the accuracy or completeness of the information provided, nor any loss arising from any investment based on a recommendation, forecast or any information supplied by any third-party.

EUR-NZD Support Ahead! Buy!
Hello,Traders!
EUR-NZD keeps falling
But the pair will soon
Retest a horizontal support
Level of 1.8732 so after
The pair makes the retest
We will be expecting a
Local bullish rebound
Buy!
Comment and subscribe to help us grow!
Check out other forecasts below too!
Disclosure: I am part of Trade Nation's Influencer program and receive a monthly fee for using their TradingView charts in my analysis.

EUR/NZD Forex Heist: Thief Trading Style Strikes! Greetings, Profit Hunters & Market Raiders! 🤑💰✈️
Prepare to plunder the EUR/NZD Forex Market with our slick Thief Trading Style, fusing razor-sharp technicals with savvy fundamental insights! 📊🔥 Our mission? Dive in for a bearish score, targeting the high-risk Green MA Zone where oversold conditions, consolidation, or a bullish reversal could trap the unwary. Let’s grab the loot and slip away like pros! 🏆💸
📈 The Forex Heist Blueprint
Entry Point 🚪:
🏴☠️ Bearish Strike: The vault’s open—pounce on the bearish move at any price! For precision, place Sell Limit Orders at the nearest 15M/30M swing high/low for pullback entries.
Tip: Set a chart alert to snag the perfect entry! 🔔
Stop Loss (SL) 🛑:
Place your Thief SL at the nearest 5H swing high (1.91000) for swing trades.
Adjust SL based on your risk, lot size, and number of orders. This is your escape hatch—use it wisely! ⚠️
Take Profit (TP) 🎯:
Aim for 1.85000 or exit early for safety if the Green MA Zone shows reversal signs.
Escape Plan: Watch for bullish strength or consolidation to avoid getting caught! 🚨
📡 Why EUR/NZD?
The EUR/NZD market is in a bearish trend 🐻, fueled by:
Fundamentals: Eurozone economic struggles vs. NZD resilience.
Macroeconomics: Weak Eurozone data contrasts with NZ’s export strength.
COT Data: Speculative bets lean bearish on EUR.
Intermarket: NZD gains from commodity correlations; EUR lags on energy costs.
Quantitative: Technicals (RSI, MA crossovers) signal bearish momentum.
🧠 Sentiment Outlook
Retail Traders:
🟢 Bullish: 38% 😊 (Eyeing EUR rebound on oversold signals)
🔴 Bearish: 50% 😟 (NZD strength and Eurozone woes dominate)
⚪ Neutral: 12% 🤔
Institutional Traders:
🟢 Bullish: 25% 💼 (Hedging for EUR recovery)
🔴 Bearish: 65% ⚠️ (NZD favored on trade and yield flows)
⚪ Neutral: 10% 🧐
⚠️ Trading Alert: News & Risk Management 📰
News can flip the market like a switch! Protect your haul:
Avoid new trades during high-impact news releases.
Use trailing stop-loss to secure profits and limit losses.
Stay alert—volatility is our ally, but only with a plan!
💪 Join the Thief Trading Squad!
Tap the Boost Button to supercharge our Thief Trading Style and make this heist legendary! 🚀 Every boost strengthens our crew, letting us raid profits daily with ease. Let’s dominate the EUR/NZD market together! 🤝
Stay locked in for the next heist! 🐱👤 Keep your charts primed, alerts set, and trading spirit wild. See you in the profits, raiders! 🤑🎉
#ThiefTrading #EURNZD #ForexHeist #TradingView #GrabThePips

EURCHF Under Pressure! SELL!
My dear subscribers,
My technical analysis for EURCHF is below:
The price is coiling around a solid key level - 0.9385
Bias - Bearish
Technical Indicators: Pivot Points Low anticipates a potential price reversal.
Super trend shows a clear sell, giving a perfect indicators' convergence.
Goal - 0.9347
My Stop Loss - 0.9404
About Used Indicators:
By the very nature of the supertrend indicator, it offers firm support and resistance levels for traders to enter and exit trades. Additionally, it also provides signals for setting stop losses
Disclosure: I am part of Trade Nation's Influencer program and receive a monthly fee for using their TradingView charts in my analysis.
———————————
WISH YOU ALL LUCK

EURNZD Short Term Buy Trade Update!!!Hi Traders, on May 8th I shared this idea "EURNZD - Expecting Bullish Continuation In The Short Term"
I expected retraces and bullish continuation higher from the marked Fibonacci support zones. You can read the full post using the link above.
Price reached the first Fibonacci support zone, respected it and bounced higher as expected!!!
If you enjoy this idea, don’t forget to LIKE 👍, FOLLOW ✅, SHARE 🙌, and COMMENT ✍! Drop your thoughts and charts below to keep the discussion going. Your support helps keep this content free and reach more people! 🚀
-------------------------------------------------------------------------------------------------------------------
Disclosure: I am part of Trade Nation's Influencer program and receive a monthly fee for using their TradingView charts in my analysis.

EURCHF Will Go Down From Resistance! Sell!
Take a look at our analysis for EURCHF.
Time Frame: 2h
Current Trend: Bearish
Sentiment: Overbought (based on 7-period RSI)
Forecast: Bearish
The market is testing a major horizontal structure 0.936.
Taking into consideration the structure & trend analysis, I believe that the market will reach 0.934 level soon.
P.S
Overbought describes a period of time where there has been a significant and consistent upward move in price over a period of time without much pullback.
Disclosure: I am part of Trade Nation's Influencer program and receive a monthly fee for using their TradingView charts in my analysis.
Like and subscribe and comment my ideas if you enjoy them!

EURNZD Bearish Reversal Confirmed: Break and Retest Below Key Su🧠 Market Context & Structure:
Trend Analysis: The pair is currently in a bearish structure. This is evident from lower highs and lower lows forming after a failed bullish breakout attempt.
Key Zone: A supply zone (highlighted in red) around 1.90198 – 1.90750 has acted as a strong resistance. Price was rejected here after retesting.
Break of Structure (BoS): A clear bearish breakout below the ascending trendline and the horizontal support confirms a shift in sentiment.
📉 Indicators & Confluences:
EMA Analysis:
EMA 50 (red): 1.90757
EMA 200 (blue): 1.90728
Price is trading below both EMAs, which confirms bearish momentum. Also, a bearish EMA crossover (50 crossing below 200) may be forming or has just occurred — a death cross, which further supports downside bias.
🎯 Trade Setup Breakdown (Bearish Bias):
Entry: Around 1.89760 (current price)
Stop Loss: Above the supply zone (~1.9020 - 1.9070)
Take Profit Target: Around 1.86035 (highlighted in green), aligning with previous demand zone or measured move.
Risk-to-Reward Ratio (RRR): Estimated at ~3:1, making this a favorable setup.
🔽 Technical Patterns:
Bear Flag / Rising Wedge: The broken ascending pattern suggests a bearish continuation.
Retest Confirmation: Price retested the broken structure before continuing down — classic bearish retest behavior.
✅ Conclusion:
This is a textbook bearish setup supported by:
A failed breakout and structure shift
Resistance at a key supply zone
Break and retest of support
Price under both EMAs (bearish confirmation)
📌 Bias: Bearish
📌 Invalidation Level: Close above 1.9075
📌 Next Support Zone: 1.8600–1.8550 range

EURGBP: Shifting to long term bearish.EURGBP is heavily bearish on its 1D technical outlook (RSI = 36.165, MACD = 0.000, ADX = 36.508), and most likely will close the day under its 1D MA50. At the moment it is crossing below the 2025 Channel Up and if it closes under it, we will have a validated trend shift to bearish long term. It will be similar to the August 2024 decline that made a new Low after a 1D MA50 rejection. We first aim for the S1 level (TP1 = 0.83500) and as long as it remains under the 1D MA50, resell on the bounce to the S1 level (TP2 = 0.82500).
## If you like our free content follow our profile to get more daily ideas. ##
## Comments and likes are greatly appreciated. ##

EURUSD first 1D MA50 test since March 03. Bearish?Last time we had a look at the EURUSD pair (April 28, see chart below), we gave a bearish continuation signal, which not only did it hit its 1.12500 Target but also broke below the 3-month Channel Down:
This has brought us to the almost the first 1D MA50 (blue trend-line) test since the March 03 break-out. As long as this holds, it keeps the trend bullish but the 1D RSI is on a Bearish Divergence, indicating a potential long-term trend change.
Technically it is similar with the December 28 2023 High, which at the time of the 1D MA50 test was also on Higher Lows but its RSI on Lower Lows (Bearish Div). The 1D MA50 eventually broke, leading to a sell continuation that hit the 0.618 Fibonacci retracement level from the bottom.
As a result, if the D MA50 breaks, we will turn bearish, targeting 1.07000 (the 0.618 Fib).
-------------------------------------------------------------------------------
** Please LIKE 👍, FOLLOW ✅, SHARE 🙌 and COMMENT ✍ if you enjoy this idea! Also share your ideas and charts in the comments section below! This is best way to keep it relevant, support us, keep the content here free and allow the idea to reach as many people as possible. **
-------------------------------------------------------------------------------
Disclosure: I am part of Trade Nation's Influencer program and receive a monthly fee for using their TradingView charts in my analysis.
💸💸💸💸💸💸
👇 👇 👇 👇 👇 👇

EURNZD Under Pressure! SELL!
My dear subscribers,
EURNZD looks like it will make a good move, and here are the details:
The market is trading on 1.9051 pivot level.
Bias - Bearish
Technical Indicators: Both Super Trend & Pivot HL indicate a highly probable Bearish continuation.
Target - 1.8984
About Used Indicators:
The average true range (ATR) plays an important role in 'Supertrend' as the indicator uses ATR to calculate its value. The ATR indicator signals the degree of price volatility.
Disclosure: I am part of Trade Nation's Influencer program and receive a monthly fee for using their TradingView charts in my analysis.
———————————
WISH YOU ALL LUCK

EURNZD I Technical Analysis & Forecast Welcome back! Let me know your thoughts in the comments!
** EURNZD Analysis - Listen to video!
We recommend that you keep this pair on your watchlist and enter when the entry criteria of your strategy is met.
Please support this idea with a LIKE and COMMENT if you find it useful and Click "Follow" on our profile if you'd like these trade ideas delivered straight to your email in the future.
Thanks for your continued support!Welcome back! Let me know your thoughts in the comments!

EURJPY once again breaks key resistance.The bulls are having another attempt on moving FX_IDC:EURJPY higher. Do they have enough steam? Let's find out...
MARKETSCOM:EURJPY
Let us know what you think in the comments below.
Thank you.
77.3% of retail investor accounts lose money when trading CFDs with this provider. You should consider whether you understand how CFDs work and whether you can afford to take the high risk of losing your money. Past performance is not necessarily indicative of future results. The value of investments may fall as well as rise and the investor may not get back the amount initially invested. This content is not intended for nor applicable to residents of the UK. Cryptocurrency CFDs and spread bets are restricted in the UK for all retail clients.

EURCHF: Market of Sellers
The analysis of the EURCHF chart clearly shows us that the pair is finally about to tank due to the rising pressure from the sellers.
Disclosure: I am part of Trade Nation's Influencer program and receive a monthly fee for using their TradingView charts in my analysis.
❤️ Please, support our work with like & comment! ❤️
