EURUSD Potential UpsidesHey Traders, in today's trading session we are monitoring EURUSD for a buying opportunity around 1.13400 zone, EURUSD is trading in an uptrend and currently is in a correction phase in which it is approaching the trend at 1.13400 support and resistance area.
Trade safe, Joe.
EUR (Euro)

EURCHF: Short Signal with Entry/SL/TP
EURCHF
- Classic bearish setup
- Our team expects bearish continuation
SUGGESTED TRADE:
Swing Trade
Short EURCHF
Entry Point - 0.9431
Stop Loss - 0.9478
Take Profit - 0.9332
Our Risk - 1%
Start protection of your profits from lower levels
Disclosure: I am part of Trade Nation's Influencer program and receive a monthly fee for using their TradingView charts in my analysis.
❤️ Please, support our work with like & comment! ❤️

EUR/USD Slides to 1.1350 Amid USD Strength & ECB Dovish Signals📌 Daily Market Summary: EUR/USD Slides to 1.1350 Amid USD Strength & ECB Dovish Signals
EUR/USD declined toward 1.1350 on Friday as the US Dollar gained strength, driven by easing tensions in the US–China trade standoff. Reports suggest Beijing may suspend additional tariffs on some US goods.
Despite the dip, the euro remains firm against most major currencies except North American ones.
ECB members Holzmann and Rehn highlighted ongoing structural weaknesses in the Eurozone and increased risks of inflation undershooting the 2% target.
Olli Rehn suggested that the current conditions justify a rate cut as early as June.
📊 Technical Outlook
EUR/USD dropped to 1.1350, but the broader trend remains bullish, with the 20-week EMA still pointing higher around 1.0885.
💼 Trading Plan
🟢 BUY ZONE
Entry: 1.12725
Stop Loss: 1.12000
Take Profit: 1.13165
🔴 SELL ZONE
Entry: 1.14775
Stop Loss: 1.15300
Take Profit: 1.14350
📉 Caution: With political news and central bank guidance shaping sentiment, traders should closely monitor reactions at key levels and stick to their risk management rules.

EURCHF: Important Breakout 🇪🇺🇨🇭
One more CHF pair that looks strongly bullish to me is EURCHF.
The market successfully broke and closed above a key daily horizontal resistance.
The next strong resistance is 0.948.
It will most likely be the next goal for the buyers.
❤️Please, support my work with like, thank you!❤️
I am part of Trade Nation's Influencer program and receive a monthly fee for using their TradingView charts in my analysis.

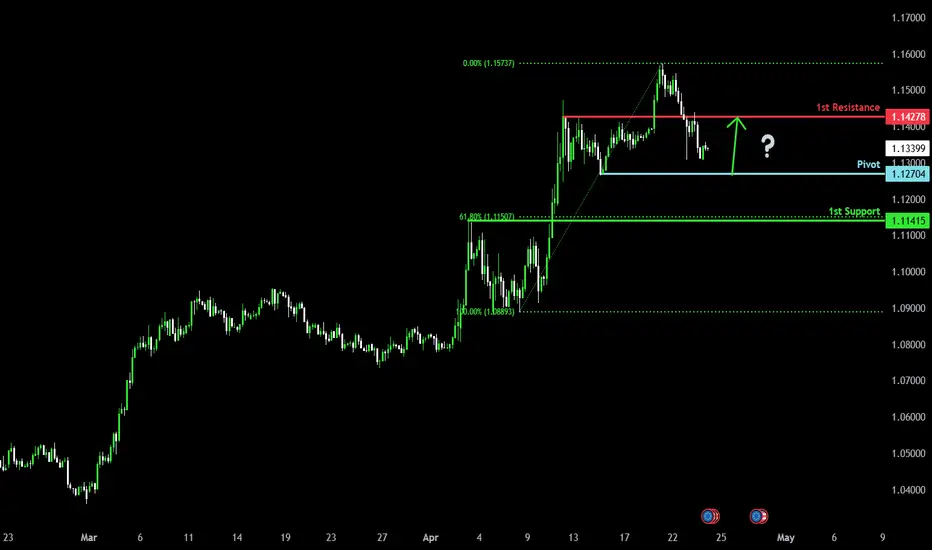
Could the price reverse from here?The Fiber (EUR/USD) is rising towards the pivot and could reverse to the 1st support.
Pivot: 1.1421
1st Support: 1.1141
1st Resistance: 1/1459
Risk Warning:
Trading Forex and CFDs carries a high level of risk to your capital and you should only trade with money you can afford to lose. Trading Forex and CFDs may not be suitable for all investors, so please ensure that you fully understand the risks involved and seek independent advice if necessary.
Disclaimer:
The above opinions given constitute general market commentary, and do not constitute the opinion or advice of IC Markets or any form of personal or investment advice.
Any opinions, news, research, analyses, prices, other information, or links to third-party sites contained on this website are provided on an "as-is" basis, are intended only to be informative, is not an advice nor a recommendation, nor research, or a record of our trading prices, or an offer of, or solicitation for a transaction in any financial instrument and thus should not be treated as such. The information provided does not involve any specific investment objectives, financial situation and needs of any specific person who may receive it. Please be aware, that past performance is not a reliable indicator of future performance and/or results. Past Performance or Forward-looking scenarios based upon the reasonable beliefs of the third-party provider are not a guarantee of future performance. Actual results may differ materially from those anticipated in forward-looking or past performance statements. IC Markets makes no representation or warranty and assumes no liability as to the accuracy or completeness of the information provided, nor any loss arising from any investment based on a recommendation, forecast or any information supplied by any third-party.

Could the Fiber reverse from here?The price is rising towards the resistance level which is a pullback resistance that lines up with the 50% Fibonacci retracement and could reverse from this level to our take profit.
Entry: 1.1427
Why we like it:
There is a pullback resistance level that lines up with the 50% Fibonacci retracement.
Stop loss: 1.1560
Why we like it:
There is a pullback resistance level.
Take profit: 1.1281
Why we like it:
There is a pullback support level.
Enjoying your TradingView experience? Review us!
Please be advised that the information presented on TradingView is provided to Vantage (‘Vantage Global Limited’, ‘we’) by a third-party provider (‘Everest Fortune Group’). Please be reminded that you are solely responsible for the trading decisions on your account. There is a very high degree of risk involved in trading. Any information and/or content is intended entirely for research, educational and informational purposes only and does not constitute investment or consultation advice or investment strategy. The information is not tailored to the investment needs of any specific person and therefore does not involve a consideration of any of the investment objectives, financial situation or needs of any viewer that may receive it. Kindly also note that past performance is not a reliable indicator of future results. Actual results may differ materially from those anticipated in forward-looking or past performance statements. We assume no liability as to the accuracy or completeness of any of the information and/or content provided herein and the Company cannot be held responsible for any omission, mistake nor for any loss or damage including without limitation to any loss of profit which may arise from reliance on any information supplied by Everest Fortune Group.

EURCHF A Fall Expected! SELL!
My dear followers,
I analysed this chart on EURCHF and concluded the following:
The market is trading on 0.9396 pivot level.
Bias - Bearish
Technical Indicators: Both Super Trend & Pivot HL indicate a highly probable Bearish continuation.
Target - 0.9312
Safe Stop Loss - 0.9444
About Used Indicators:
A super-trend indicator is plotted on either above or below the closing price to signal a buy or sell. The indicator changes color, based on whether or not you should be buying. If the super-trend indicator moves below the closing price, the indicator turns green, and it signals an entry point or points to buy.
Disclosure: I am part of Trade Nation's Influencer program and receive a monthly fee for using their TradingView charts in my analysis.
———————————
WISH YOU ALL LUCK

ALERT: EUR Broke Out of Long-term Downtrend Vs Currency Basket This is the aggregate EUR index against several currencies called EXY (like DXY)
Large downtrend from 2008 was breached this quarter to the upside.
The first trigger of trend weakness occurred in the summer of 2017
when EUR index crossed over mid-line and for the rest of time
the price has remained there.
In 2021, the price has shown a false break to the upside but failed to progress further.
That top is the nearest target for the price at 123, which will book +9% profit.
The next barrier is located at the top of 2014 of 140 with +24% gain.

Bullish bounce for the Fiber?The price is falling towards the pivot and could bounce to the 1st resistance.
Pivot: 1.1270
1st Support: 1.1141
1st Resistance: 1.1427
Risk Warning:
Trading Forex and CFDs carries a high level of risk to your capital and you should only trade with money you can afford to lose. Trading Forex and CFDs may not be suitable for all investors, so please ensure that you fully understand the risks involved and seek independent advice if necessary.
Disclaimer:
The above opinions given constitute general market commentary, and do not constitute the opinion or advice of IC Markets or any form of personal or investment advice.
Any opinions, news, research, analyses, prices, other information, or links to third-party sites contained on this website are provided on an "as-is" basis, are intended only to be informative, is not an advice nor a recommendation, nor research, or a record of our trading prices, or an offer of, or solicitation for a transaction in any financial instrument and thus should not be treated as such. The information provided does not involve any specific investment objectives, financial situation and needs of any specific person who may receive it. Please be aware, that past performance is not a reliable indicator of future performance and/or results. Past Performance or Forward-looking scenarios based upon the reasonable beliefs of the third-party provider are not a guarantee of future performance. Actual results may differ materially from those anticipated in forward-looking or past performance statements. IC Markets makes no representation or warranty and assumes no liability as to the accuracy or completeness of the information provided, nor any loss arising from any investment based on a recommendation, forecast or any information supplied by any third-party.
EURUSD - Understanding PriceIn this video I go through what has been happening with EURUSD in the past week, where price has reached, where it is likely going, what has happened yesterday and where we are possibly going to go to today. Pretty straight forward stuff using good ol' ICT concepts.
I hope you find this video insightful, because it's the truth of the markets.
Good luck and happy trading!
- R2F Trading

EURAUD to find sellers at previous resistance?EURAUD - 24h expiry
The RSI is trending lower.
Price action looks to be forming a top.
Preferred trade is to sell into rallies.
Risk/Reward would be poor to call a sell from current levels.
Bespoke resistance is located at 1.7915.
We look to Sell at 1.7915 (stop at 1.8000)
Our profit targets will be 1.7660 and 1.7620
Resistance: 1.7890 / 1.7980 / 1.8020
Support: 1.7670 / 1.7500 / 1.7430
Risk Disclaimer
The trade ideas beyond this page are for informational purposes only and do not constitute investment advice or a solicitation to trade. This information is provided by Signal Centre, a third-party unaffiliated with OANDA, and is intended for general circulation only. OANDA does not guarantee the accuracy of this information and assumes no responsibilities for the information provided by the third party. The information does not take into account the specific investment objectives, financial situation, or particular needs of any particular person. You should take into account your specific investment objectives, financial situation, and particular needs before making a commitment to trade, including seeking advice from an independent financial adviser regarding the suitability of the investment, under a separate engagement, as you deem fit.
You accept that you assume all risks in independently viewing the contents and selecting a chosen strategy.
Where the research is distributed in Singapore to a person who is not an Accredited Investor, Expert Investor or an Institutional Investor, Oanda Asia Pacific Pte Ltd (“OAP“) accepts legal responsibility for the contents of the report to such persons only to the extent required by law. Singapore customers should contact OAP at 6579 8289 for matters arising from, or in connection with, the information/research distributed.

Bullish bounce?EUR/GBP is falling towards the pivot and could bounce to the 1st resistance.
Pivot: 0.8526
1st Support: 0.8447
1st Resistance: 0.8615
Risk Warning:
Trading Forex and CFDs carries a high level of risk to your capital and you should only trade with money you can afford to lose. Trading Forex and CFDs may not be suitable for all investors, so please ensure that you fully understand the risks involved and seek independent advice if necessary.
Disclaimer:
The above opinions given constitute general market commentary, and do not constitute the opinion or advice of IC Markets or any form of personal or investment advice.
Any opinions, news, research, analyses, prices, other information, or links to third-party sites contained on this website are provided on an "as-is" basis, are intended only to be informative, is not an advice nor a recommendation, nor research, or a record of our trading prices, or an offer of, or solicitation for a transaction in any financial instrument and thus should not be treated as such. The information provided does not involve any specific investment objectives, financial situation and needs of any specific person who may receive it. Please be aware, that past performance is not a reliable indicator of future performance and/or results. Past Performance or Forward-looking scenarios based upon the reasonable beliefs of the third-party provider are not a guarantee of future performance. Actual results may differ materially from those anticipated in forward-looking or past performance statements. IC Markets makes no representation or warranty and assumes no liability as to the accuracy or completeness of the information provided, nor any loss arising from any investment based on a recommendation, forecast or any information supplied by any third-party.

Daily Price Action: EURCHF Wednesday 4/23/2025In this video, we will be looking into the potential price action of EURCHF.

Bullish bounce?EUR/USD is falling towards the support level which is a pullback support that is slightly below the 38.2% Fibonacci retracement and could bounce from this level to our take profit.
Entry: 1.1278
Why we like it:
There is a pullback support level that is slightly below the 38.2% Fibonacci retracement.
Stop loss: 1.1149
Why we like it:
There is a pullback support level that aligns with the 61.8% Fibonacci retracement.
Take profit: 1.1428
Why we like it:
There is a pullback resistance level.
Enjoying your TradingView experience? Review us!
Please be advised that the information presented on TradingView is provided to Vantage (‘Vantage Global Limited’, ‘we’) by a third-party provider (‘Everest Fortune Group’). Please be reminded that you are solely responsible for the trading decisions on your account. There is a very high degree of risk involved in trading. Any information and/or content is intended entirely for research, educational and informational purposes only and does not constitute investment or consultation advice or investment strategy. The information is not tailored to the investment needs of any specific person and therefore does not involve a consideration of any of the investment objectives, financial situation or needs of any viewer that may receive it. Kindly also note that past performance is not a reliable indicator of future results. Actual results may differ materially from those anticipated in forward-looking or past performance statements. We assume no liability as to the accuracy or completeness of any of the information and/or content provided herein and the Company cannot be held responsible for any omission, mistake nor for any loss or damage including without limitation to any loss of profit which may arise from reliance on any information supplied by Everest Fortune Group.

Bullish bounce?EUR/USD has bounced off the support level, an overlap support, and could rise from this level to the upside.

EURCHF: Short Trade with Entry/SL/TP
EURCHF
- Classic bearish formation
- Our team expects pullback
SUGGESTED TRADE:
Swing Trade
Short EURCHF
Entry - 0.9389
Sl - 0.9438
Tp - 0.9296
Our Risk - 1%
Start protection of your profits from lower levels
Disclosure: I am part of Trade Nation's Influencer program and receive a monthly fee for using their TradingView charts in my analysis.
❤️ Please, support our work with like & comment! ❤️
EURNZD What Next? BUY!
My dear subscribers,
This is my opinion on the EURNZD next move:
The instrument tests an important psychological level 1.9047
Bias - Bullish
Technical Indicators: Supper Trend gives a precise Bullish signal, while Pivot Point HL predicts price changes and potential reversals in the market.
Target - 1.9308
My Stop Loss - 1.8907
About Used Indicators:
On the subsequent day, trading above the pivot point is thought to indicate ongoing bullish sentiment, while trading below the pivot point indicates bearish sentiment.
Disclosure: I am part of Trade Nation's Influencer program and receive a monthly fee for using their TradingView charts in my analysis.
———————————
WISH YOU ALL LUCK

EURNZD market outlookFX:EURNZD
EURNZD is placing out some possible setups for the following week, price tapped in the 4-hour demand zone below and played out nicely towards the upside without signs of weak buying momentum. But because the H4 demand zone below was respected, there are two possible scenarios we should expect. We should not get into sells on the H1 supply zone directly but instead should wait for lower timeframe confirmation. If price broke above H1 supply zone and closed with strong bullish candle, we could look for buy opportunities on small timeframe pullbacks up to H4 resistance zone. However, as we are still on a high timeframe bearish structure, we should prioritise looking for sell opportunities.
www.tradingview.com

Bearish drop off pullback resistance?EUR/AUD has rejected off the pivot and could drop to the 1st support that lines up with the 138.2% Fibonacci extension.
Pivot: 1.79761
1st Support: 1.74140
1st Resistance: 1.80920
Risk Warning:
Trading Forex and CFDs carries a high level of risk to your capital and you should only trade with money you can afford to lose. Trading Forex and CFDs may not be suitable for all investors, so please ensure that you fully understand the risks involved and seek independent advice if necessary.
Disclaimer:
The above opinions given constitute general market commentary, and do not constitute the opinion or advice of IC Markets or any form of personal or investment advice.
Any opinions, news, research, analyses, prices, other information, or links to third-party sites contained on this website are provided on an "as-is" basis, are intended only to be informative, is not an advice nor a recommendation, nor research, or a record of our trading prices, or an offer of, or solicitation for a transaction in any financial instrument and thus should not be treated as such. The information provided does not involve any specific investment objectives, financial situation and needs of any specific person who may receive it. Please be aware, that past performance is not a reliable indicator of future performance and/or results. Past Performance or Forward-looking scenarios based upon the reasonable beliefs of the third-party provider are not a guarantee of future performance. Actual results may differ materially from those anticipated in forward-looking or past performance statements. IC Markets makes no representation or warranty and assumes no liability as to the accuracy or completeness of the information provided, nor any loss arising from any investment based on a recommendation, forecast or any information supplied by any third-party.

Bearish drop?EUR/NZD has rejected off the pivot and could drop tothe 1st support.
Pivot: 1.92325
1st Support: 1.88101
1st Resistance: 1.93451
Risk Warning:
Trading Forex and CFDs carries a high level of risk to your capital and you should only trade with money you can afford to lose. Trading Forex and CFDs may not be suitable for all investors, so please ensure that you fully understand the risks involved and seek independent advice if necessary.
Disclaimer:
The above opinions given constitute general market commentary, and do not constitute the opinion or advice of IC Markets or any form of personal or investment advice.
Any opinions, news, research, analyses, prices, other information, or links to third-party sites contained on this website are provided on an "as-is" basis, are intended only to be informative, is not an advice nor a recommendation, nor research, or a record of our trading prices, or an offer of, or solicitation for a transaction in any financial instrument and thus should not be treated as such. The information provided does not involve any specific investment objectives, financial situation and needs of any specific person who may receive it. Please be aware, that past performance is not a reliable indicator of future performance and/or results. Past Performance or Forward-looking scenarios based upon the reasonable beliefs of the third-party provider are not a guarantee of future performance. Actual results may differ materially from those anticipated in forward-looking or past performance statements. IC Markets makes no representation or warranty and assumes no liability as to the accuracy or completeness of the information provided, nor any loss arising from any investment based on a recommendation, forecast or any information supplied by any third-party.

EURUSD Potential UpsidesHey Traders, in today's trading session we are monitoring EURUSD for a buying opportunity around 1.14400 zone, EURUSD is trading in an uptrend and currently is in a correction phase in which it is approaching the trend at 1.14400 support and resistance area.
Trade safe, Joe.

Bearish drop?EUR/USD is rising towards the resistance level which is a pullback resistance that lines up with the 38.2% Fibonacci retracement and could drop from this level to our take profit.
Entry: 1.1490
Why we like it:
There is a pullback resistance level that lines up with the 38.2% Fibonacci retracement.
Stop loss: 1.1559
Why we like it:
There is a pullback resistance level.
Take profit: 1.1399
Why we like it:
There is a pullback support level that is slightly above the 78.6% Fibonacci retracement.
Enjoying your TradingView experience? Review us!
Please be advised that the information presented on TradingView is provided to Vantage (‘Vantage Global Limited’, ‘we’) by a third-party provider (‘Everest Fortune Group’). Please be reminded that you are solely responsible for the trading decisions on your account. There is a very high degree of risk involved in trading. Any information and/or content is intended entirely for research, educational and informational purposes only and does not constitute investment or consultation advice or investment strategy. The information is not tailored to the investment needs of any specific person and therefore does not involve a consideration of any of the investment objectives, financial situation or needs of any viewer that may receive it. Kindly also note that past performance is not a reliable indicator of future results. Actual results may differ materially from those anticipated in forward-looking or past performance statements. We assume no liability as to the accuracy or completeness of any of the information and/or content provided herein and the Company cannot be held responsible for any omission, mistake nor for any loss or damage including without limitation to any loss of profit which may arise from reliance on any information supplied by Everest Fortune Group.

EUR/CHF BEARS ARE STRONG HERE|SHORT
EUR/CHF SIGNAL
Trade Direction: short
Entry Level: 0.932
Target Level: 0.920
Stop Loss: 0.940
RISK PROFILE
Risk level: medium
Suggested risk: 1%
Timeframe: 9h
Disclosure: I am part of Trade Nation's Influencer program and receive a monthly fee for using their TradingView charts in my analysis.
✅LIKE AND COMMENT MY IDEAS✅
