Bullish reevrsal?EUR/NZD has bounced off the pivot and could rise to the 61.8% Fibonacci resistance.
Pivot: 1.93667
1st Support: 1.93001
1st Resistance: 1.94871
Risk Warning:
Trading Forex and CFDs carries a high level of risk to your capital and you should only trade with money you can afford to lose. Trading Forex and CFDs may not be suitable for all investors, so please ensure that you fully understand the risks involved and seek independent advice if necessary.
Disclaimer:
The above opinions given constitute general market commentary, and do not constitute the opinion or advice of IC Markets or any form of personal or investment advice.
Any opinions, news, research, analyses, prices, other information, or links to third-party sites contained on this website are provided on an "as-is" basis, are intended only to be informative, is not an advice nor a recommendation, nor research, or a record of our trading prices, or an offer of, or solicitation for a transaction in any financial instrument and thus should not be treated as such. The information provided does not involve any specific investment objectives, financial situation and needs of any specific person who may receive it. Please be aware, that past performance is not a reliable indicator of future performance and/or results. Past Performance or Forward-looking scenarios based upon the reasonable beliefs of the third-party provider are not a guarantee of future performance. Actual results may differ materially from those anticipated in forward-looking or past performance statements. IC Markets makes no representation or warranty and assumes no liability as to the accuracy or completeness of the information provided, nor any loss arising from any investment based on a recommendation, forecast or any information supplied by any third-party.
EUR (Euro)

Bullish bounce off overlap support?EUR/GBP is falling towards the pivot, which has been identified as an overlap support and could bounce to the 1st resistance, which acts as a pullback resistance.
Pivot: 0.8569
1st Support: 0.8538
1st Resistance: 0.8640
Risk Warning:
Trading Forex and CFDs carries a high level of risk to your capital and you should only trade with money you can afford to lose. Trading Forex and CFDs may not be suitable for all investors, so please ensure that you fully understand the risks involved and seek independent advice if necessary.
Disclaimer:
The above opinions given constitute general market commentary, and do not constitute the opinion or advice of IC Markets or any form of personal or investment advice.
Any opinions, news, research, analyses, prices, other information, or links to third-party sites contained on this website are provided on an "as-is" basis, are intended only to be informative, is not an advice nor a recommendation, nor research, or a record of our trading prices, or an offer of, or solicitation for a transaction in any financial instrument and thus should not be treated as such. The information provided does not involve any specific investment objectives, financial situation and needs of any specific person who may receive it. Please be aware, that past performance is not a reliable indicator of future performance and/or results. Past Performance or Forward-looking scenarios based upon the reasonable beliefs of the third-party provider are not a guarantee of future performance. Actual results may differ materially from those anticipated in forward-looking or past performance statements. IC Markets makes no representation or warranty and assumes no liability as to the accuracy or completeness of the information provided, nor any loss arising from any investment based on a recommendation, forecast or any information supplied by any third-party.

EURNZD is in the downtrend after breaking TrendlineHello Traders
In This Chart EURNZD 4 HOURLY Forex Forecast By FOREX PLANET
today EURNZD analysis 👆
🟢This Chart includes EURNZD market update)
🟢What is The Next Opportunity on EURNZD Market
🟢how to Enter to the Valid Entry With Assurance Profit
This CHART is For Trader's that Want to Improve Their Technical Analysis Skills and Their Trading By Understanding How To Analyze The Market Using Multiple Timeframes and Understanding The Bigger Picture on the Charts

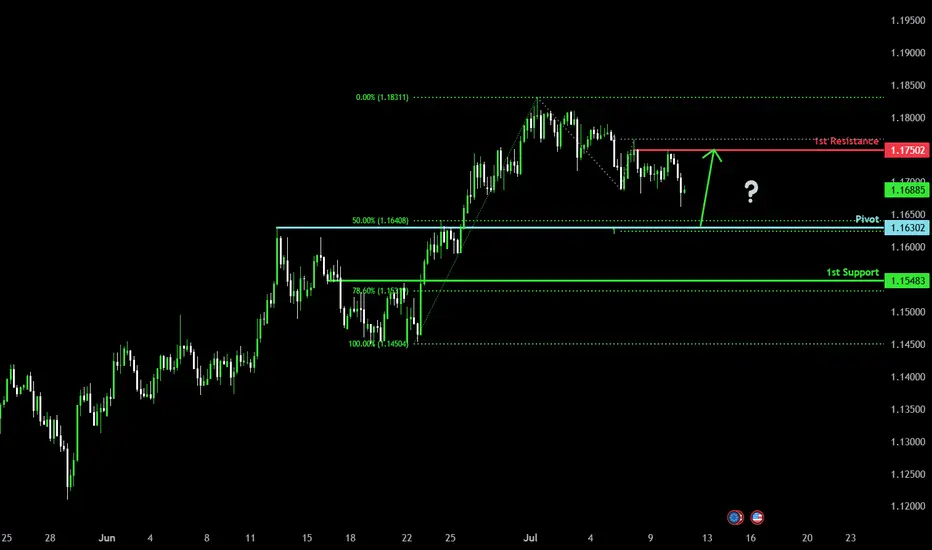
Bullish bounce off major support?EUR/ISD is falling towards the pivot which is a pullback support that lines up with the 50% Fibonacci retracement and could bounce to the 1st resistance,
Pivot: 1.1688
1st Support: 1.1548
1st Resistance: 1.1750
Risk Warning:
Trading Forex and CFDs carries a high level of risk to your capital and you should only trade with money you can afford to lose. Trading Forex and CFDs may not be suitable for all investors, so please ensure that you fully understand the risks involved and seek independent advice if necessary.
Disclaimer:
The above opinions given constitute general market commentary, and do not constitute the opinion or advice of IC Markets or any form of personal or investment advice.
Any opinions, news, research, analyses, prices, other information, or links to third-party sites contained on this website are provided on an "as-is" basis, are intended only to be informative, is not an advice nor a recommendation, nor research, or a record of our trading prices, or an offer of, or solicitation for a transaction in any financial instrument and thus should not be treated as such. The information provided does not involve any specific investment objectives, financial situation and needs of any specific person who may receive it. Please be aware, that past performance is not a reliable indicator of future performance and/or results. Past Performance or Forward-looking scenarios based upon the reasonable beliefs of the third-party provider are not a guarantee of future performance. Actual results may differ materially from those anticipated in forward-looking or past performance statements. IC Markets makes no representation or warranty and assumes no liability as to the accuracy or completeness of the information provided, nor any loss arising from any investment based on a recommendation, forecast or any information supplied by any third-party.
Bullish reversal?The Fiber (EUR/USD) is reacting off the support level which is a pullback support and could rise from this level to our take profit.
Entry: 1.1684
Why we like it:
There is a pullback support.
Stop loss: 1.1652
Why we like it:
There is a pullback support that aligns with the 161.8% Fibonacci extension.
Take profit: 1.1738
Why we like it:
There is an overlap resistance.
Enjoying your TradingView experience? Review us!
Please be advised that the information presented on TradingView is provided to Vantage (‘Vantage Global Limited’, ‘we’) by a third-party provider (‘Everest Fortune Group’). Please be reminded that you are solely responsible for the trading decisions on your account. There is a very high degree of risk involved in trading. Any information and/or content is intended entirely for research, educational and informational purposes only and does not constitute investment or consultation advice or investment strategy. The information is not tailored to the investment needs of any specific person and therefore does not involve a consideration of any of the investment objectives, financial situation or needs of any viewer that may receive it. Kindly also note that past performance is not a reliable indicator of future results. Actual results may differ materially from those anticipated in forward-looking or past performance statements. We assume no liability as to the accuracy or completeness of any of the information and/or content provided herein and the Company cannot be held responsible for any omission, mistake nor for any loss or damage including without limitation to any loss of profit which may arise from reliance on any information supplied by Everest Fortune Group.

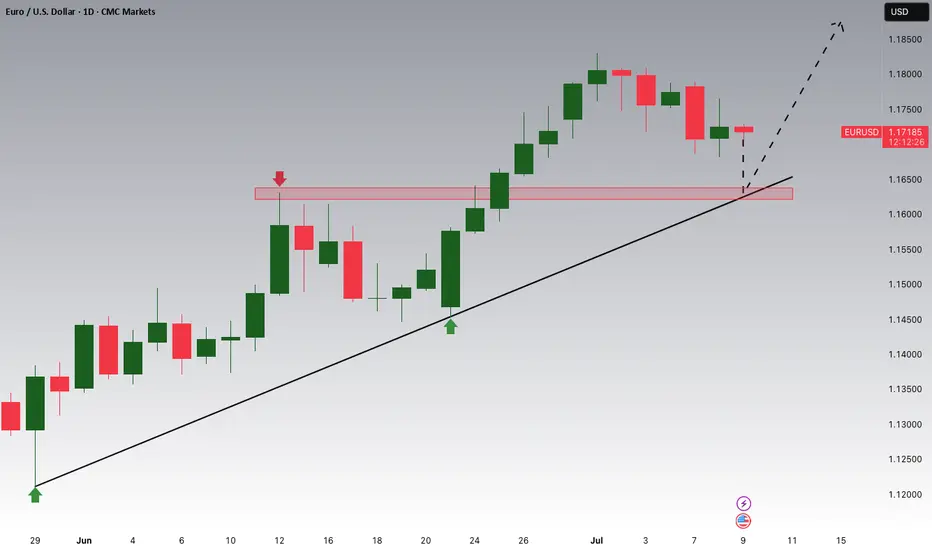
EURUSD is Approaching an Important Support!!Hey Traders, in today's trading session we are monitoring EURUSD for a buying opportunity around 1.16400 zone, EURUSD is trading in an uptrend and currently is in a correction phase in which it is approaching the trend at 1.16400 support and resistance area.
Trade safe, Joe.
EURNZD – Bearish Reversal Expected from Channel Top ResistanceEURNZD has reached the upper boundary of a well-defined ascending channel on the 2H chart and printed a rejection wick, suggesting exhaustion and potential for a pullback. The pair is likely to retrace toward the channel midline or base, with downside targets near 1.9423 and 1.9264, assuming confirmation follows.
🧠 Fundamentals:
EUR Drivers:
ECB remains cautious with weak Eurozone inflation and rising recession risks.
Recent German and Eurozone data (retail sales, factory orders) disappointed.
Political instability in France and ECB’s dovish tone are capping upside momentum in the euro.
NZD Drivers:
RBNZ remains one of the more hawkish central banks, reiterating restrictive stance despite slowing inflation.
Dairy auctions improved recently, adding strength to NZD fundamentals.
China exposure is a double-edged sword — optimism helps, but slowdown risk remains.
🔍 Technical Structure:
Clear ascending channel from mid-June remains intact.
Price rejected perfectly at the upper trendline near 1.9585.
Strong bearish divergence may form if rejection persists.
Bearish scenario targets the 1.9423 zone first (support + midline), then 1.9264 (bottom of channel).
Invalid if price breaks and closes above 1.9600 on strong volume.
⚠️ Risk Factors:
A sudden euro bid from safe-haven demand or ECB surprise could break the channel.
NZD weakness could emerge if China disappoints or RBNZ shifts tone unexpectedly.
🔁 Leader/Lagger Dynamics:
EURNZD often lags risk-sensitive NZD pairs (like NZDJPY, NZDCAD), especially during Asia session moves. However, during European hours, EUR’s tone can dominate due to ECB speeches or EU data.
✅ Trade Bias: Bearish
TP1: 1.9423
TP2: 1.9264
SL: Above 1.9600
Event to Watch:
ECB speakers this week
China CPI/PPI (affects NZD)
US CPI (indirect cross-pressure on both currencies)
📌 Look for bearish confirmation on the 2H/4H candle close below 1.9540. Risk-reward favors a tactical short if the channel structure holds.

EURUSD Below 1.1745 – Bearish Bias in PlayFX:EURUSD Technical Outlook
EURUSD maintains bearish momentum as long as the price remains below 1.1745, with a near-term target at 1.1684.
A confirmed breakout above 1.1745 would shift the trend to bullish, opening the path toward 1.1808 and 1.1883.
On the downside, a 1H or 4H candle close below 1.1684 would reinforce the bearish trend, likely extending losses toward 1.1627, and possibly 1.1557.
Support: 1.1684 / 1.1627 / 1.1557
Resistance: 1.1808 / 1.1883

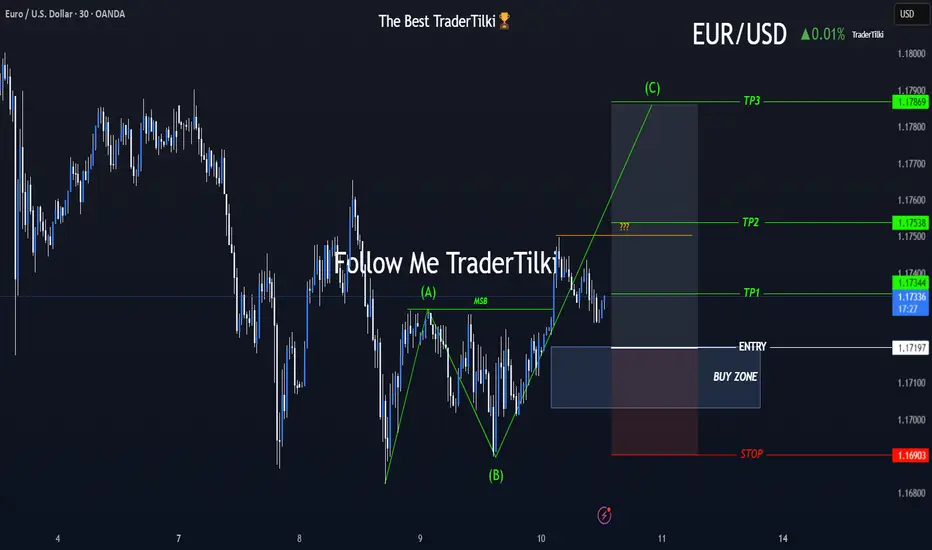
A New Chapter Begins with EURUSD’s ABC Wave Formation!🎯 Hey Guys,
I’ve prepared a fresh EURUSD analysis for you.
The market has shifted direction, and an ABC wave structure has emerged.
I’ve placed a Buy Limit order based on my entry level.
Below, you’ll find my detailed target zones and entry specifics:
🟩 Buy Limit Order: 1.17197
🟥 Stop Loss: 1.16903
📌 Targets:
🔹 TP1: 1.17344
🔹 TP2: 1.17538
🔹 TP3: 1.17869
📊 Risk/Reward Ratio: 2.27
Your likes and support are what keep me motivated to share these analyses consistently.
Huge thanks to everyone who shows love and appreciation! 🙏
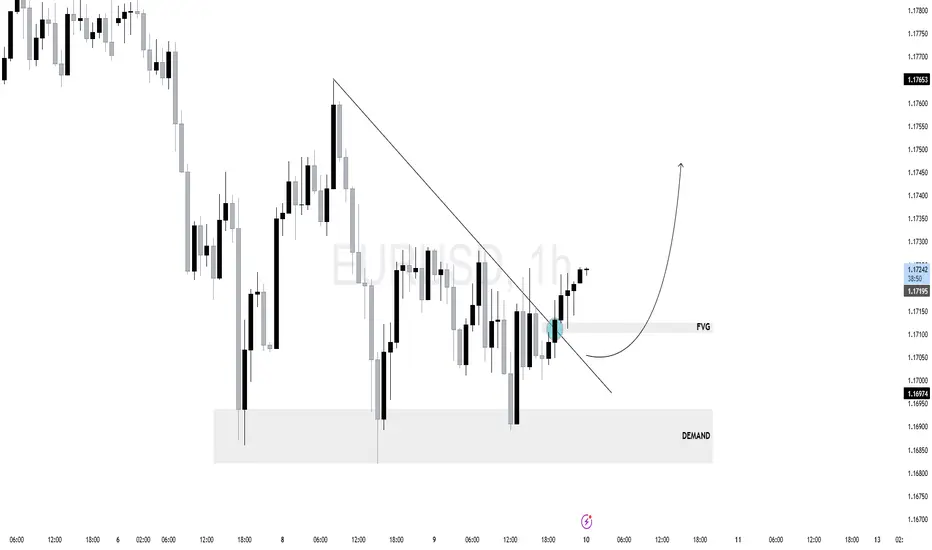
$EU (EURUSD) 1HPrice has been in a short-term downtrend with lower highs and lower lows. Recently, price tapped into a clear demand zone (marked gray at the bottom), showing strong bullish rejection and mitigation.
A clean break of the descending trendline confirms a potential shift in market structure.
Price has now retraced into a Fair Value Gap (FVG) after the breakout — a bullish continuation setup.
As long as price holds above the FVG and demand zone, expect a continuation toward external liquidity above - Demand Zone (1.16700–1.16950)
If price breaks back below the FVG and especially under the demand zone, the bullish scenario weakens
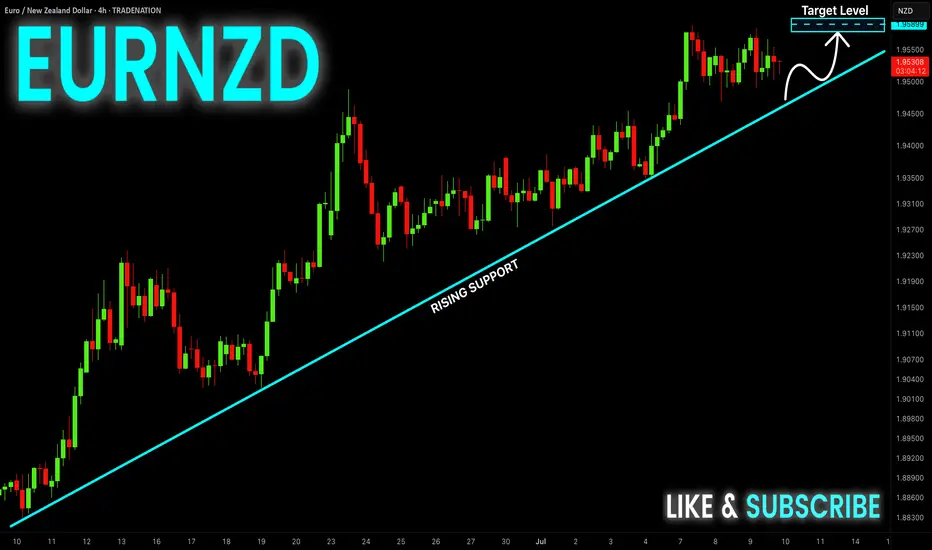
EUR-NZD Strong Uptrend! Buy!
Hello,Traders!
EUR-NZD is trading in a
Strong uptrend along the
Rising support so we are
Bullish biased and we will
Be expecting a further
Bullish move up
Buy!
Comment and subscribe to help us grow!
Check out other forecasts below too!
Disclosure: I am part of Trade Nation's Influencer program and receive a monthly fee for using their TradingView charts in my analysis.
EUR_CHF SUPPORT AHEAD|LONG|
✅EUR_CHF is going down now
But a strong support level is ahead at 0.9293
Thus I am expecting a rebound
And a move up towards the target of 0.9320
LONG🚀
✅Like and subscribe to never miss a new idea!✅
Disclosure: I am part of Trade Nation's Influencer program and receive a monthly fee for using their TradingView charts in my analysis.

EURCHF The Target Is UP! BUY!
My dear friends,
Please, find my technical outlook for EURCHF below:
The instrument tests an important psychological level 0.9312
Bias - Bullish
Technical Indicators: Supper Trend gives a precise Bullish signal, while Pivot Point HL predicts price changes and potential reversals in the market.
Target - 0.9349
Recommended Stop Loss - 0.9293
About Used Indicators:
Super-trend indicator is more useful in trending markets where there are clear uptrends and downtrends in price.
Disclosure: I am part of Trade Nation's Influencer program and receive a monthly fee for using their TradingView charts in my analysis.
———————————
WISH YOU ALL LUCK

EUR/CHF BEARS WILL DOMINATE THE MARKET|SHORT
Hello, Friends!
EUR/CHF pair is trading in a local downtrend which know by looking at the previous 1W candle which is red. On the 1H timeframe the pair is going up. The pair is overbought because the price is close to the upper band of the BB indicator. So we are looking to sell the pair with the upper BB line acting as resistance. The next target is 0.934 area.
Disclosure: I am part of Trade Nation's Influencer program and receive a monthly fee for using their TradingView charts in my analysis.
✅LIKE AND COMMENT MY IDEAS✅

Bearish drop for the Fiber?The price has rejected off the pivot and could drop to the 50% Fibonacci support.
Pivot: 1.1748
1st Support: 1.1631
1st Resistance: 1.1833
Risk Warning:
Trading Forex and CFDs carries a high level of risk to your capital and you should only trade with money you can afford to lose. Trading Forex and CFDs may not be suitable for all investors, so please ensure that you fully understand the risks involved and seek independent advice if necessary.
Disclaimer:
The above opinions given constitute general market commentary, and do not constitute the opinion or advice of IC Markets or any form of personal or investment advice.
Any opinions, news, research, analyses, prices, other information, or links to third-party sites contained on this website are provided on an "as-is" basis, are intended only to be informative, is not an advice nor a recommendation, nor research, or a record of our trading prices, or an offer of, or solicitation for a transaction in any financial instrument and thus should not be treated as such. The information provided does not involve any specific investment objectives, financial situation and needs of any specific person who may receive it. Please be aware, that past performance is not a reliable indicator of future performance and/or results. Past Performance or Forward-looking scenarios based upon the reasonable beliefs of the third-party provider are not a guarantee of future performance. Actual results may differ materially from those anticipated in forward-looking or past performance statements. IC Markets makes no representation or warranty and assumes no liability as to the accuracy or completeness of the information provided, nor any loss arising from any investment based on a recommendation, forecast or any information supplied by any third-party.

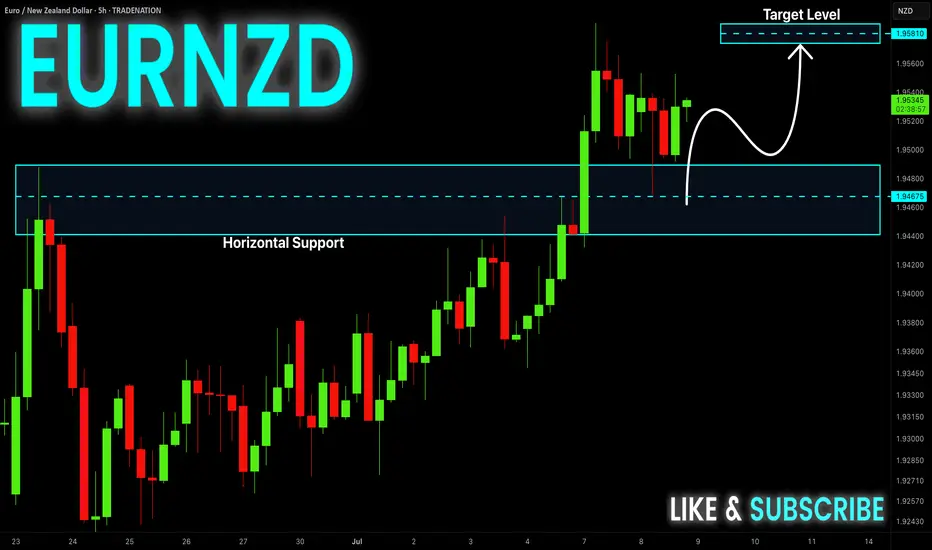
EUR-NZD Will Keep Growing! Buy!
Hello,Traders!
EUR-NZD keeps growing in a
Strong uptrend and the pair
Made a retest and a rebound
From the horizontal support
Of 1.9480 so we are bullish
Biased and we will be expecting
A further bullish move up
Buy!
Comment and subscribe to help us grow!
Check out other forecasts below too!
Disclosure: I am part of Trade Nation's Influencer program and receive a monthly fee for using their TradingView charts in my analysis.
EURCHF SHORT DAILY FORECAST Q3 D8 W28 Y25EURCHF SHORT DAILY FORECAST Q3 D8 W28 Y25
Professional Risk Managers👋
Welcome back to another FRGNT chart update📈
Diving into some Forex setups using predominantly higher time frame order blocks alongside confirmation breaks of structure.
Let’s see what price action is telling us today! 👀
💡Here are some trade confluences📝
✅Daily Order block identified
✅4H Order Block identified
✅1H Order Block identified
🔑 Remember, to participate in trading comes always with a degree of risk, therefore as professional risk managers it remains vital that we stick to our risk management plan as well as our trading strategies.
📈The rest, we leave to the balance of probabilities.
💡Fail to plan. Plan to fail.
🏆It has always been that simple.
❤️Good luck with your trading journey, I shall see you at the very top.
🎯Trade consistent, FRGNT X

EURGBP SHORT DAILY FORECAST Q3 D8 W28 Y25EURGBP SHORT DAILY FORECAST Q3 D8 W28 Y25
Professional Risk Managers👋
Welcome back to another FRGNT chart update📈
Diving into some Forex setups using predominantly higher time frame order blocks alongside confirmation breaks of structure.
Let’s see what price action is telling us today! 👀
💡Here are some trade confluences📝
✅Daily Order block identified
✅4H Order Block identified
✅1H Order Block identified
🔑 Remember, to participate in trading comes always with a degree of risk, therefore as professional risk managers it remains vital that we stick to our risk management plan as well as our trading strategies.
📈The rest, we leave to the balance of probabilities.
💡Fail to plan. Plan to fail.
🏆It has always been that simple.
❤️Good luck with your trading journey, I shall see you at the very top.
🎯Trade consistent, FRGNT X

EURCHF previous support now resistance at 0.9370The EURCHF pair is currently trading with a bearish bias, aligned with the broader downward trend. Recent price action shows a retest of the resistance, suggesting a temporary relief rally within the downtrend.
Key resistance is located at 0.9370, a prior consolidation zone. This level will be critical in determining the next directional move.
A bearish rejection from 0.9370 could confirm the resumption of the downtrend, targeting the next support levels at 0.9310, followed by 0.9290 and 0.9280 over a longer timeframe.
Conversely, a decisive breakout and daily close above 0.9370 would invalidate the current bearish setup, shifting sentiment to bullish and potentially triggering a move towards 0.9380, then 0.9400.
Conclusion:
The short-term outlook remains bearish unless the pair breaks and holds above 0.9370. Traders should watch for price action signals around this key level to confirm direction. A rejection favours fresh downside continuation, while a breakout signals a potential trend reversal or deeper correction.
This communication is for informational purposes only and should not be viewed as any form of recommendation as to a particular course of action or as investment advice. It is not intended as an offer or solicitation for the purchase or sale of any financial instrument or as an official confirmation of any transaction. Opinions, estimates and assumptions expressed herein are made as of the date of this communication and are subject to change without notice. This communication has been prepared based upon information, including market prices, data and other information, believed to be reliable; however, Trade Nation does not warrant its completeness or accuracy. All market prices and market data contained in or attached to this communication are indicative and subject to change without notice.

EURNZD: Steep Channel continuation setupEURNZD continues to rise within a steep ascending channel, maintaining a well-structured sequence. No signs of exhaustion are evident yet, as bullish momentum remains strong and price action continues to respect both the midline and lower boundary of the channel.
This ongoing strength suggests that buyers remain in control, and unless we see a clear shift in structure, such as a break below channel support or loss of momentum, the trend remains intact.
🟢 Trend Bias: I remain bullish on EURNZD while price stays within this channel. Any pullbacks toward the lower channel boundary or previous breakout zones may offer continuation opportunities.
🎯 Target: My upside target is 1.983 , which aligns with the projected upper boundary of the ascending channel and makes a good technical target if the structure continues to hold.
🟥 Invalidation: A confirmed breakdown below the channel with follow-through would challenge this bias and signal the possibility of a deeper corrective move.
For now, the structure favors trend continuation over reversal.
Just sharing my thoughts on support and resistance, this isn’t financial advice. Always confirm your setups and manage your risk properly.
Disclosure: I am part of Trade Nation's Influencer program and receive a monthly fee for using their TradingView charts in my analysis.

Bearish drop for the Fiber?The price is rising towards the pivot which acts as an overlap resistance and could drop to the 1st support.
Entry: 1.1743
1st Support: 1.1631
1st Resistance: 1.1833
Risk Warning:
Trading Forex and CFDs carries a high level of risk to your capital and you should only trade with money you can afford to lose. Trading Forex and CFDs may not be suitable for all investors, so please ensure that you fully understand the risks involved and seek independent advice if necessary.
Disclaimer:
The above opinions given constitute general market commentary, and do not constitute the opinion or advice of IC Markets or any form of personal or investment advice.
Any opinions, news, research, analyses, prices, other information, or links to third-party sites contained on this website are provided on an "as-is" basis, are intended only to be informative, is not an advice nor a recommendation, nor research, or a record of our trading prices, or an offer of, or solicitation for a transaction in any financial instrument and thus should not be treated as such. The information provided does not involve any specific investment objectives, financial situation and needs of any specific person who may receive it. Please be aware, that past performance is not a reliable indicator of future performance and/or results. Past Performance or Forward-looking scenarios based upon the reasonable beliefs of the third-party provider are not a guarantee of future performance. Actual results may differ materially from those anticipated in forward-looking or past performance statements. IC Markets makes no representation or warranty and assumes no liability as to the accuracy or completeness of the information provided, nor any loss arising from any investment based on a recommendation, forecast or any information supplied by any third-party.

EURUSD Bounce on the 4H MA100 eyes 1.2000.The EURUSD pair has been trading within a Channel Up pattern since the May 12 Low. Right now it is expanding its 3rd Bearish Leg of this structure, with the previous two reaching at least either the 4H MA100 (green trend-line) or the 0.5 Fibonacci retracement level before rebounding.
As a result, we expect a rebound soon around the 1.16500 level to start the new Bullish Leg. The last two peaked on the 1.5 Fibonacci extension, which gives us a clear Target at 1.2000.
Notice also that every time the 4H MACD formed a Bullish Cross below the 0.0 mark, it was a confirmed buy signal. Use that to your advantage.
-------------------------------------------------------------------------------
** Please LIKE 👍, FOLLOW ✅, SHARE 🙌 and COMMENT ✍ if you enjoy this idea! Also share your ideas and charts in the comments section below! This is best way to keep it relevant, support us, keep the content here free and allow the idea to reach as many people as possible. **
-------------------------------------------------------------------------------
Disclosure: I am part of Trade Nation's Influencer program and receive a monthly fee for using their TradingView charts in my analysis.
💸💸💸💸💸💸
👇 👇 👇 👇 👇 👇

#EURNZD:Price accumulated now time for distribution! Price completed accumulated and now we expecting a strong bullish price distribution. Next week we can see price going and crossing our target with strong bullish volume kicking in the market. Price may go beyond 2.20 region; let's see how it goes.
Good luck and trade safe!
Team Setupsfx_
