Bullish continuation?EUR/GBP has bounced off the pivot which is a pullback support and could rise to the 128.2% Fibonacci resistance.
Pivot: 0.8608
1st Support: 0.8527
1st Resistance: 0.8767
Risk Warning:
Trading Forex and CFDs carries a high level of risk to your capital and you should only trade with money you can afford to lose. Trading Forex and CFDs may not be suitable for all investors, so please ensure that you fully understand the risks involved and seek independent advice if necessary.
Disclaimer:
The above opinions given constitute general market commentary, and do not constitute the opinion or advice of IC Markets or any form of personal or investment advice.
Any opinions, news, research, analyses, prices, other information, or links to third-party sites contained on this website are provided on an "as-is" basis, are intended only to be informative, is not an advice nor a recommendation, nor research, or a record of our trading prices, or an offer of, or solicitation for a transaction in any financial instrument and thus should not be treated as such. The information provided does not involve any specific investment objectives, financial situation and needs of any specific person who may receive it. Please be aware, that past performance is not a reliable indicator of future performance and/or results. Past Performance or Forward-looking scenarios based upon the reasonable beliefs of the third-party provider are not a guarantee of future performance. Actual results may differ materially from those anticipated in forward-looking or past performance statements. IC Markets makes no representation or warranty and assumes no liability as to the accuracy or completeness of the information provided, nor any loss arising from any investment based on a recommendation, forecast or any information supplied by any third-party.
EUR (Euro)

ECB decision shadowed by tariff risk Markets will be closely watching the European Central Bank’s (ECB) interest rate decision on April 17, with expectations for a seventh consecutive rate cut.
Despite this expectation, the euro surged to a three-year high against the US dollar last week, as traders continued to pull away from US assets.
The dollar index has dropped 4% since President Trump’s “Liberation Day” tariff announcements on April 2, falling below the key 100 level too.
At this stage, market participants will be looking for any signals on how the ECB might respond to the potential spillover effects of President Trump’s tariff measures. While some guidance may emerge around already-announced policies, the risk of further unpredictability remains high.
Trump being Trump, it is perhaps unlikely we have seen the last of his volatility-inducing tariff announcements. This can weigh further on the dollar, eroding confidence in the world’s reserve currency.

EUR-CHF Local Bullish Bias! Buy!
Hello,Traders!
EUR-CHF has hit a horizontal
Demand level abound 0.9202
And we are already seeing a
Local bullish rebound so
Despite this being a counter
Trend long, we will still be
Expecting a local bullish
Correction on Monday
Because the pair seems to
Be oversold, however, we
Would suggest using small
Lot size due to how risky and
Volatile the market has been
These last few weeks
Buy!
Comment and subscribe to help us grow!
Check out other forecasts below too!
Disclosure: I am part of Trade Nation's Influencer program and receive a monthly fee for using their TradingView charts in my analysis.

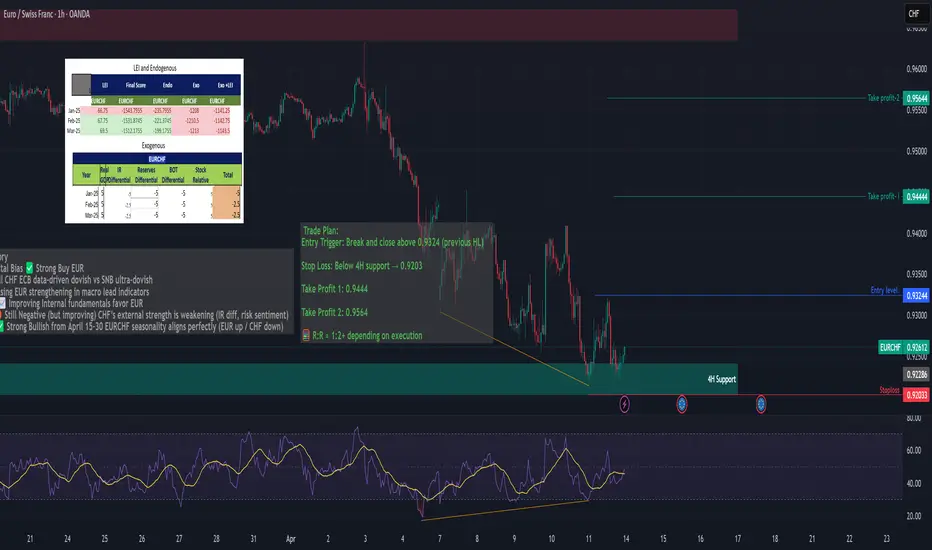
EURCHF – Bullish Reversal Setup + Fundamentals Trade Idea Summary: EUR/CHF showing strong bullish confluence:
✅ Bullish RSI Divergence on both 1H & 4H
📉 Price testing a key 4H support zone
📊 Seasonality favors EURCHF upside (bullish from April 15–30)
🧠 Fundamentals, COT, LEI + Endogenous indicators support long EUR / short CHF
ECB: Dovish but stable, EUR fundamentals improving (LEI ↑, Endo ↑)
SNB: Aggressively dovish, low inflation, weak CHF outlook
EUR_CHF SUPPORT AHEAD|LONG|
✅EUR_CHF is about to retest a key structure level of 0.9204
Which implies a high likelihood of a move up
As some market participants will be taking profit from short positions
While others will find this price level to be good for buying
So as usual we will have a chance to ride the wave of a bullish correction
LONG🚀
✅Like and subscribe to never miss a new idea!✅

EUR-NZD Bullish Bias! Buy!
Hello,Traders!
EUR-NZD is approaching a
Wide horizontal support
Level of 1.9240 so as the
Pair is trading in a local
Uptrend we will be expecting
A local bullish rebound
After the pair retests the
Support on Monday
Buy!
Comment and subscribe to help us grow!
Check out other forecasts below too!
Disclosure: I am part of Trade Nation's Influencer program and receive a monthly fee for using their TradingView charts in my analysis.

EUR_NZD LOCAL LONG|
✅EUR_NZD is going down
Now but a local horizontal
Support level is ahead at 1.9300
So after the retest a local
Bullish rebound is to be expected
LONG🚀
✅Like and subscribe to never miss a new idea!✅
Disclosure: I am part of Trade Nation's Influencer program and receive a monthly fee for using their TradingView charts in my analysis.

EURCHF: Bullish Continuation & Long Trade
The recent price action on the EURCHF pair was keeping me on the fence, however, my bias is slowly but surely changing into the bullish one and I think we will see the price go up.
Disclosure: I am part of Trade Nation's Influencer program and receive a monthly fee for using their TradingView charts in my analysis.
❤️ Please, support our work with like & comment! ❤️

Bullish bounce off pullback support?EUR/NZD has bounced off the pivot which has been identified as a pullback support that lines up with the 38.2% Fibonacci retracement and could rise to the 1st resistance.
Pivot: 1.94887
1st Support: 1.82716
1st Resistance: 1.97446
CAD/JPY is falling towards the pivot which is a pullback support and could bounce to the pullback resistance.
Pivot: 102.61
1st Support: 101.62
1st Resistance: 103.68
Risk Warning:
Trading Forex and CFDs carries a high level of risk to your capital and you should only trade with money you can afford to lose. Trading Forex and CFDs may not be suitable for all investors, so please ensure that you fully understand the risks involved and seek independent advice if necessary.
Disclaimer:
The above opinions given constitute general market commentary, and do not constitute the opinion or advice of IC Markets or any form of personal or investment advice.
Any opinions, news, research, analyses, prices, other information, or links to third-party sites contained on this website are provided on an "as-is" basis, are intended only to be informative, is not an advice nor a recommendation, nor research, or a record of our trading prices, or an offer of, or solicitation for a transaction in any financial instrument and thus should not be treated as such. The information provided does not involve any specific investment objectives, financial situation and needs of any specific person who may receive it. Please be aware, that past performance is not a reliable indicator of future performance and/or results. Past Performance or Forward-looking scenarios based upon the reasonable beliefs of the third-party provider are not a guarantee of future performance. Actual results may differ materially from those anticipated in forward-looking or past performance statements. IC Markets makes no representation or warranty and assumes no liability as to the accuracy or completeness of the information provided, nor any loss arising from any investment based on a recommendation, forecast or any information supplied by any third-party.

Bullish bounce off pullback support?EUR/AUD has bounced off the pivot and could rise to the pullback resistance.
Pivot: 1.79142
1st Support: 1.76955
1st Resistance: 1.82291
Risk Warning:
Trading Forex and CFDs carries a high level of risk to your capital and you should only trade with money you can afford to lose. Trading Forex and CFDs may not be suitable for all investors, so please ensure that you fully understand the risks involved and seek independent advice if necessary.
Disclaimer:
The above opinions given constitute general market commentary, and do not constitute the opinion or advice of IC Markets or any form of personal or investment advice.
Any opinions, news, research, analyses, prices, other information, or links to third-party sites contained on this website are provided on an "as-is" basis, are intended only to be informative, is not an advice nor a recommendation, nor research, or a record of our trading prices, or an offer of, or solicitation for a transaction in any financial instrument and thus should not be treated as such. The information provided does not involve any specific investment objectives, financial situation and needs of any specific person who may receive it. Please be aware, that past performance is not a reliable indicator of future performance and/or results. Past Performance or Forward-looking scenarios based upon the reasonable beliefs of the third-party provider are not a guarantee of future performance. Actual results may differ materially from those anticipated in forward-looking or past performance statements. IC Markets makes no representation or warranty and assumes no liability as to the accuracy or completeness of the information provided, nor any loss arising from any investment based on a recommendation, forecast or any information supplied by any third-party.

EURCHF: Strong bearish waveEURCHF is bearish on its 1D technical outlook (RSI = 32.579, MACD = -0.004, ADX = 41.175) being on a strong bearish wave inside its Channel Down. We estimate to complete a symmetric -8.33% decline from the top, as the previous wave did (TP = 0.91100).
See how our prior idea has worked out:
## If you like our free content follow our profile to get more daily ideas. ##
## Comments and likes are greatly appreciated. ##

EURUSD POSSIBLE TRADE SETUPPotential Trade Setup on EURUSD
EURUSD is on a strong 3-week rally correction that was almost got rejected on Friday due to the UK and US GDP data that came pretty strong and weak respectively.
That said, I am still quite anticipating for a possible correction to continue towards the 50% fib level at 1.0650, before we can start looking for a possible buy entry in the long term.
Trading Plan:
1. BUY if the resistance gets broken and retest successfully.
2. SELL if the current region acts as resistance for rejection towards the downside with an engulfing called on the 4H chart.
Targets:
1. Can be 1:2 for either entries.
Tips:
1. The RSI (1d) indicates an Overbought but easing gradually towards the 50 level.
Please like, follow, and comment!!
You may find more details in the chart!
Thank you and Trade Responsibly!
❤️PS: Please support with a like or comment if you find this analysis useful for your trading day❤️

EUR/NZD Wave Structure Shift: 4th Wave Correction in ProgressThe 3rd wave in EUR/NZD appears to have been completed, and the market seems to be entering the 4th wave. There is a possibility that the 4th wave could take support near the Fibonacci 0.5 level (1.19164). After that, the 5th wave of the impulse phase may move upward.
If the market falls below 1.98303, it would confirm the beginning of the 4th wave. In that scenario, the first target could be around 1.95907 .

EUR/PLN SHORT Investment Opportunity 4HHello, I am Trader Andrea Russo and today I want to show you a SHORT investment opportunity on EUR/PLN. We are currently on a 4-hour (4H) chart, and some technical indicators suggest increasing bearish pressure. The overbought signals and the loss of momentum suggest that we could be facing a possible bearish reversal, making this configuration particularly interesting.
Here is the Investment Setup:
The entry price for the trade is set at 4.2854.
There is a SELL signal with a target price set at 4.2066, corresponding to a TP of 1.85%.
The stop loss is set at 4.2593, corresponding to a SL of 0.61%.
This short position offers a favorable risk/reward ratio, taking advantage of the current bearish pressure and the possible confirmation of a bearish trend on EUR/PLN.
As always, I encourage you to monitor this setup carefully and apply strategic and conscious risk management to your trading plan. Happy trading! 📉

Heading into 61.8% Fibonacci resistance?The Fiber (EUR/USD) is rising towards the pivot and could reverse to the 1st support which has been identified as a pullback support.
Pivot: 1.1024
1st Support: 1.0939
1st Resistance: 1.1089
Risk Warning:
Trading Forex and CFDs carries a high level of risk to your capital and you should only trade with money you can afford to lose. Trading Forex and CFDs may not be suitable for all investors, so please ensure that you fully understand the risks involved and seek independent advice if necessary.
Disclaimer:
The above opinions given constitute general market commentary, and do not constitute the opinion or advice of IC Markets or any form of personal or investment advice.
Any opinions, news, research, analyses, prices, other information, or links to third-party sites contained on this website are provided on an "as-is" basis, are intended only to be informative, is not an advice nor a recommendation, nor research, or a record of our trading prices, or an offer of, or solicitation for a transaction in any financial instrument and thus should not be treated as such. The information provided does not involve any specific investment objectives, financial situation and needs of any specific person who may receive it. Please be aware, that past performance is not a reliable indicator of future performance and/or results. Past Performance or Forward-looking scenarios based upon the reasonable beliefs of the third-party provider are not a guarantee of future performance. Actual results may differ materially from those anticipated in forward-looking or past performance statements. IC Markets makes no representation or warranty and assumes no liability as to the accuracy or completeness of the information provided, nor any loss arising from any investment based on a recommendation, forecast or any information supplied by any third-party.

Falling towards 61.8% Fibonacci support?EUR/JPY is falling towards the pivot which has been identified as a pullback support and could bounce tot he 1st resistance which acts as a pullback resistance.
Pivot; 160.52
1st Support: 159.67
1st Resistance: 162.16
Risk Warning:
Trading Forex and CFDs carries a high level of risk to your capital and you should only trade with money you can afford to lose. Trading Forex and CFDs may not be suitable for all investors, so please ensure that you fully understand the risks involved and seek independent advice if necessary.
Disclaimer:
The above opinions given constitute general market commentary, and do not constitute the opinion or advice of IC Markets or any form of personal or investment advice.
Any opinions, news, research, analyses, prices, other information, or links to third-party sites contained on this website are provided on an "as-is" basis, are intended only to be informative, is not an advice nor a recommendation, nor research, or a record of our trading prices, or an offer of, or solicitation for a transaction in any financial instrument and thus should not be treated as such. The information provided does not involve any specific investment objectives, financial situation and needs of any specific person who may receive it. Please be aware, that past performance is not a reliable indicator of future performance and/or results. Past Performance or Forward-looking scenarios based upon the reasonable beliefs of the third-party provider are not a guarantee of future performance. Actual results may differ materially from those anticipated in forward-looking or past performance statements. IC Markets makes no representation or warranty and assumes no liability as to the accuracy or completeness of the information provided, nor any loss arising from any investment based on a recommendation, forecast or any information supplied by any third-party.

Bullish rise?EUR/GBP has bounced off the pivot and could rise to the 1st resistance which lines up with the 50% Fibonacci retracement.
Pivot: 0.8524
1st Support: 0.8493
1st Resistance: 0.8589
Risk Warning:
Trading Forex and CFDs carries a high level of risk to your capital and you should only trade with money you can afford to lose. Trading Forex and CFDs may not be suitable for all investors, so please ensure that you fully understand the risks involved and seek independent advice if necessary.
Disclaimer:
The above opinions given constitute general market commentary, and do not constitute the opinion or advice of IC Markets or any form of personal or investment advice.
Any opinions, news, research, analyses, prices, other information, or links to third-party sites contained on this website are provided on an "as-is" basis, are intended only to be informative, is not an advice nor a recommendation, nor research, or a record of our trading prices, or an offer of, or solicitation for a transaction in any financial instrument and thus should not be treated as such. The information provided does not involve any specific investment objectives, financial situation and needs of any specific person who may receive it. Please be aware, that past performance is not a reliable indicator of future performance and/or results. Past Performance or Forward-looking scenarios based upon the reasonable beliefs of the third-party provider are not a guarantee of future performance. Actual results may differ materially from those anticipated in forward-looking or past performance statements. IC Markets makes no representation or warranty and assumes no liability as to the accuracy or completeness of the information provided, nor any loss arising from any investment based on a recommendation, forecast or any information supplied by any third-party.

EURGBP Breakout And Potential RetraceHey Traders, in today's trading session we are monitoring EURGBP for selling opportunity around 0.85700 zone, EURGBP was trading in an uptrend and successfully managed to break it out. Currently is in a correction phase in which it is approaching the retrace area at 0.85700 support and resistance area.
Trade safe, Joe.

EURUSD: Channel Down topped. Huge sell ahead.EURUSD corrected the previously overbought levels on its 1D technical outlook (RSI = 60.799, MACD = 0.009, ADX = 25.183) and 1W is expected to follow suit as the price is making a double rejection at the top of the 2 year Channel Down. We anticipate a new -9.25% long term bearish wave to begin (TP = 1.01300).
## If you like our free content follow our profile to get more daily ideas. ##
## Comments and likes are greatly appreciated. ##

EURUSD - Trade The Impulse!Hello TradingView Family / Fellow Traders. This is Richard, also known as theSignalyst.
📈EURUSD has been bearish trading within the falling wedge pattern marked in red.
Currently, EURUSD is retesting the upper bound of the wedge.
Moreover, the $1.12 is a strong weekly supply zone.
🏹 Thus, the highlighted red circle is a strong area to look for sell setups as it is the intersection of the upper red trendline and supply.
📚 As per my trading style:
As #EURUSD is hovering around the red circle zone, I will be looking for bearish reversal setups (like a double top pattern, trendline break , and so on...)
📚 Always follow your trading plan regarding entry, risk management, and trade management.
Good luck!
All Strategies Are Good; If Managed Properly!
~Rich
Disclosure: I am part of Trade Nation's Influencer program and receive a monthly fee for using their TradingView charts in my analysis.

EUR/CHF BULLISH BIAS RIGHT NOW| LONG
Hello, Friends!
Previous week’s red candle means that for us the EUR/CHF pair is in the downtrend. And the current movement leg was also down but the support line will be hit soon and lower BB band proximity will signal an oversold condition so we will go for a counter-trend long trade with the target being at 0.943.
Disclosure: I am part of Trade Nation's Influencer program and receive a monthly fee for using their TradingView charts in my analysis.
✅LIKE AND COMMENT MY IDEAS✅

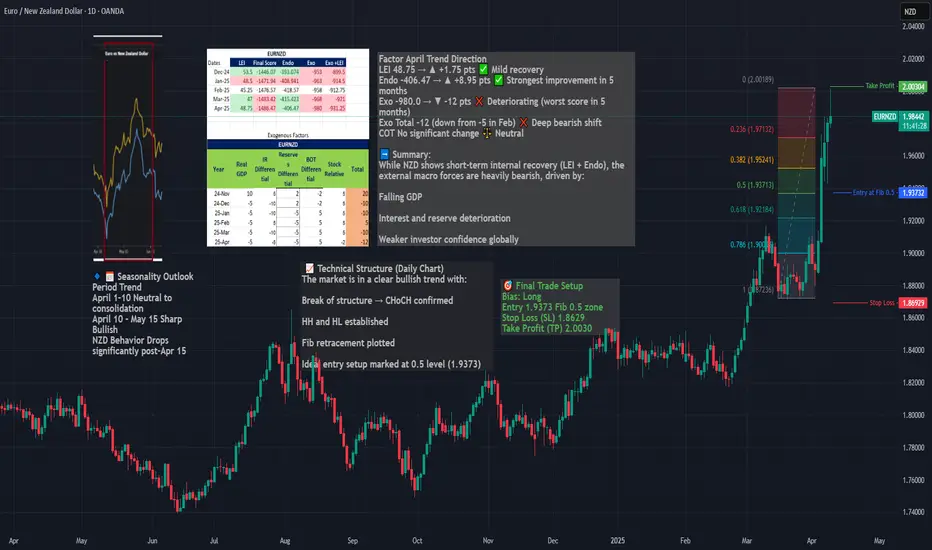
Long EURNZD – Seasonal, Fundamentals & Technical ConfluenceWe are entering a long position on EURNZD, capitalizing on a powerful confluence of:
Seasonal EUR strength + NZD weakness (April 10 – May 15)
A clear bullish market structure (CHoCH, HH/HL)
A clean Fibonacci retracement entry at 0.5
Strong macro divergence, with NZD exogenous conditions deteriorating
Macro & Seasonal Context
EUR enters a strong seasonal uptrend from April 10 to end of month
NZD shows seasonal weakness from April 15 onward
NZD’s exogenous model score worsened to -12 in April
While NZD LEI and endo improved, it remains structurally weak
Timing
Best execution: on pullback to 1.9373 zone, ideally between April 10–15, aligned with seasonal entry window.
Heading into 61.8% Fibonacci resistance?EUR/JPY is rising towards the pivot and could drop to the 1st support.
Pivot: 161.18
1st Support: 159.92
1st Resistance: 162.16
Risk Warning:
Trading Forex and CFDs carries a high level of risk to your capital and you should only trade with money you can afford to lose. Trading Forex and CFDs may not be suitable for all investors, so please ensure that you fully understand the risks involved and seek independent advice if necessary.
Disclaimer:
The above opinions given constitute general market commentary, and do not constitute the opinion or advice of IC Markets or any form of personal or investment advice.
Any opinions, news, research, analyses, prices, other information, or links to third-party sites contained on this website are provided on an "as-is" basis, are intended only to be informative, is not an advice nor a recommendation, nor research, or a record of our trading prices, or an offer of, or solicitation for a transaction in any financial instrument and thus should not be treated as such. The information provided does not involve any specific investment objectives, financial situation and needs of any specific person who may receive it. Please be aware, that past performance is not a reliable indicator of future performance and/or results. Past Performance or Forward-looking scenarios based upon the reasonable beliefs of the third-party provider are not a guarantee of future performance. Actual results may differ materially from those anticipated in forward-looking or past performance statements. IC Markets makes no representation or warranty and assumes no liability as to the accuracy or completeness of the information provided, nor any loss arising from any investment based on a recommendation, forecast or any information supplied by any third-party.
