HelenP. I Euro drops to $1.0650 points, breaking support levelHi folks today I'm prepared for you Euro analytics. After analyzing this chart, we can see that the price spent some time within a consolidation range. During this period, the price tested the lower support zone and made a strong reaction from this level, moving upwards. This move showed strong buying pressure as the price quickly reversed from the support zone, signaling that buyers were ready to push higher. The price then broke above the trend line, continuing to rise and establishing a bullish momentum. It reached the upper resistance zone before encountering resistance and starting to consolidate. This consolidation happened within a narrow range, confirming that the market was unsure about the next move but still held above the important support 1. Now, the price is trading near the trend line and is testing the support zone. A reaction from this support will be crucial for determining the next move. Given the current price action, I expect a potential continuation of the move towards my goal at 1.0650, where the price may encounter further support and the previous price action. If you like my analytics you may support me with your like/comment ❤️
EUR (Euro)

EUR/NZD 4H AnalysisEUR/NZD 4H Analysis
The pair is breaking above trendline resistance, targeting 1.8939–1.9168.
Support: 1.8807
Resistance: 1.8939 | 1.9060 | 1.9168
A retest of 1.8884 may confirm bullish continuation.

Bullish bounce?EUR/GBP is reacting off the pivot and could bounce to the 1st resistance.
Pivot: 0.8337
1st Support: 0.8310
1st Resistance: 0.8377
Risk Warning:
Trading Forex and CFDs carries a high level of risk to your capital and you should only trade with money you can afford to lose. Trading Forex and CFDs may not be suitable for all investors, so please ensure that you fully understand the risks involved and seek independent advice if necessary.
Disclaimer:
The above opinions given constitute general market commentary, and do not constitute the opinion or advice of IC Markets or any form of personal or investment advice.
Any opinions, news, research, analyses, prices, other information, or links to third-party sites contained on this website are provided on an "as-is" basis, are intended only to be informative, is not an advice nor a recommendation, nor research, or a record of our trading prices, or an offer of, or solicitation for a transaction in any financial instrument and thus should not be treated as such. The information provided does not involve any specific investment objectives, financial situation and needs of any specific person who may receive it. Please be aware, that past performance is not a reliable indicator of future performance and/or results. Past Performance or Forward-looking scenarios based upon the reasonable beliefs of the third-party provider are not a guarantee of future performance. Actual results may differ materially from those anticipated in forward-looking or past performance statements. IC Markets makes no representation or warranty and assumes no liability as to the accuracy or completeness of the information provided, nor any loss arising from any investment based on a recommendation, forecast or any information supplied by any third-party.

Bearish drop off 38.2% Fibonacci resistance?EUR/USD is rising towards the resistance level which is a pullback resistance that line sup with the 38.2% Fibonacci retracement and could drop from this level to our take profit.
Entry: 1.0833
Why we like it:
There is a pullback resistance level that lines up with the 38.2% Fibonacci retracement.
Stop loss: 1.0884
Why we like it:
There is a pullback resistance level that lines up with the 61.8% Fibonacci retracement.
Take profit: 1.0706
Why we like it:
There is a pullback support level that lines up with the 38.2% Fibonacci retracement.
Enjoying your TradingView experience? Review us!
Please be advised that the information presented on TradingView is provided to Vantage (‘Vantage Global Limited’, ‘we’) by a third-party provider (‘Everest Fortune Group’). Please be reminded that you are solely responsible for the trading decisions on your account. There is a very high degree of risk involved in trading. Any information and/or content is intended entirely for research, educational and informational purposes only and does not constitute investment or consultation advice or investment strategy. The information is not tailored to the investment needs of any specific person and therefore does not involve a consideration of any of the investment objectives, financial situation or needs of any viewer that may receive it. Kindly also note that past performance is not a reliable indicator of future results. Actual results may differ materially from those anticipated in forward-looking or past performance statements. We assume no liability as to the accuracy or completeness of any of the information and/or content provided herein and the Company cannot be held responsible for any omission, mistake nor for any loss or damage including without limitation to any loss of profit which may arise from reliance on any information supplied by Everest Fortune Group.

Bearish reversal off pulback resistance?EUR/CAD is rising towards the resistance level which is a pullback resistance that line sup with the 38.2% Fibonacci retracement and could reverse from this level to our take profit.
Entry: 1.5548
Why we like it:
There is a pullback resistance level that line sup with the 38.2% Fibonacci retracement.
Stop loss: 1.5695
Why we like it:
There is a pullback resistance level that line sup with the 71% Fibonacci retracement.
Take profit: 1.5340
Why we like it:
There is a pullback support level.
Enjoying your TradingView experience? Review us!
Please be advised that the information presented on TradingView is provided to Vantage (‘Vantage Global Limited’, ‘we’) by a third-party provider (‘Everest Fortune Group’). Please be reminded that you are solely responsible for the trading decisions on your account. There is a very high degree of risk involved in trading. Any information and/or content is intended entirely for research, educational and informational purposes only and does not constitute investment or consultation advice or investment strategy. The information is not tailored to the investment needs of any specific person and therefore does not involve a consideration of any of the investment objectives, financial situation or needs of any viewer that may receive it. Kindly also note that past performance is not a reliable indicator of future results. Actual results may differ materially from those anticipated in forward-looking or past performance statements. We assume no liability as to the accuracy or completeness of any of the information and/or content provided herein and the Company cannot be held responsible for any omission, mistake nor for any loss or damage including without limitation to any loss of profit which may arise from reliance on any information supplied by Everest Fortune Group.

EURO - Price can correct to support area and rise to $1.0955Hi guys, this is my overview for EURUSD, feel free to check it and write your feedback in comments👊
Some days ago price started to grow inside a rising channel, where it broke the $1.0345 level and then it reached the resistance line.
Next, price made correction to support line of channel and then it quickly reached $1.0345 level and broke it again.
After this, price continued to grow in the channel, and later, it exited from it and rose to $1.0765 level.
Soon, price broke this level and started to trades inside flat, where it reached top part of flat and some time traded near.
Then it started to decline, so, now I expect that Euro can bounce up from support area and rise to $1.0955 points.
If this post is useful to you, you can support me with like/boost and advice in comments❤️

EUR/CHFKey Observations:
Support Area:
A brown-highlighted support zone indicates a potential area where price has historically found buyers.
Price recently touched this area and is showing signs of reaction.
Order Blocks (OB):
A Bullish OB is present below the current price, which suggests a potential demand zone.
Bearish OBs are present above, indicating potential resistance.
Fair Value Gaps (FVG):
Several FVG zones are highlighted, suggesting inefficiencies in price that could be revisited before continuing the trend.
Trade Setup:
A long position (buy trade) appears to be placed, targeting 0.97085 with a stop-loss around 0.94465.
This suggests a bullish bias, expecting price to move upwards after rejecting the support.
Bullish Scenario:
If price holds above the support area and fills the nearby FVGs, it could aim for the 0.96000-0.97000 range.
Breaking above the Bearish OBs would confirm further upside.
Bearish Scenario:
If price fails to hold the support and breaks below 0.95000, it could continue downward to 0.94465 or lower.
Rejection at the Fair Value Gap above could push price back down.

EURNZD - Short Term Sell Trade Update!!!Hi Traders, on March 18th I shared this idea "EURNZD Bearish Trend Structure Indicates Potential Continuation"
We expected to see bearish continuation after retraces. You can read the full post using the link above.
The bearish move delivered, as expected!!!
If you enjoy this idea, don’t forget to LIKE 👍, FOLLOW ✅, SHARE 🙌, and COMMENT ✍! Drop your thoughts and charts below to keep the discussion going. Your support helps keep this content free and reach more people! 🚀
-------------------------------------------------------------------------------------------------------------------
Disclosure: I am part of Trade Nation's Influencer program and receive a monthly fee for using their TradingView charts in my analysis.

Euro can drop to 1.0650 points, breaking support levelHello traders, I want share with you my opinion about Euro. Earlier, the price was moving inside a range, bouncing between the boundaries and forming a buyer zone near the lower support area. After several rebounds, EUR started to grow and eventually broke out from the range, making a strong upward impulse. The growth continued with a breakout through the support level, which later turned into a support area. From there, the price continued its bullish trend, but after touching the resistance line, it turned around and entered a correction phase. Over the last few sessions, Euro has been forming a pennant pattern, trading between the resistance line and the support line. Now the price is consolidating near the apex of the pennant, showing weak momentum. I expect a false breakout to the upside, followed by a sharp decline from the resistance line. In this scenario, the price would likely break through the current support area and move toward the 1.0650 points - this is my TP1. Given the recent price structure, the correction phase, and the weakening bullish pressure, I remain bearish and anticipate further decline. Please share this idea with your friends and click Boost 🚀

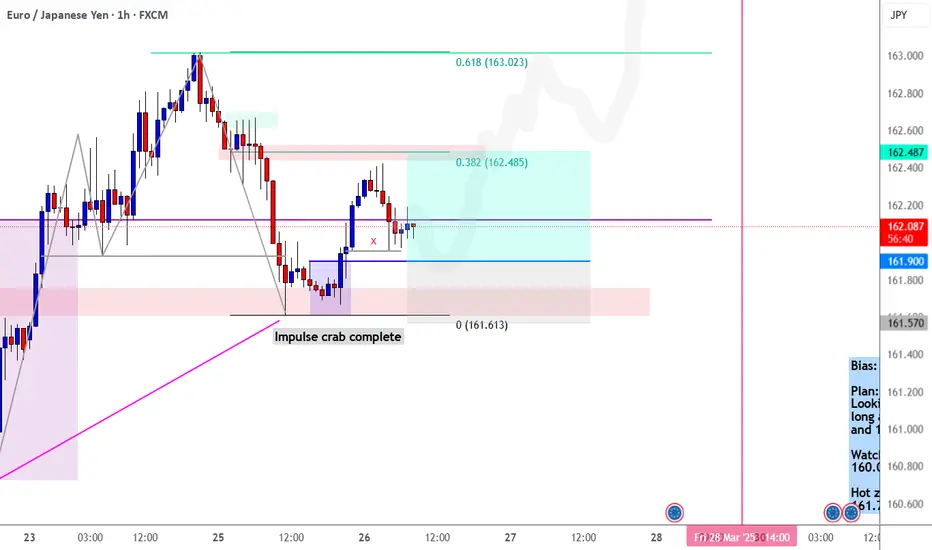
EURJPY Setup IdeaLooking for a long entry, limit order set....
Here is my logic from left to right: we have an short term "double top" forming inside a higher time frame up trend, I'm looking for a run on the stops of traders going short.
We found support at a bullish liquidity pocket (bottom red spot) = Bullish sign
Price completed a bullish harmonic (that grey double top structure is a harmonic) = Bullish sign
Price gave me entry signal with H1 break of structure (blue zone) = Bullish sign
We have equal lows sitting just above the blue line (X's) = Bullish sign
My target is the next red zone even though im projecting this pair to go much higher.
Earlier this week in my newsletter, I gave two zones to look for buy reactions in for EURJPY.
(the huge purple zone on the left, and the bottom red zone within it which currently has a +75 pip reaction.)
Feel free to check it out, the link is in my post signature, and profile bio.
Cheers 🍻
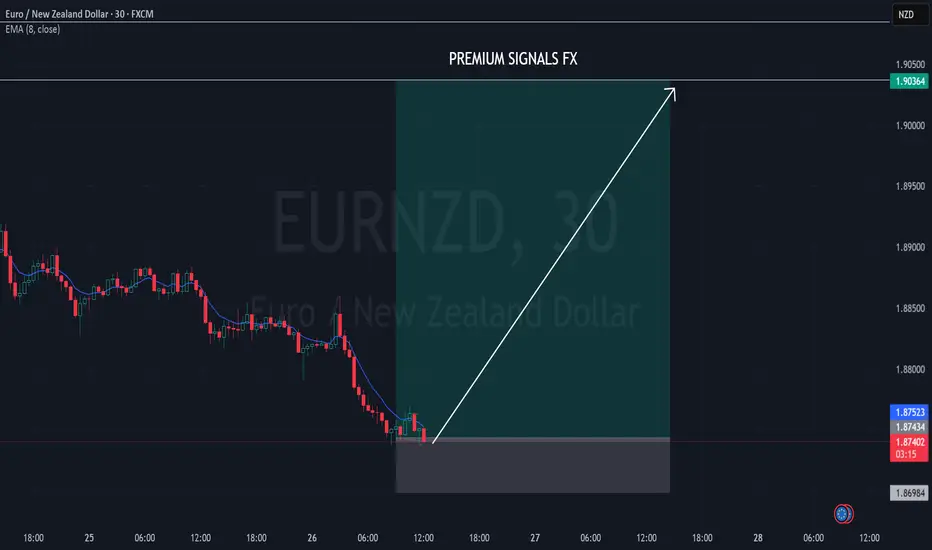
EURNZD LONG ReboundEURNZD Rebound, we have Bullish candlestick confirmation on 1h timeframe, moreover, the price jumped up from 0.86% fibbonacci level.
GOLD Bouncing Higher, Following 200-hour SMA Major Support Gold prices have experienced significant volatility over the last days, with conflicting reports on the current trend. According to some sources, gold prices have increased, with spot gold reaching nearly $3,050, new all the history high on Thursday, March 20, 2025.
The $3,000 milestone has sparked increased interest from investors and market analysts, meaning that Gold spot doubled in price over the past 5 years, 3rd time in history ever.
Despite the short-term volatility, gold has shown a strong performance since the beginning of 2025, with an increase of approximately 14-15% year-to-date. Market analysts remain bullish on gold, with some forecasting prices to reach $3,100-$3,200 per ounce in the near term.
The main 1-hour Gold spot OANDA:XAUUSD graph indicates on 200-hours SMA technical support, with further upside opportunity due to mentioned on the chart descending triangle (flat bottom/ descending top) breakthrow.
--
Best #GODL wishes,
@PandorraResearch Team

Bearish drop?The Fiber (EUR/USD) has reacted off the pivot and could drop to the 1st support.
Pivot: 1.0835
1st Support: 1.0722
1st Resistance: 1.0911
Risk Warning:
Trading Forex and CFDs carries a high level of risk to your capital and you should only trade with money you can afford to lose. Trading Forex and CFDs may not be suitable for all investors, so please ensure that you fully understand the risks involved and seek independent advice if necessary.
Disclaimer:
The above opinions given constitute general market commentary, and do not constitute the opinion or advice of IC Markets or any form of personal or investment advice.
Any opinions, news, research, analyses, prices, other information, or links to third-party sites contained on this website are provided on an "as-is" basis, are intended only to be informative, is not an advice nor a recommendation, nor research, or a record of our trading prices, or an offer of, or solicitation for a transaction in any financial instrument and thus should not be treated as such. The information provided does not involve any specific investment objectives, financial situation and needs of any specific person who may receive it. Please be aware, that past performance is not a reliable indicator of future performance and/or results. Past Performance or Forward-looking scenarios based upon the reasonable beliefs of the third-party provider are not a guarantee of future performance. Actual results may differ materially from those anticipated in forward-looking or past performance statements. IC Markets makes no representation or warranty and assumes no liability as to the accuracy or completeness of the information provided, nor any loss arising from any investment based on a recommendation, forecast or any information supplied by any third-party.

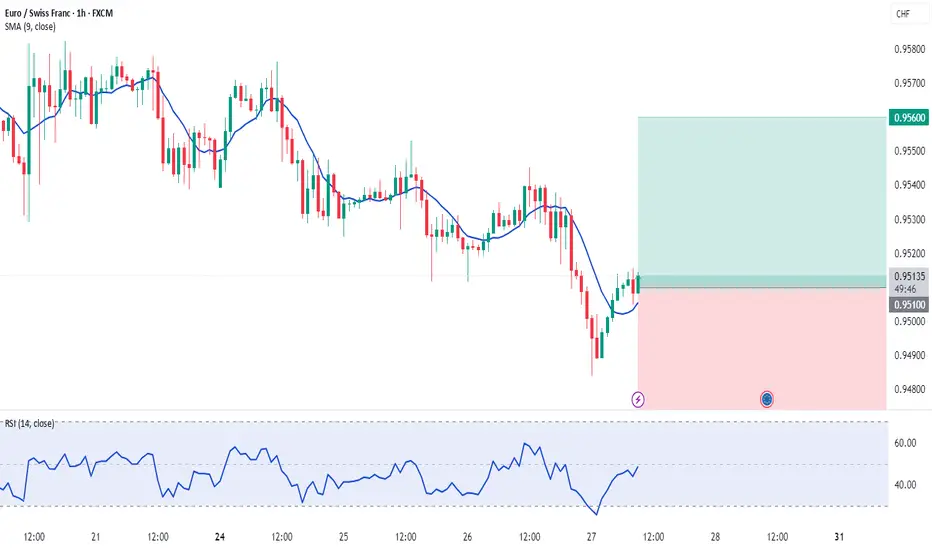
EURCHF My Opinion! BUY!
My dear friends,
EURCHF looks like it will make a good move, and here are the details:
The market is trading on 0.9524 pivot level.
Bias - Bullish
Technical Indicators: Supper Trend generates a clear long signal while Pivot Point HL is currently determining the overall Bullish trend of the market.
Goal -0.9565
Recommended Stop Loss - 0.9499
About Used Indicators:
Pivot points are a great way to identify areas of support and resistance, but they work best when combined with other kinds of technical analysis
Disclosure: I am part of Trade Nation's Influencer program and receive a monthly fee for using their TradingView charts in my analysis.
———————————
WISH YOU ALL LUCK
EURNZD Downtrend in Play – Key Breakdown & Bearish OutlookThe 4H chart of EURNZD shows a descending trendline resistance, indicating a sustained bearish trend.
Price is rejecting the 1.8850 resistance level, aligning with the 38.2% Fibonacci retracement, reinforcing the bearish bias.
A potential breakdown could lead the pair towards the 1.8726 support level (50% Fibonacci), followed by the 1.8200 key demand zone.
Trade Setup & Levels:
Entry Zone: Below 1.8820 after a confirmed rejection.
Target 1 (TP1): 1.8726 – mid-support level
Target 2 (TP2): 1.8200 – major demand zone & 100% Fibonacci extension
Stop Loss (SL): Above 1.8987 to avoid false breakouts.
Bearish Confirmation Factors:
✅ Lower highs and trendline rejection, confirming downward momentum.
✅ Breakdown of support zones, leading to extended selling pressure.
✅ Fibonacci confluence, reinforcing downside targets.
Conclusion:
A break below 1.8726 will accelerate selling momentum, with 1.8200 as the ultimate bearish target. Traders should watch for confirmation signals before entering short positions. 📉

EURUSDBuy Eurusd
Entry: 1.08032
SL: 1.08017 or 1.08016
TP; 1.08077
Your reward is 3 times greater than your risk.

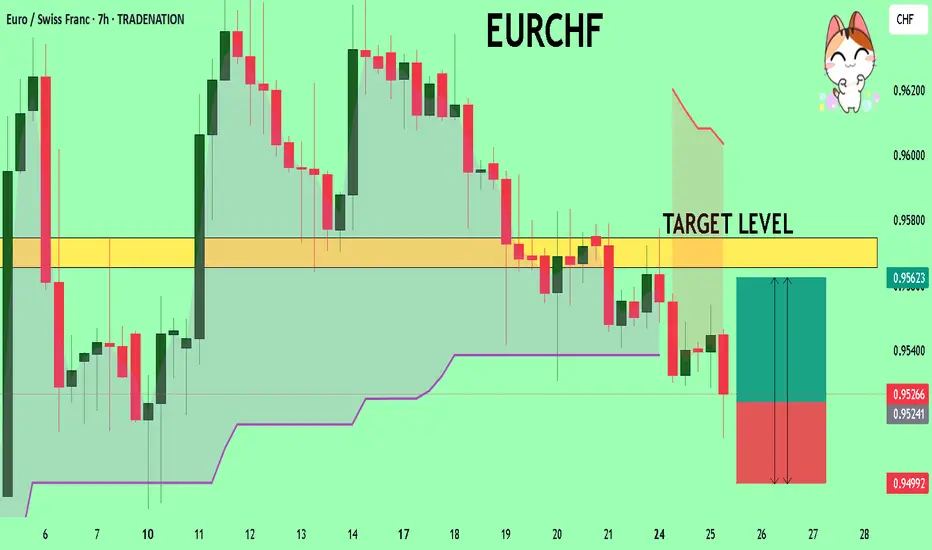
EURCHF support retest at 0.9530The EUR/CHF currency pair is showing a bullish sentiment, supported by the prevailing long-term uptrend. Recent intraday price action indicates a bullish breakout from a sideways consolidation phase, with the previous resistance now acting as a new support zone.
Key Support and Resistance Levels:
Support Zone: The critical support level to watch is 0.9530, representing the previous consolidation price range. A corrective pullback toward this level, followed by a bullish rebound, would confirm the continuation of the uptrend.
Upside Targets: If the pair sustains a bounce from 0.9530, it may aim for the next resistance at 0.9640, followed by 0.9665 and 0.9690 over the longer timeframe.
Bearish Scenario: A confirmed break and daily close below 0.9530 would negate the bullish outlook and increase the likelihood of further retracement. In this scenario, the pair could retest the 0.9500 support level, with further downside potential toward 0.9450.
Conclusion:
The bullish sentiment for EUR/CHF remains intact as long as the 0.9530 support holds. Traders should monitor the price action at this key level to assess potential buying opportunities. A successful bullish bounce from 0.9530 would favor long positions aiming for the specified upside targets. However, a break below 0.9530 would signal caution and increase the risk of a deeper pullback.
This communication is for informational purposes only and should not be viewed as any form of recommendation as to a particular course of action or as investment advice. It is not intended as an offer or solicitation for the purchase or sale of any financial instrument or as an official confirmation of any transaction. Opinions, estimates and assumptions expressed herein are made as of the date of this communication and are subject to change without notice. This communication has been prepared based upon information, including market prices, data and other information, believed to be reliable; however, Trade Nation does not warrant its completeness or accuracy. All market prices and market data contained in or attached to this communication are indicative and subject to change without notice.

EURGBP SELLTracking EUR/GBP on the 15-minute timeframe, we see a potential short opportunity from a key supply zone.
Key Zones & Setup:
🟣 Bearish Order Block (Supply Zone): 0.83800 - 0.83830
This area acted as strong resistance, where institutional traders likely positioned sell orders.
Expecting price to push into this zone before reversing lower.
Break of Structure (BOS) on lower timeframes (M5/M1) is needed for confirmation.
🔵 Target Area (Demand Zone): 0.83450
If the supply zone holds, price could drop toward this key demand level.
This zone aligns with previous BOS levels and price reactions.
Trade Plan:
📈 Waiting for price to push into the supply zone (0.83800 - 0.83830).
🔎 Looking for BOS on lower timeframes (M5/M1) before shorting.
✅ Entering a sell position upon confirmation.
🎯 Targeting the 0.83450 demand zone.
⚠️ Stop-loss above 0.83830 to manage risk.
Market Outlook:
If price fails to break structure, we avoid shorts and reassess.
This setup follows smart money concepts (SMC) with a focus on BOS and order blocks.
💬 What do you think? Are you seeing the same setup? 🚀🔥


Bears give the USD a break, EUR/USD pullback may not be overThe retracement higher for the US dollar is finally underway, which also shows further upside potential. And this is why I am wary of being long EUR/USD over the foreseeable future, even if I suspect it is poised to break to new highs in the coming weeks.
Matt Simpson, Market Analyst at City Index and Forex.com

Weekly Analysis for Week 13 2025!Hello fellow traders , my regular and new friends!
Did you managed to get some pips from EURUSD before the mid week reversal ?
Or did you catch some pips from EJ as well?
No? Missed out on it? No worries, check out my trading analysis for next week (week 13) to get some insights and tips for the potential moves in the Forex market!
Do Like and Boost if you have learnt something and enjoyed the content, thank you!
-- Get the right tools and an experienced Guide, you WILL navigate your way out of this "Dangerous Jungle"! --
*********************************************************************
Disclaimers:
The analysis shared through this channel are purely for educational and entertainment purposes only. They are by no means professional advice for individual/s to enter trades for investment or trading purposes.
*********************************************************************

Bearish reversal?EUR/NZD is rising towards the resistance level which is a pullback resistance that aligns with the 61.8% Fibonacci retracement and could reverse from this level to our take profit.
Entry: 1.89747
Why we like it:
There is a pullback resistance level that line sup with the 61.8% Fibonacci retracement.
Stop loss: 1.90810
Why we like it:
There is a pullback resistance level that lines up with he 78.6% Fibonacci retracement.
Take profit: 1.8743
Why we like it:
There is a pullback support level.
Enjoying your TradingView experience? Review us!
Please be advised that the information presented on TradingView is provided to Vantage (‘Vantage Global Limited’, ‘we’) by a third-party provider (‘Everest Fortune Group’). Please be reminded that you are solely responsible for the trading decisions on your account. There is a very high degree of risk involved in trading. Any information and/or content is intended entirely for research, educational and informational purposes only and does not constitute investment or consultation advice or investment strategy. The information is not tailored to the investment needs of any specific person and therefore does not involve a consideration of any of the investment objectives, financial situation or needs of any viewer that may receive it. Kindly also note that past performance is not a reliable indicator of future results. Actual results may differ materially from those anticipated in forward-looking or past performance statements. We assume no liability as to the accuracy or completeness of any of the information and/or content provided herein and the Company cannot be held responsible for any omission, mistake nor for any loss or damage including without limitation to any loss of profit which may arise from reliance on any information supplied by Everest Fortune Group.
