EUR | USD THE DOLLAR SHAKES, THE EURO DANCES with PipGuardEUR | USD THE DOLLAR SHAKES, THE EURO DANCES with PipGuard
IF YOU LIKE MY ANALYSIS, CONGRATS, YOU’RE SMART.
NOW HIT THAT FOLLOW BUTTON, DROP A BOOST, AND LEAVE A COMMENT.
Come on, don’t be shy, those buttons won’t wear out. Support free and independent analysis, because if you want me to keep dropping these market gems, you gotta show some love. Otherwise, you’ll see me opening a shaved ice stand. 🍧
GOOD MORNING, DEAR NON-FRIENDS!
Yeah, because if you were my friends, we’d be throwing death stares at each other by the coffee machine every time someone dared to question my analysis. But instead, here I am—calm, composed, and totally not petty.
Today, we’re talking about EUR/USD. But first, a challenge: SHOW ME ANOTHER ANALYSIS FROM NOVEMBER THAT'S STILL ACCURATE TODAY.
Go check the related article. Do yourself a favor, so maybe you’ll stop busting my chops at the coffee machine. Oh, by the way, got a spare euro? No? Alright, no analysis for you.
Just kidding, just kidding. I know you’re smart, humble, and definitely not thin-skinned… or at least, I hope so, otherwise, get ready for another lawsuit.
Anyway, let’s be clear—my analysis is NOT financial advice.
No, you don’t need to mortgage your house and bet it all. Also, let’s be real, you don’t even have one! 😆
LET’S GET TO THE POINT.
Back in November, I called the U.S. recession.
Guess who didn’t call me? Bloomberg.
Guess who did? An investment fund.
And guess how it went? Badly. My spoken English is worse than a drunk tourist trying to order a beer in a London pub, so I panicked and hung up. 📞❌
Unless you want to talk money 💰 or women 💃, don’t call me. Write me. But again—only for money or women, not for emotional support. I’m not your therapist.
EUROPE, REARMAMENT, AND THE CIRCUS OF POWER.
Same old show:
The tall blond guy with the orange face? Check.
The bald dude in the tie? Still there.
The political circus? In full swing. 🎭
But let’s cut to the chase: if you’re in the Eurozone, BUY A HOUSE.
I did— 180K for 122 square meters of prime real estate. Solid deal.
And why?
Because the euro is set to rise. 📈
Because Russia is in an economic lockdown.
Because when sanctions lift, we’ll likely see a mini Russian market collapse.
And the dollar? The U.S. is reliving 2008, but this time, it’s even dumber.
What’s different? Instead of subprime mortgages, now it’s credit card debt spiraling out of control.
Yes, you heard me. Americans are sinking their economy with loans for iPhones, 85-inch TVs, and vacations to Hawaii.
And banks?
“No worries, the debt is under control.”
Oh yeah? So if you’re 100K in debt for a house, that’s a crisis, but if you blow 100K on home decor and luxury junk, that’s fine? Make it make sense.
But who cares—I’m Italian, I eat pasta for breakfast. 🍝 Their problem, not mine.
NOW, THE TECHNICAL ANALYSIS.
Trend is BULLISH, get that in your head. Look for long setups, not shorts. If you must short, do it only for retracements.
Reversal zone: 1.082 – 1.095.
If it closes above, we keep going up.
Watch out for liquidity between 1.099 and 1.10.
If price gets there, look for a key level on the 4H. If it reacts bearish, wait for confirmation before shorting. If it closes above, we send it to 1.21.
Other key support levels:
1.076 – 1.062, solid area for bullish reaction.
If that’s not enough, 1.060 – 1.052 is the ultimate buy zone.
If you mess up, toss your PC. 💻🔥
Kidding. Hold on tight, because price is going up from there.
IF MY ANALYSIS HELPED YOU, HIT FOLLOW, DROP A BOOST, LEAVE A COMMENT.
Or else… I’ll have to come find you.
Much love, PipGuard.
EUR (Euro)

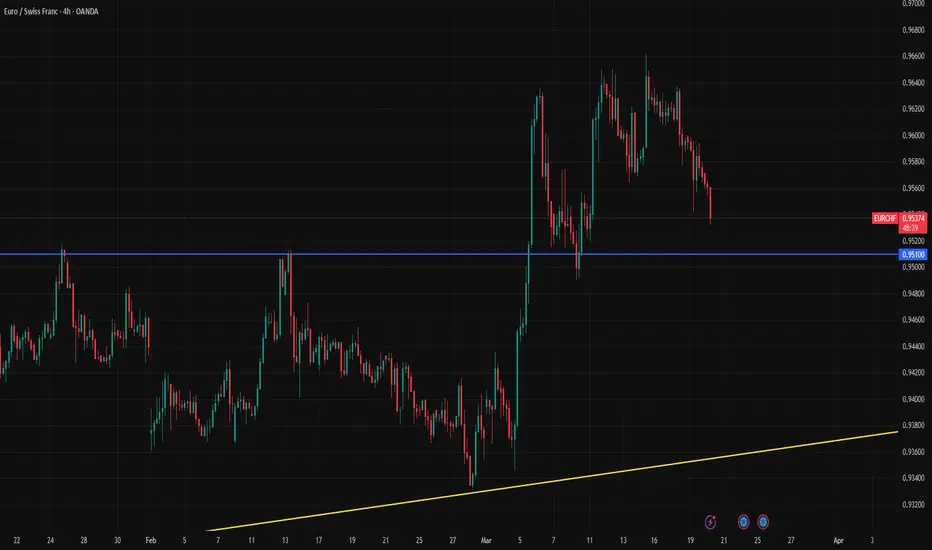
Watch Out for 0.9510 Support for EURCHFEURCHF is approaching the 0.9510 support level ahead of the SNB decision. Markets are currently pricing in a 25 basis point rate cut with a 68.1% probability. However, the recent relief in the Swiss franc may give the SNB reason to hold rates steady.
Our view is that the SNB will proceed with a 25 basis point cut today, and the 0.95–0.9510 support area is likely to hold. However, if this support zone breaks, it could trigger a medium-term selloff, potentially pushing EURCHF below 0.94.
Bearish drop?EUR/JPY is rising towards the pivot which is a pullback resistance and could drop to the 1st support.
Pivot: 162.24
1st Support: 160.36
1st Resistance: 164.02
Risk Warning:
Trading Forex and CFDs carries a high level of risk to your capital and you should only trade with money you can afford to lose. Trading Forex and CFDs may not be suitable for all investors, so please ensure that you fully understand the risks involved and seek independent advice if necessary.
Disclaimer:
The above opinions given constitute general market commentary, and do not constitute the opinion or advice of IC Markets or any form of personal or investment advice.
Any opinions, news, research, analyses, prices, other information, or links to third-party sites contained on this website are provided on an "as-is" basis, are intended only to be informative, is not an advice nor a recommendation, nor research, or a record of our trading prices, or an offer of, or solicitation for a transaction in any financial instrument and thus should not be treated as such. The information provided does not involve any specific investment objectives, financial situation and needs of any specific person who may receive it. Please be aware, that past performance is not a reliable indicator of future performance and/or results. Past Performance or Forward-looking scenarios based upon the reasonable beliefs of the third-party provider are not a guarantee of future performance. Actual results may differ materially from those anticipated in forward-looking or past performance statements. IC Markets makes no representation or warranty and assumes no liability as to the accuracy or completeness of the information provided, nor any loss arising from any investment based on a recommendation, forecast or any information supplied by any third-party.

Bearish reversal?EUR/GBP is rising towards the pivot and could reveres to the 1st support.
Pivot: 0.8401
1st Support: 0.8356
1st Resistance: 0.8444
Risk Warning:
Trading Forex and CFDs carries a high level of risk to your capital and you should only trade with money you can afford to lose. Trading Forex and CFDs may not be suitable for all investors, so please ensure that you fully understand the risks involved and seek independent advice if necessary.
Disclaimer:
The above opinions given constitute general market commentary, and do not constitute the opinion or advice of IC Markets or any form of personal or investment advice.
Any opinions, news, research, analyses, prices, other information, or links to third-party sites contained on this website are provided on an "as-is" basis, are intended only to be informative, is not an advice nor a recommendation, nor research, or a record of our trading prices, or an offer of, or solicitation for a transaction in any financial instrument and thus should not be treated as such. The information provided does not involve any specific investment objectives, financial situation and needs of any specific person who may receive it. Please be aware, that past performance is not a reliable indicator of future performance and/or results. Past Performance or Forward-looking scenarios based upon the reasonable beliefs of the third-party provider are not a guarantee of future performance. Actual results may differ materially from those anticipated in forward-looking or past performance statements. IC Markets makes no representation or warranty and assumes no liability as to the accuracy or completeness of the information provided, nor any loss arising from any investment based on a recommendation, forecast or any information supplied by any third-party.


EURUSD: Big Bearish Divergence on 4H.EURUSD is bullish on its 1D technical outlook (RSI = 66.538, MACD = -0.013, ADX = 29.911) but just crossed under the 4H MA50 for the first time since the March 3rd 2025 breakout when the parabolic rally started. The strongest sell signal is nonetheless given by the 4H RSI which, while the price is on a Channel Up, it has been on a Channel Down, i.e. a Bearish Divergence. The previous time an uptrend broke below its 4H MA50 on the same RSI Bearish Divergence was on the September 30th 2024 High. The result was a strong bearish breakdown to the S1 level. Consequently, we can turn bearish here and aim a little higher than S1 (TP = 1.0400).
## If you like our free content follow our profile to get more daily ideas. ##
## Comments and likes are greatly appreciated. ##

Ethereum (ETH/USD) Breakout – Next Targets $2,328 & Beyond!
Overview:
Ethereum has been in a downtrend, forming a descending channel, but it recently found strong support at $1,764 and has now broken out of a range-bound consolidation. This could be the beginning of a bullish move towards higher resistance levels.
Key Market Structure Analysis:
🔸 Previous Downtrend: ETH was trading within a bearish channel, creating lower highs and lower lows before bottoming out.
🔸 Accumulation Phase: A sideways consolidation range between $1,764 - $2,017 formed after the downtrend, signaling potential accumulation.
🔸 Breakout Confirmation: ETH has broken above the $2,017 resistance, suggesting that buyers are stepping in.
Potential Trade Setup:
✅ Bullish Scenario:
A successful breakout retest around $2,000 - $1,950 could provide an entry opportunity.
Upside targets:
🎯 $2,328.95 – Major resistance level from previous price action.
🎯 $2,559.17 – Next key resistance if momentum continues.
⚠️ Bearish Scenario (Invalidation):
A drop below $1,950 - $1,900 could push ETH back into the previous range.
Losing the $1,764 support could lead to a retest of $1,600 or lower.
Final Thoughts:
Ethereum is showing strength after breaking out of a key consolidation range. If the breakout holds, ETH could be gearing up for a strong rally toward $2,328 - $2,559. However, a retest of the breakout zone may provide a better risk-to-reward entry.
What do you think? Will ETH push toward $2,328 next? Drop your thoughts below! 🔥📈

Bullish momentum to extend?EUR/JPY is falling towards the pivot which has been identified as a pullback support and could bounce to the 1st resistance which is a pullback resistance.
Pivot: 162.21
1st Support: 160.29
1st Resistance: 164.35
Risk Warning:
Trading Forex and CFDs carries a high level of risk to your capital and you should only trade with money you can afford to lose. Trading Forex and CFDs may not be suitable for all investors, so please ensure that you fully understand the risks involved and seek independent advice if necessary.
Disclaimer:
The above opinions given constitute general market commentary, and do not constitute the opinion or advice of IC Markets or any form of personal or investment advice.
Any opinions, news, research, analyses, prices, other information, or links to third-party sites contained on this website are provided on an "as-is" basis, are intended only to be informative, is not an advice nor a recommendation, nor research, or a record of our trading prices, or an offer of, or solicitation for a transaction in any financial instrument and thus should not be treated as such. The information provided does not involve any specific investment objectives, financial situation and needs of any specific person who may receive it. Please be aware, that past performance is not a reliable indicator of future performance and/or results. Past Performance or Forward-looking scenarios based upon the reasonable beliefs of the third-party provider are not a guarantee of future performance. Actual results may differ materially from those anticipated in forward-looking or past performance statements. IC Markets makes no representation or warranty and assumes no liability as to the accuracy or completeness of the information provided, nor any loss arising from any investment based on a recommendation, forecast or any information supplied by any third-party.

Bearish drop?EUR/NZD is rising towards the pivot and could drop to the 50% Fibonacci support.
Pivot: 1.88686
1st Support: 1.86727
1st Resistance: 1.89710
Risk Warning:
Trading Forex and CFDs carries a high level of risk to your capital and you should only trade with money you can afford to lose. Trading Forex and CFDs may not be suitable for all investors, so please ensure that you fully understand the risks involved and seek independent advice if necessary.
Disclaimer:
The above opinions given constitute general market commentary, and do not constitute the opinion or advice of IC Markets or any form of personal or investment advice.
Any opinions, news, research, analyses, prices, other information, or links to third-party sites contained on this website are provided on an "as-is" basis, are intended only to be informative, is not an advice nor a recommendation, nor research, or a record of our trading prices, or an offer of, or solicitation for a transaction in any financial instrument and thus should not be treated as such. The information provided does not involve any specific investment objectives, financial situation and needs of any specific person who may receive it. Please be aware, that past performance is not a reliable indicator of future performance and/or results. Past Performance or Forward-looking scenarios based upon the reasonable beliefs of the third-party provider are not a guarantee of future performance. Actual results may differ materially from those anticipated in forward-looking or past performance statements. IC Markets makes no representation or warranty and assumes no liability as to the accuracy or completeness of the information provided, nor any loss arising from any investment based on a recommendation, forecast or any information supplied by any third-party.

Bearish reversal off pullback resistance?EUR/NOK is rising towards the pivot which has been identified as a pullback resistance and could reverse to the 1st support.
Pivot: 11.58898
1st Support: 11.49442
1st Resistance: 11.63625
Risk Warning:
Trading Forex and CFDs carries a high level of risk to your capital and you should only trade with money you can afford to lose. Trading Forex and CFDs may not be suitable for all investors, so please ensure that you fully understand the risks involved and seek independent advice if necessary.
Disclaimer:
The above opinions given constitute general market commentary, and do not constitute the opinion or advice of IC Markets or any form of personal or investment advice.
Any opinions, news, research, analyses, prices, other information, or links to third-party sites contained on this website are provided on an "as-is" basis, are intended only to be informative, is not an advice nor a recommendation, nor research, or a record of our trading prices, or an offer of, or solicitation for a transaction in any financial instrument and thus should not be treated as such. The information provided does not involve any specific investment objectives, financial situation and needs of any specific person who may receive it. Please be aware, that past performance is not a reliable indicator of future performance and/or results. Past Performance or Forward-looking scenarios based upon the reasonable beliefs of the third-party provider are not a guarantee of future performance. Actual results may differ materially from those anticipated in forward-looking or past performance statements. IC Markets makes no representation or warranty and assumes no liability as to the accuracy or completeness of the information provided, nor any loss arising from any investment based on a recommendation, forecast or any information supplied by any third-party.

EUR_CHF BEARISH BREAKOUT|SHORT|
✅EUR_CHF broke out
Of the bearish wedge pattern
So we are locally bearish
Biased and we will be
Expecting a further
Bearish move down
SHORT🔥
✅Like and subscribe to never miss a new idea!✅
Disclosure: I am part of Trade Nation's Influencer program and receive a monthly fee for using their TradingView charts in my analysis.

#EURCHF 4HEURCHF (4H Timeframe) Analysis
Market Structure:
The price is currently testing a well-established trendline resistance, which has previously acted as a barrier for upward movement. Sellers have shown strong presence at this level, leading to potential downside pressure.
Forecast:
A sell opportunity may emerge if the price faces rejection at the trendline resistance and forms bearish confirmation. If the resistance holds, the market may continue its downward movement.
Key Levels to Watch:
- Entry Zone: Selling near the trendline resistance after confirmation of rejection.
- Risk Management:
- Stop Loss: Placed above the trendline resistance to minimize risk.
- Take Profit: Target lower support zones or previous swing lows.
Market Sentiment:
If the price remains below the trendline resistance, the bearish outlook stays valid. However, a breakout above this level could shift sentiment toward further bullish movement.

EURNZD Bearish Trend Structure Indicates Potential ContinuationH1 - Bearish trend pattern
Strong bearish momentum
Potential drop if the resistance levels will not be broken.
If you enjoy this idea, don’t forget to LIKE 👍, FOLLOW ✅, SHARE 🙌, and COMMENT ✍! Drop your thoughts and charts below to keep the discussion going. Your support helps keep this content free and reach more people! 🚀
Disclosure: I am part of Trade Nation's Influencer program and receive a monthly fee for using their TradingView charts in my analysis.

EURCHF My Opinion! BUY!
My dear followers,
This is my opinion on the EURCHF next move:
The asset is approaching an important pivot point 0.9588
Bias - Bullish
Technical Indicators: Supper Trend generates a clear long signal while Pivot Point HL is currently determining the overall Bullish trend of the market.
Goal - 0.9605
About Used Indicators:
For more efficient signals, super-trend is used in combination with other indicators like Pivot Points.
———————————
WISH YOU ALL LUCK

EURCHF Bullish Breakout supported at 0.9530The EUR/CHF currency pair is showing a bullish sentiment, supported by the prevailing long-term uptrend. Recent intraday price action indicates a bullish breakout from a sideways consolidation phase, with the previous resistance now acting as a new support zone.
Key Support and Resistance Levels:
Support Zone: The critical support level to watch is 0.9530, representing the previous consolidation price range. A corrective pullback toward this level, followed by a bullish rebound, would confirm the continuation of the uptrend.
Upside Targets: If the pair sustains a bounce from 0.9530, it may aim for the next resistance at 0.9640, followed by 0.9665 and 0.9690 over the longer timeframe.
Bearish Scenario: A confirmed break and daily close below 0.9530 would negate the bullish outlook and increase the likelihood of further retracement. In this scenario, the pair could retest the 0.9500 support level, with further downside potential toward 0.9450.
Conclusion:
The bullish sentiment for EUR/CHF remains intact as long as the 0.9530 support holds. Traders should monitor the price action at this key level to assess potential buying opportunities. A successful bullish bounce from 0.9530 would favor long positions aiming for the specified upside targets. However, a break below 0.9530 would signal caution and increase the risk of a deeper pullback.
This communication is for informational purposes only and should not be viewed as any form of recommendation as to a particular course of action or as investment advice. It is not intended as an offer or solicitation for the purchase or sale of any financial instrument or as an official confirmation of any transaction. Opinions, estimates and assumptions expressed herein are made as of the date of this communication and are subject to change without notice. This communication has been prepared based upon information, including market prices, data and other information, believed to be reliable; however, Trade Nation does not warrant its completeness or accuracy. All market prices and market data contained in or attached to this communication are indicative and subject to change without notice.

Euro will rebound from support area and continue to move upHello traders, I want share with you my opinion about Euro. This chart illustrates how the price entered an upward channel and immediately broke below the 1.0500 support level. After trading for some time within the buyer zone, it dropped to the support line. Following this move, the Euro reversed and started climbing, eventually reaching the 1.0500 level again, breaking above it, and making a retest. The price then continued to rise and later reached the current support level, which coincided with the support area and the channel's trend line, where it traded for a while. Soon after, the Euro broke through the 1.0805 level and remained within the support area for an extended period before climbing to 1.0945. At that point, it reversed and started declining. The Euro quickly dropped to the support line of the channel and then bounced back up. However, it recently fell again to the support line of the channel, where it has been gradually moving higher since. Given this setup, I expect the Euro to decline to the support area before rebounding and continuing its upward movement within the channel. Based on this, my TP is set at 1.1150. Please share this idea with your friends and click Boost 🚀

EURNZD BUY 4H
Hello, I am Forex Trader Andrea Russo and today I want to talk to you about a promising strategy for the EURNZD currency cross.
The EURNZD is showing interesting signals for an upward movement. I decided to open a long position at 1.87460, with a stop loss (SL) at 1.861, which represents a potential loss of 0.50%. The profit target (TP) is set at 1.913, aiming for a consistent uptrend.
Technical Analysis
The EURNZD is going through a consolidation phase, offering a breakout opportunity to the upside. Technical indicators such as the MACD and the RSI indicate a growing bullish momentum. Furthermore, the price is positioning itself above the key moving averages, a sign of strength that supports my buy strategy.
Fundamental Analysis
On a fundamental level, the euro is benefiting from an improved economic environment in the Eurozone, along with a relatively stable monetary policy from the ECB. Conversely, the New Zealand dollar could be negatively affected by the recent volatility in the commodity markets, given the New Zealand economy's link to this sector.
Trading Strategy
Entry: 1.87460
Stop Loss: 1.861 (-0.50%)
Take Profit: 1.913
This setup offers a favorable risk/reward ratio and aligns with the current technical and fundamental environment. I recommend closely monitoring any changes in fundamentals or key technical levels that could impact the trade.

EUR/GBP Bullish Flag (18.3.25)The EUR/GBP pair on the M30 timeframe presents a Potential Buying Opportunity due to a recent Formation of a Bullish Flag Pattern. This suggests a shift in momentum towards the upside and a higher likelihood of further advances in the coming hours.
Possible Long Trade:
Entry: Consider Entering A Long Position around Trendline Of The Pattern.
Target Levels:
1st Resistance – 0.8433
2nd Resistance – 0.8448
🎁 Please hit the like button and
🎁 Leave a comment to support for My Post !
Your likes and comments are incredibly motivating and will encourage me to share more analysis with you.
Best Regards, KABHI_TA_TRADING
Thank you.

EURCHF is starting to turn upLooks like a trend reversal at last.
1. Strong pinbars from the levels below 0.92 that rob the stops.
2. A broken trend line, higher lows, higher highs
3. it is currently at a very important level,we are watching how it will react and whether it will be overcome.
4. We are now long on a larger time frame.

Weekly Analysis for Week 12 2025!Hello fellow traders , my regular and new friends!
How was your trading this week? Managed to catch the Eurjpy or GbpCad and EurCad movements as mentioned last week?
Which pairs or instruments should we keep a look out for?
This coming week is packed with interest rate decision, how?What to do?
Do check out my recorded video for more insights!
Do Like and Boost if you have learnt something and enjoyed the content, thank you!
-- Get the right tools and an experienced Guide, you WILL navigate your way out of this "Dangerous Jungle"! --
*********************************************************************
Disclaimers:
The analysis shared through this channel are purely for educational and entertainment purposes only. They are by no means professional advice for individual/s to enter trades for investment or trading purposes.
*********************************************************************

EUR-CHF Bearish Wedge Pattern! Sell!
Hello,Traders!
EUR-CHF was trading in an
Uptrend but the pair has formed
A bearish wedge pattern so
IF we see a bearish breakout
From the wedge we will be
Expecting a bearish move down
Sell!
Comment and subscribe to help us grow!
Check out other forecasts below too!
Disclosure: I am part of Trade Nation's Influencer program and receive a monthly fee for using their TradingView charts in my analysis.

Could the price bounce from here?EUR/CAD is falling towards the support level which is an overlap support that is slightly above the 38.2% Fibonacci retracement and also slightly below the 61.8% Fibonacci projection and could bounce from this level to our take profit.
Entry: 1.5548
Why we like it:
There is an overlap support level that is slightly above the 38.2% Fibonacci retracement.
Stop loss: 1.5415
Why we like it:
There is a pullback support level that lines up with the 50% Fibonacci retracement.
Take profit: 1.5697
Why we like it:
There is a pullback resistance level.
Enjoying your TradingView experience? Review us!
Please be advised that the information presented on TradingView is provided to Vantage (‘Vantage Global Limited’, ‘we’) by a third-party provider (‘Everest Fortune Group’). Please be reminded that you are solely responsible for the trading decisions on your account. There is a very high degree of risk involved in trading. Any information and/or content is intended entirely for research, educational and informational purposes only and does not constitute investment or consultation advice or investment strategy. The information is not tailored to the investment needs of any specific person and therefore does not involve a consideration of any of the investment objectives, financial situation or needs of any viewer that may receive it. Kindly also note that past performance is not a reliable indicator of future results. Actual results may differ materially from those anticipated in forward-looking or past performance statements. We assume no liability as to the accuracy or completeness of any of the information and/or content provided herein and the Company cannot be held responsible for any omission, mistake nor for any loss or damage including without limitation to any loss of profit which may arise from reliance on any information supplied by Everest Fortune Group.

EURNZD Potential declineHello traders, we have a downward wave and a correction pattern. Another downward wave is expected.
