EURUSD Long As the war escalated over the weekend market gapped during Asia session invalidating our initial forecast. (Linked Idea). Looking for the long on EURUSD.
EUR (Euro)

EURJPY - Over-Bought Big Time!Hello TradingView Family / Fellow Traders. This is Richard, also known as theSignalyst.
📈EURJPY has been overall bullish trading within the rising channel marked in blue. However, it is currently retesting the upper bound of the channel.
Moreover, the green zone is a major weekly supply.
🏹 Thus, the highlighted red circle is a strong area to look for sell setups as it is the intersection of the upper blue trendline and weekly supply.
📚 As per my trading style:
As #EURJPY approaches the red circle zone, I will be looking for bearish reversal setups (like a double top pattern, trendline break , and so on...)
📚 Always follow your trading plan regarding entry, risk management, and trade management.
Good luck!
All Strategies Are Good; If Managed Properly!
~Rich
Disclosure: I am part of Trade Nation's Influencer program and receive a monthly fee for using their TradingView charts in my analysis.

EUR/CHF SHORT FROM RESISTANCE
Hello, Friends!
We are going short on the EUR/CHF with the target of 0.938 level, because the pair is overbought and will soon hit the resistance line above. We deduced the overbought condition from the price being near to the upper BB band. However, we should use low risk here because the 1W TF is green and gives us a counter-signal.
Disclosure: I am part of Trade Nation's Influencer program and receive a monthly fee for using their TradingView charts in my analysis.
✅LIKE AND COMMENT MY IDEAS✅

EUR/NZD Breakout Done , Long Setup Valid To Get 250 Pips !Here is my EUR/NZD 4H Chart and my opinion is we have now a very good breakout after a lot of time in sideway so we can buy this pair if the price go back to retest the broken res and new support , so we should wait the price to go back to retest it and if we have a good bullish price action then we will enter a buy trade and targeting a new high .

EURCHF Analysis – “Euro Inches Higher, But Safe-Haven CHF LurksEURCHF is breaking out from a symmetrical triangle, indicating potential bullish momentum.
Key resistances to watch:
0.9445 – local swing high
0.9498 – potential measured target from the triangle breakout
Entry on retest of the triangle may offer a favorable risk-reward opportunity.
However, upside could be capped if CHF regains strength.
Structure Bias: Bullish breakout, confirmation needed with a clean retest and sustained move above 0.9440
📊 Current Bias: Cautiously Bullish
🧩 Key Fundamentals Driving EURCHF
EUR Side (Neutral to Slightly Bearish):
ECB remains cautious: June’s Economic Bulletin showed soft patches in core inflation and weak consumer activity.
German & French PMIs are mixed; services weaker than expected.
Political uncertainty (France snap elections) weighs on EUR sentiment in the medium term.
CHF Side (Fundamentally Stronger):
SNB is cautious but hawkish: Monetary policy assessment showed a steady hand, maintaining rates with no clear signal of easing.
Safe-haven flows persist due to:
Middle East risk (Israel–Iran escalation)
Russia–Ukraine tensions
Weak equity sentiment
CHF remains supported on global risk aversion, even with SNB standing pat.
⚠️ Risks That May Reverse or Accelerate Trend
Breakout fails to hold → Bearish fakeout leads to drop toward 0.9290 again
Renewed CHF strength from geopolitical shocks
Eurozone political turbulence (especially France & ECB doves)
🗓️ Important News to Watch
🇨🇭 Swiss CPI, SNB statements
🇪🇺 Eurozone PMI Flash (June 21), CPI (June 28), and political updates
Global market risk sentiment (VIX, bonds, oil, Iran/Israel news)
🏁 Which Asset Might Lead the Broader Move?
EURCHF is lagging behind EURUSD and USDCHF, but provides clean geopolitical risk signals. If markets stabilize, this pair has upside potential. However, if fear returns, CHF may quickly regain control, trapping long trades.

Bearish reversal?EUR/USD is rising towards the resistance level which is a pullback resistance that lines up with the 61.8% Fibonacci retracement and could reverse from this level to our take profit.
Entry: 1.1555
Why we like it:
There is a pullback resistance that lines up with the 61.8% Fibonacci retracement.
Stop loss: 1.1608
Why we like it:
There is a pullback resistance.
Take profit: 1.1483
Why we like it:
There is a pullback support level that aligns with the 61.8% Fibonacci retracement.
Enjoying your TradingView experience? Review us!
Please be advised that the information presented on TradingView is provided to Vantage (‘Vantage Global Limited’, ‘we’) by a third-party provider (‘Everest Fortune Group’). Please be reminded that you are solely responsible for the trading decisions on your account. There is a very high degree of risk involved in trading. Any information and/or content is intended entirely for research, educational and informational purposes only and does not constitute investment or consultation advice or investment strategy. The information is not tailored to the investment needs of any specific person and therefore does not involve a consideration of any of the investment objectives, financial situation or needs of any viewer that may receive it. Kindly also note that past performance is not a reliable indicator of future results. Actual results may differ materially from those anticipated in forward-looking or past performance statements. We assume no liability as to the accuracy or completeness of any of the information and/or content provided herein and the Company cannot be held responsible for any omission, mistake nor for any loss or damage including without limitation to any loss of profit which may arise from reliance on any information supplied by Everest Fortune Group.

EUR_NZD WILL KEEP GROWING|LONG|
✅EUR_NZD is going up
Now and the pair made a bullish
Breakout of the key horizontal
Level of 1.9250 and the breakout
Is confirmed so we are bullish
Biased and we will be expecting
A further bullish move up on Monday
LONG🚀
✅Like and subscribe to never miss a new idea!✅
Disclosure: I am part of Trade Nation's Influencer program and receive a monthly fee for using their TradingView charts in my analysis.

EUR_CHF CORRECTION AHEAD|SHORT|
✅EUR_CHF is set to retest a
Strong resistance level above at 0.9446
After trading in a local uptrend for some time
Which makes a bearish pullback a likely scenario
With the target being a local support below at 0.9410
SHORT🔥
✅Like and subscribe to never miss a new idea!✅
Disclosure: I am part of Trade Nation's Influencer program and receive a monthly fee for using their TradingView charts in my analysis.

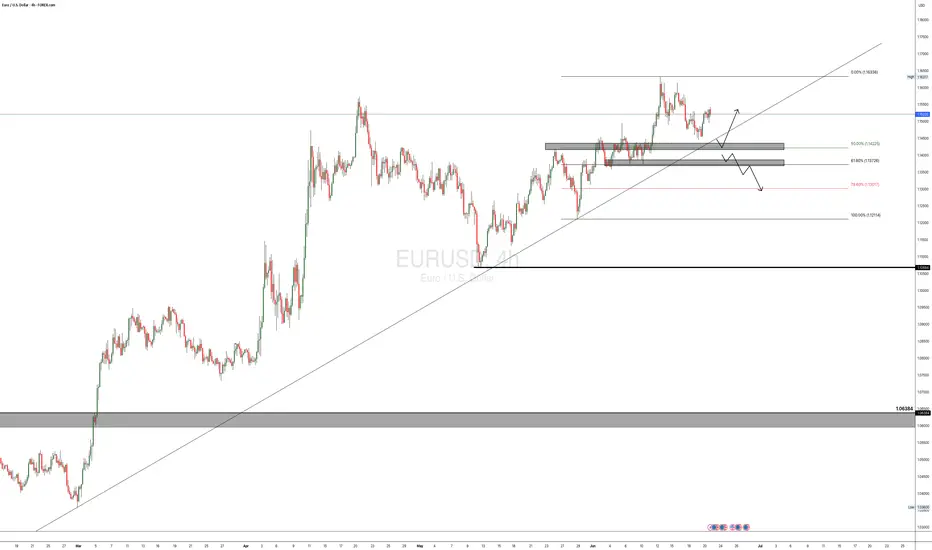
EURUSD POSSIBLE TRADE SETUP💶 Potential Trade Setup on EURUSD
Overview:
Since March, EURUSD has shown consistent bullish momentum, especially after breaking through the key 1.0600 supply zone.
The pair has maintained higher highs and higher lows, suggesting continued strength in the medium term.
That said, I am still quite anticipating for a possible continuation of the bullish momentum that started a long time ago, and moving forward, I will anticipate for a clear retest of the 50% fib at the 1.1425 region, then I go in for the kill.
Alternatively, there is a clear short opportunity, provided that, the bullish trendline is broken and the 1.1370 region is broken to the downside, this is a bit far a stretch, but it is in play. "IF" the DXY keeps the bullish momentum going.
🧭 Trading Plan:
✅ BUY Bias (Primary Plan):
Look for a retest of the 50% Fibonacci retracement zone around 1.1425. This aligns with the ongoing momentum on the 4H timeframe.
🔻 SELL Bias (Alternative Scenario):
If price breaks the bullish trendline and the 1.1370 support zone, a short opportunity opens up.
This is only valid if DXY continues to strengthen, shifting sentiment.
🎯 Targets & Risk Management: Targeting 1:2 R:R on both setups.
Ensure entries are backed by price action signals and confluences.
EUR/USD - H4 - Triangle Formation (31.05.2025)The EUR/USD pair on the H4 timeframe presents a recent Formation of a Triangle Pattern.
1. Wait for Breakout with Good Volume
2. Conformation in short Timeframe Must
🎁 Please hit the like button and
🎁 Leave a comment to support for My Post !
Fundamental Updates :
Dollar mixed on tariff uncertainty, U.S. President Donald Trump to battle a U.S. trade court ruling that blocked most of his proposed tariffs.
Your likes and comments are incredibly motivating and will encourage me to share more analysis with you.
Best Regards, KABHI_TA_TRADING
Thank you.
Disclosure: I am part of Trade Nation's Influencer program and receive a monthly fee for using their TradingView charts in my analysis.

EUR-NZD Bullish Breakout! Buy!
Hello,Traders!
EUR-NZD keeps growing and
The pair made a bullish breakout
Of the key horizontal level
Of 1.9270 and the breakout
Is confirmed so we are bullish
Biased and we will be
Expecting a further move up
Buy!
Comment and subscribe to help us grow!
Check out other forecasts below too!
Disclosure: I am part of Trade Nation's Influencer program and receive a monthly fee for using their TradingView charts in my analysis.

EUR-CHF Resistance Ahead! Sell!
Hello,Traders!
EUR-CHF keeps growing
But a strong horizontal
Resistance level is ahead
Around 0.9443 so after
The retest we will be
Expecting a local pullback
And a local bearish correction
Sell!
Comment and subscribe to help us grow!
Check out other forecasts below too!
Disclosure: I am part of Trade Nation's Influencer program and receive a monthly fee for using their TradingView charts in my analysis.

EUR/CHF Parallel Channel Breakout WatchThe EUR/CHF pair has been trading within a well-defined parallel channel on the 1-hour timeframe. The price action is contained between a strong resistance zone near 0.9420–0.9425 (marked in red) and a support zone near 0.9365–0.9370 (marked in green). Multiple rejections from both the top and bottom of the range indicate solid market structure and participation from both buyers and sellers.
This type of formation often leads to explosive moves when the price eventually breaks out of the consolidation range. The current chart shows price testing the upper boundary of the channel once again, and now attempting a bullish breakout.
📈 Bullish Breakout Scenario
If the price sustains above the resistance zone (confirmed breakout), we could see a continuation of bullish momentum toward the projected breakout target near 0.9475. This target is calculated using the height of the channel added to the breakout level, a classic price projection method. A strong candle close above the resistance with volume would validate this move. Traders may look for long entries on breakout confirmation or on a successful retest of the resistance zone as new support.
📉 Bearish Reversal Scenario
However, if the breakout fails and price gets rejected again from the red zone, a sharp reversal back toward the support zone around 0.9370 may occur. This would keep the channel intact and suggest continued range-bound movement. A breakdown below support would then be required for further bearish confirmation, leading toward deeper downside targets.
This setup provides a high-probability opportunity in either direction with clearly defined levels and structure. Wait for breakout confirmation before entering to avoid false moves.
=================================================================
Disclosure: I am part of Trade Nation's Influencer program and receive a monthly fee for using their TradingView charts in my analysis.
=================================================================

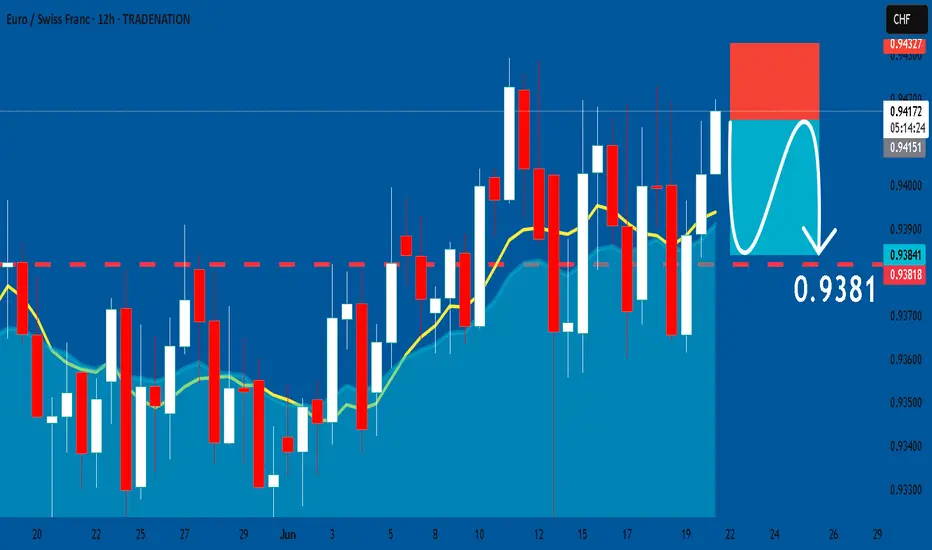
EURCHF: Bearish Continuation & Short Trade
EURCHF
- Classic bearish setup
- Our team expects bearish continuation
SUGGESTED TRADE:
Swing Trade
Short EURCHF
Entry Point - 0.9414
Stop Loss - 0.9432
Take Profit - 0.9381
Our Risk - 1%
Start protection of your profits from lower levels
Disclosure: I am part of Trade Nation's Influencer program and receive a monthly fee for using their TradingView charts in my analysis.
❤️ Please, support our work with like & comment! ❤️
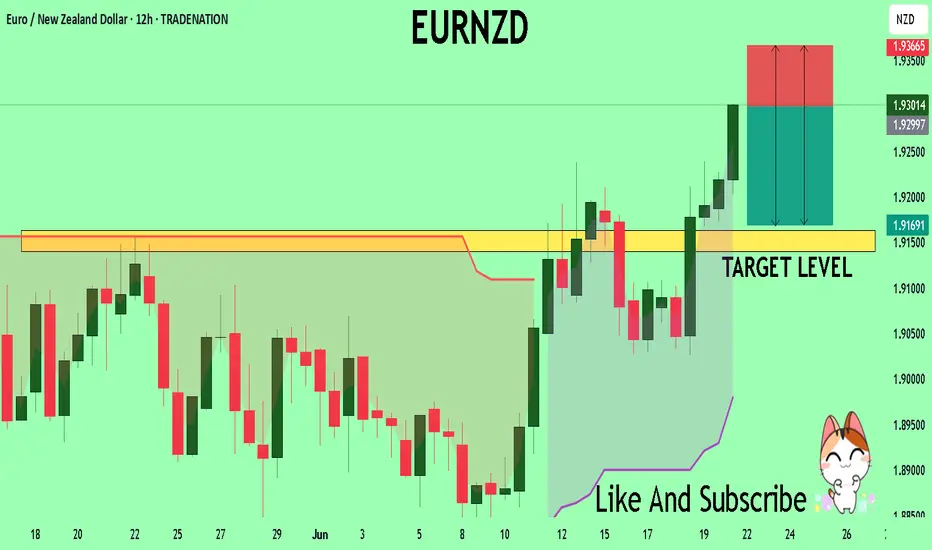
EURNZD Buyers In Panic! SELL!
My dear friends,
EURNZD looks like it will make a good move, and here are the details:
The market is trading on 1.9299 pivot level.
Bias - Bearish
Technical Indicators: Supper Trend generates a clear short signal while Pivot Point HL is currently determining the overall Bearish trend of the market.
Goal - 1.9163
Recommended Stop Loss - 1.9366
About Used Indicators:
Pivot points are a great way to identify areas of support and resistance, but they work best when combined with other kinds of technical analysis
Disclosure: I am part of Trade Nation's Influencer program and receive a monthly fee for using their TradingView charts in my analysis.
———————————
WISH YOU ALL LUCK
EUR/NZD SENDS CLEAR BEARISH SIGNALS|SHORT
EUR/NZD SIGNAL
Trade Direction: short
Entry Level: 1.922
Target Level: 1.899
Stop Loss: 1.938
RISK PROFILE
Risk level: medium
Suggested risk: 1%
Timeframe: 12h
Disclosure: I am part of Trade Nation's Influencer program and receive a monthly fee for using their TradingView charts in my analysis.
✅LIKE AND COMMENT MY IDEAS✅

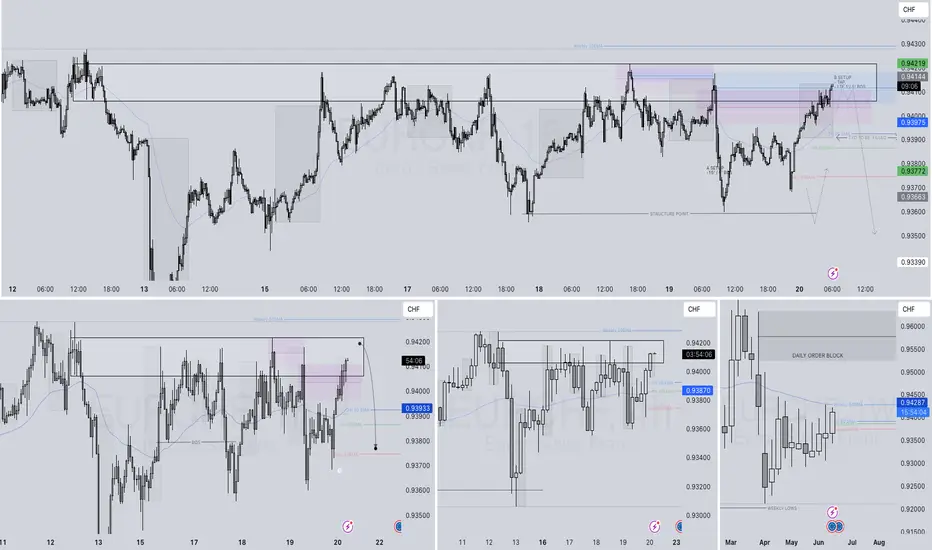
EURCHF SHORT FORECAST Q2 W25 D20 Y25EURCHF SHORT FORECAST Q2 W25 D20 Y25
Professional Risk Managers👋
Welcome back to another FRGNT chart update📈
Diving into some Forex setups using predominantly higher time frame order blocks alongside confirmation breaks of structure.
Let’s see what price action is telling us today! 👀
💡Here are some trade confluences📝
✅Weekly 50EMA Rejection
✅15' Order block
✅1H Order Block
✅4H Highs
🔑 Remember, to participate in trading comes always with a degree of risk, therefore as professional risk managers it remains vital that we stick to our risk management plan as well as our trading strategies.
📈The rest, we leave to the balance of probabilities.
💡Fail to plan. Plan to fail.
🏆It has always been that simple.
❤️Good luck with your trading journey, I shall see you at the very top.
🎯Trade consistent, FRGNT X
EURUSD SHORT FORECAST Q2 W25 D20 Y25EURUSD SHORT FORECAST Q2 W25 D20 Y25
Professional Risk Managers👋
Welcome back to another FRGNT chart update📈
Diving into some Forex setups using predominantly higher time frame order blocks alongside confirmation breaks of structure.
Let’s see what price action is telling us today!
💡Here are some trade confluences📝
✅Weekly order block rejection
✅15' order block
✅4 hour order block identified
✅Tokyo ranges to be filled
🔑 Remember, to participate in trading comes always with a degree of risk, therefore as professional risk managers it remains vital that we stick to our risk management plan as well as our trading strategies.
📈The rest, we leave to the balance of probabilities.
💡Fail to plan. Plan to fail.
🏆It has always been that simple.
❤️Good luck with your trading journey, I shall see you at the very top.
🎯Trade consistent, FRGNT X

Bullish bounce off pullback support?The Fiber (EUR/USD) has bounced off the pivot and could rise to the 1st resistance.
Pivot: 1.1444
1st Support: 1.1369
1st Resistance: 1.1587
Risk Warning:
Trading Forex and CFDs carries a high level of risk to your capital and you should only trade with money you can afford to lose. Trading Forex and CFDs may not be suitable for all investors, so please ensure that you fully understand the risks involved and seek independent advice if necessary.
Disclaimer:
The above opinions given constitute general market commentary, and do not constitute the opinion or advice of IC Markets or any form of personal or investment advice.
Any opinions, news, research, analyses, prices, other information, or links to third-party sites contained on this website are provided on an "as-is" basis, are intended only to be informative, is not an advice nor a recommendation, nor research, or a record of our trading prices, or an offer of, or solicitation for a transaction in any financial instrument and thus should not be treated as such. The information provided does not involve any specific investment objectives, financial situation and needs of any specific person who may receive it. Please be aware, that past performance is not a reliable indicator of future performance and/or results. Past Performance or Forward-looking scenarios based upon the reasonable beliefs of the third-party provider are not a guarantee of future performance. Actual results may differ materially from those anticipated in forward-looking or past performance statements. IC Markets makes no representation or warranty and assumes no liability as to the accuracy or completeness of the information provided, nor any loss arising from any investment based on a recommendation, forecast or any information supplied by any third-party.

EUR_NZD SHORT FROM RESISTANCE|
✅EUR_NZD is going up now
But a strong resistance level is ahead at 1.9266
Thus I am expecting a pullback
And a move down towards the target of 1.9150
SHORT🔥
✅Like and subscribe to never miss a new idea!✅
Disclosure: I am part of Trade Nation's Influencer program and receive a monthly fee for using their TradingView charts in my analysis.

Bullish bounce?EUR/USD is falling towards the support level which is a pullback support that lines up with the 71% Fibonacci retracement and could rise from this level to our take profit.
Entry: 1.1445
Why we like it:
There is a pullback support level that aligns with the 71% Fibonacci retracement.
Stop loss: 1.1386
Why we like it:
There is a pullback support level that is slightly above the 61.8% Fibonacci retracement.
Take profit:1.1514
Why we like it:
There is an overlap resistance level that lines up with the 38.2% Fibonacci retracement.
Enjoying your TradingView experience? Review us!
Please be advised that the information presented on TradingView is provided to Vantage (‘Vantage Global Limited’, ‘we’) by a third-party provider (‘Everest Fortune Group’). Please be reminded that you are solely responsible for the trading decisions on your account. There is a very high degree of risk involved in trading. Any information and/or content is intended entirely for research, educational and informational purposes only and does not constitute investment or consultation advice or investment strategy. The information is not tailored to the investment needs of any specific person and therefore does not involve a consideration of any of the investment objectives, financial situation or needs of any viewer that may receive it. Kindly also note that past performance is not a reliable indicator of future results. Actual results may differ materially from those anticipated in forward-looking or past performance statements. We assume no liability as to the accuracy or completeness of any of the information and/or content provided herein and the Company cannot be held responsible for any omission, mistake nor for any loss or damage including without limitation to any loss of profit which may arise from reliance on any information supplied by Everest Fortune Group.

EURUSD pushing away from 2025 highsAfter creating a new 2025 high last week, MARKETSCOM:EURUSD is now in a slight correction mode. Will the bears take control from here? Let's have a look.
FX_IDC:EURUSD
Let us know what you think in the comments below.
Thank you.
77.3% of retail investor accounts lose money when trading CFDs with this provider. You should consider whether you understand how CFDs work and whether you can afford to take the high risk of losing your money. Past performance is not necessarily indicative of future results. The value of investments may fall as well as rise and the investor may not get back the amount initially invested. This content is not intended for nor applicable to residents of the UK. Cryptocurrency CFDs and spread bets are restricted in the UK for all retail clients.

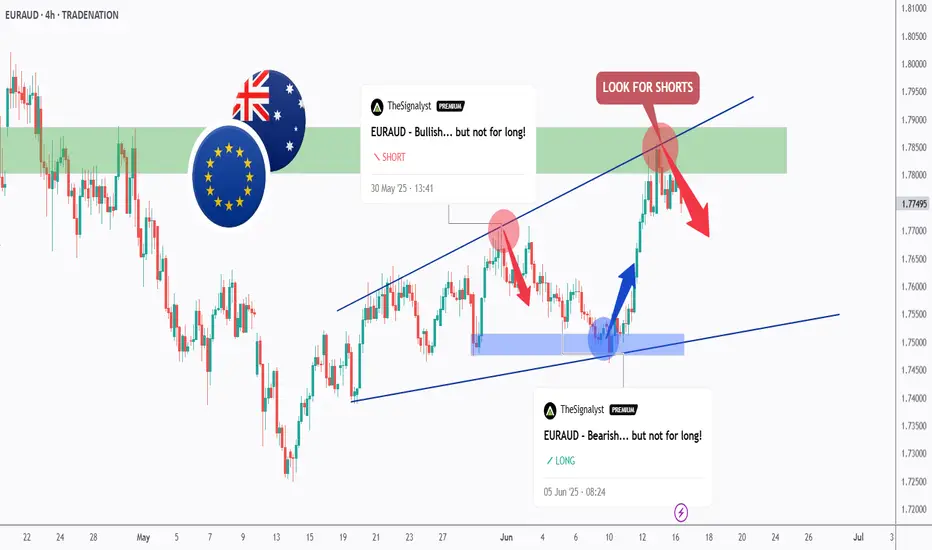
We Are Milking EURAUD... Again!Hello TradingView Family / Fellow Traders. This is Richard, also known as theSignalyst.
As per our two EURAUD analysis, we looked for shorts around the green structure and longs around the blue demand.
What's next?
📈EURAUD has been trading within the rising broadening wedge marked in blue, and it is currently rejecting the upper bound of the wedge which we consider an over-bought zone.
Moreover, the green zone is a strong structure and resistance.
🏹 Thus, the latest highlighted red circle is a strong area to look for sell setups as it is the intersection of the upper blue trendline and resistance.
📚 As per my trading style:
As #EURAUD is around the red circle zone, I will be looking for bearish reversal setups (like a double top pattern, trendline break , and so on...)
📚 Always follow your trading plan regarding entry, risk management, and trade management.
Good luck!
All Strategies Are Good; If Managed Properly!
~Rich
Disclosure: I am part of Trade Nation's Influencer program and receive a monthly fee for using their TradingView charts in my analysis.