EURCHF Bullish break-out signal above the 1W MA50.The EURCHF pair has rebounded on its 1.5-year Support Zone. A break above its 1W MA50 (blue trend-line) is a bullish break-out signal that would target Resistance 1 at 0.96650. That is where it can potentially make contact with the 1W MA200 (orange trend-line) for the first time since March 01 2021.
-------------------------------------------------------------------------------
** Please LIKE 👍, FOLLOW ✅, SHARE 🙌 and COMMENT ✍ if you enjoy this idea! Also share your ideas and charts in the comments section below! This is best way to keep it relevant, support us, keep the content here free and allow the idea to reach as many people as possible. **
-------------------------------------------------------------------------------
💸💸💸💸💸💸
👇 👇 👇 👇 👇 👇
EUR (Euro)

EURCHF: Will Keep Falling! Here is Why:
The analysis of the EURCHF chart clearly shows us that the pair is finally about to tank due to the rising pressure from the sellers.
Disclosure: I am part of Trade Nation's Influencer program and receive a monthly fee for using their TradingView charts in my analysis.
❤️ Please, support our work with like & comment! ❤️

EURCHF INTRADAY Bearish consolidationThe pair is in a bearish trend, with recent price action showing a bounce (oversold rally) that was rejected near 0.9430, a key resistance level from previous consolidation.
This rejection suggests sellers are still in control.
Key Levels to Watch:
Resistance: 0.9430 (key level), then 0.9500 and 0.9600 if broken.
Support: 0.9155, followed by 0.9100 and 0.9050.
Trading Outlook:
Bearish scenario: If price fails to break above 0.9430, expect a move lower toward 0.9300, with extended downside to 0.9200 and 0.9130 over time.
Bullish scenario: A daily close above 0.9430 would invalidate the bearish view and could lead to a move toward 0.9500 and possibly 0.9600.
Conclusion: EUR/CHF remains bearish unless price breaks and holds above 0.9430. Traders may look for short opportunities below resistance or switch to a bullish bias on a confirmed breakout.
This communication is for informational purposes only and should not be viewed as any form of recommendation as to a particular course of action or as investment advice. It is not intended as an offer or solicitation for the purchase or sale of any financial instrument or as an official confirmation of any transaction. Opinions, estimates and assumptions expressed herein are made as of the date of this communication and are subject to change without notice. This communication has been prepared based upon information, including market prices, data and other information, believed to be reliable; however, Trade Nation does not warrant its completeness or accuracy. All market prices and market data contained in or attached to this communication are indicative and subject to change without notice.

EUR_NZD WILL GO UP|LONG|
✅EUR_NZD fell down sharply
But a strong support level was hit at 1.8820
Thus as a rebound is already happening
A move up towards the target of 1.8923 shall follow
LONG🚀
✅Like and subscribe to never miss a new idea!✅
Disclosure: I am part of Trade Nation's Influencer program and receive a monthly fee for using their TradingView charts in my analysis.

EUR-CHF Local Short! Sell!
Hello,Traders!
EUR-CHF is making a rebound
And will soon hit a horizontal
Resistance level of 0.9400
From where we will be
Expecting a local bearish
Pullback and a move down
Sell!
Comment and subscribe to help us grow!
Check out other forecasts below too!
Disclosure: I am part of Trade Nation's Influencer program and receive a monthly fee for using their TradingView charts in my analysis.

EURUSD: Breakout and Potential RetraceHey Traders, in today's trading session we are monitoring EURUSD for a selling opportunity around 1.14200 zone, EURUSD was trading in an uptrend and successfully managed to break it out. Currently is in a correction phase in which it is approaching the retrace area at 1.14200 support and resistance zone.
Trade safe, Joe.

EURNZD: Long Signal Explained
EURNZD
- Classic bullish formation
- Our team expects growth
SUGGESTED TRADE:
Swing Trade
Buy EURNZD
Entry Level - 1.8863
Sl - 1.8820
Tp - 1.8953
Our Risk - 1%
Start protection of your profits from lower levels
Disclosure: I am part of Trade Nation's Influencer program and receive a monthly fee for using their TradingView charts in my analysis.
❤️ Please, support our work with like & comment! ❤️

EURCHF Buyers In Panic! SELL!
My dear friends,
My technical analysis for EURCHF is below:
The market is trading on 0.9383 pivot level.
Bias - Bearish
Technical Indicators: Both Super Trend & Pivot HL indicate a highly probable Bearish continuation.
Target - 0.9351
Recommended Stop Loss - 0.9398
About Used Indicators:
A pivot point is a technical analysis indicator, or calculations, used to determine the overall trend of the market over different time frames.
Disclosure: I am part of Trade Nation's Influencer program and receive a monthly fee for using their TradingView charts in my analysis.
———————————
WISH YOU ALL LUCK

EURUSD Buy the next dip and target 1.17700The EURUSD pair has been trading within a Channel Up pattern and is currently on its 2nd Bullish Leg that hasn't yet been completed.
It does print an identical price action to the 1st Bullish Leg of the pattern, having already made its first pull-back near the 0.382 Fibonacci retracement level and is now rising for the 2nd rejection.
Our plan is to buy the next dip and target 1.17700, which is the -0.136 Fibonacci extension, the level where the 1st Bullish Leg topped.
-------------------------------------------------------------------------------
** Please LIKE 👍, FOLLOW ✅, SHARE 🙌 and COMMENT ✍ if you enjoy this idea! Also share your ideas and charts in the comments section below! This is best way to keep it relevant, support us, keep the content here free and allow the idea to reach as many people as possible. **
-------------------------------------------------------------------------------
Disclosure: I am part of Trade Nation's Influencer program and receive a monthly fee for using their TradingView charts in my analysis.
💸💸💸💸💸💸
👇 👇 👇 👇 👇 👇

Bullish momentum to extend?The Fiber (EUR/USD) is falling towards the pivot which is a pullback support and could bounce to the 1st resistance which is also a pullback resistance.
Pivot: 1.1079
1st Support: 1.1075
1st Resistance: 1.1512
Risk Warning:
Trading Forex and CFDs carries a high level of risk to your capital and you should only trade with money you can afford to lose. Trading Forex and CFDs may not be suitable for all investors, so please ensure that you fully understand the risks involved and seek independent advice if necessary.
Disclaimer:
The above opinions given constitute general market commentary, and do not constitute the opinion or advice of IC Markets or any form of personal or investment advice.
Any opinions, news, research, analyses, prices, other information, or links to third-party sites contained on this website are provided on an "as-is" basis, are intended only to be informative, is not an advice nor a recommendation, nor research, or a record of our trading prices, or an offer of, or solicitation for a transaction in any financial instrument and thus should not be treated as such. The information provided does not involve any specific investment objectives, financial situation and needs of any specific person who may receive it. Please be aware, that past performance is not a reliable indicator of future performance and/or results. Past Performance or Forward-looking scenarios based upon the reasonable beliefs of the third-party provider are not a guarantee of future performance. Actual results may differ materially from those anticipated in forward-looking or past performance statements. IC Markets makes no representation or warranty and assumes no liability as to the accuracy or completeness of the information provided, nor any loss arising from any investment based on a recommendation, forecast or any information supplied by any third-party.

EURUSD: Weekly Overview June 9th 2025Hello Traders,
US CPI news is really important and could change the direction of the markets. But I think the Pair would keep its bullish trend for next week too.
*********************************************************************
The indicated levels are determined based on the most reaction points and the assumption of approximately equal distance between the zones.
Some of these points can also be confirmed by the mathematical intervals of Murray.
You can enter with/without confirmation. IF you want to take confirmation you can use LTF analysis, Spike move confirmation, Trend Strength confirmation and ETC.
SL could be placed below the zone or regarding the LTF swings.
TP is the next zone or the nearest moving S&R, which are median and borders of the drawn channels.
*******************************************************************
Role of different zones:
GREEN: Just long trades allowed on them.
RED: Just Short trades allowed on them.
BLUE: both long and short trades allowed on them.
WHITE: No trades allowed on them! just use them as TP points

Bearish drop?EUR/USD is rising towards the resistance level which is a pullback resistance that lines up with the 23.6% Fibonacci retracement and could drop from this level to our take profit.
Entry: 1.1406
Why we like it:
There is a pullback resistance level that lines up with the 23.6% Fibonacci retracement.
Stop loss: 1.1433
Why we like it:
There is a pullback resistance level that lines up with the 50% Fibonacci retracement.
Take profit: 1.1358
Why we like it:
There is a pullback support level that aligns with the 50% Fibonacci retracement.
Enjoying your TradingView experience? Review us!
Please be advised that the information presented on TradingView is provided to Vantage (‘Vantage Global Limited’, ‘we’) by a third-party provider (‘Everest Fortune Group’). Please be reminded that you are solely responsible for the trading decisions on your account. There is a very high degree of risk involved in trading. Any information and/or content is intended entirely for research, educational and informational purposes only and does not constitute investment or consultation advice or investment strategy. The information is not tailored to the investment needs of any specific person and therefore does not involve a consideration of any of the investment objectives, financial situation or needs of any viewer that may receive it. Kindly also note that past performance is not a reliable indicator of future results. Actual results may differ materially from those anticipated in forward-looking or past performance statements. We assume no liability as to the accuracy or completeness of any of the information and/or content provided herein and the Company cannot be held responsible for any omission, mistake nor for any loss or damage including without limitation to any loss of profit which may arise from reliance on any information supplied by Everest Fortune Group.

EURCHF: Fierce consolidation prompts to a bullish breakoutEURCHF is neutral on its 1D technical outlook (RSI = 52.253, MACD = 0.000, ADX = 26.091) as it has been consolidating since the April 25th high. Since then it has failed to close a 1D candle above the 1D MA200. Given the strong presence of the S1 Zone, if we get that closing above the 1D MA200, we will turn bullish, aiming for the 0.618 Fibonacci retracement level (TP = 0.94900), like the March 14th high did.
## If you like our free content follow our profile to get more daily ideas. ##
## Comments and likes are greatly appreciated. ##

EURJPY Be ready to sell soon.Last time we looked at the EURJPY pair (February 26, see chart below), we gave a clear buy signal that wasted no time hitting straight our 162.250 Target:
With the Lower Highs trend-line now broken, a new pattern has emerged and that's a (blue) Channel Up. The current Bullish Leg is headed straight to the 8-month Resistance Zone, so we will be turning bearish there, targeting the 1D MA200 (orange trend-line) at 162.250.
-------------------------------------------------------------------------------
** Please LIKE 👍, FOLLOW ✅, SHARE 🙌 and COMMENT ✍ if you enjoy this idea! Also share your ideas and charts in the comments section below! This is best way to keep it relevant, support us, keep the content here free and allow the idea to reach as many people as possible. **
-------------------------------------------------------------------------------
💸💸💸💸💸💸
👇 👇 👇 👇 👇 👇

Bearish drop?The Fiber (EUR/USD) has reacted off the pivot and could drop to the 1st support.
Pivot: 1.1471
1st Support: 1.1376
1st Resistance: 1.1573
Risk Warning:
Trading Forex and CFDs carries a high level of risk to your capital and you should only trade with money you can afford to lose. Trading Forex and CFDs may not be suitable for all investors, so please ensure that you fully understand the risks involved and seek independent advice if necessary.
Disclaimer:
The above opinions given constitute general market commentary, and do not constitute the opinion or advice of IC Markets or any form of personal or investment advice.
Any opinions, news, research, analyses, prices, other information, or links to third-party sites contained on this website are provided on an "as-is" basis, are intended only to be informative, is not an advice nor a recommendation, nor research, or a record of our trading prices, or an offer of, or solicitation for a transaction in any financial instrument and thus should not be treated as such. The information provided does not involve any specific investment objectives, financial situation and needs of any specific person who may receive it. Please be aware, that past performance is not a reliable indicator of future performance and/or results. Past Performance or Forward-looking scenarios based upon the reasonable beliefs of the third-party provider are not a guarantee of future performance. Actual results may differ materially from those anticipated in forward-looking or past performance statements. IC Markets makes no representation or warranty and assumes no liability as to the accuracy or completeness of the information provided, nor any loss arising from any investment based on a recommendation, forecast or any information supplied by any third-party.

Bearish drop for the Fiber?The price is reacting off the resistance level which is a pullback resistance and could drop from this level to our take profit.
Entry: 1.1452
Why we like it:
There is a pullback resistance level.
Stop loss: 1.1495
Why we like it:
There is a pullback resistance level.
Take profit: 1.1375
Why we like it:
There is an overlap support level that is slightly below the 38.2% Fibonacci retracement.
Enjoying your TradingView experience? Review us!
Please be advised that the information presented on TradingView is provided to Vantage (‘Vantage Global Limited’, ‘we’) by a third-party provider (‘Everest Fortune Group’). Please be reminded that you are solely responsible for the trading decisions on your account. There is a very high degree of risk involved in trading. Any information and/or content is intended entirely for research, educational and informational purposes only and does not constitute investment or consultation advice or investment strategy. The information is not tailored to the investment needs of any specific person and therefore does not involve a consideration of any of the investment objectives, financial situation or needs of any viewer that may receive it. Kindly also note that past performance is not a reliable indicator of future results. Actual results may differ materially from those anticipated in forward-looking or past performance statements. We assume no liability as to the accuracy or completeness of any of the information and/or content provided herein and the Company cannot be held responsible for any omission, mistake nor for any loss or damage including without limitation to any loss of profit which may arise from reliance on any information supplied by Everest Fortune Group.

EURJPY: Well supported Channel Up aiming for 166.700.EURJPY is bullish on its 1D technical outlook (RSI = 58.535, MACD = 0.340, ADX = 24.438) and is staging right now a rebound on the 1D MA50. This comes only days after the 1D MA200 HL rebound tight at the bottom of the Channel Up. This is a great opportunity to buy and aim for the R1 level (TP = 166.700).
## If you like our free content follow our profile to get more daily ideas. ##
## Comments and likes are greatly appreciated. ##

Eurchf BuyEurchf is in a bullish trend on the 4hr tf and is currently trading around a 4 hr demand that was made some days ago. once price closes above the green line which is a supply on the 1hr its should suggest buyers are still interested. if so there is a 5m supply that i need price to break which is my entry point targeting 4hr supply above

Mr. Wave Says... It’s Time for the Last Push!”[ b] EUR/USD is forming a clean Elliott Wave structure — and guess what?
We’re at Wave 4 consolidation, and Wave 5 is about to explode upward!
🔍 Here's what we're seeing:
✅ Wave 1 to 3 already confirmed with solid impulse
✅ Wave 4 found support near previous breakout zone
🎯 Target: Upper supply zone where Wave 5 is likely to terminate
🔔 This isn’t the time to sleep on the charts. Mr. Wave is literally pointing to the target zone — and we’re not ignoring it. 😉
---
🧠 Pro tip:
Use tight risk management, ride the final push of the motive wave, and watch for reversal signals in the supply zone.
---
📌 #GreenFireForex #ElliottWave #Wave5 #ForexTrading #TechnicalAnalysis #EURUSDSetup #ForexReel #WaveTheory #SupplyZone #ForexSignal #SmartTrading

EURNZD: Long Trading Opportunity
EURNZD
- Classic bullish setup
- Our team expects bullish continuation
SUGGESTED TRADE:
Swing Trade
Long EURNZD
Entry Point - 1.8875
Stop Loss - 1.8833
Take Profit - 1.8974
Our Risk - 1%
Start protection of your profits from lower levels
Disclosure: I am part of Trade Nation's Influencer program and receive a monthly fee for using their TradingView charts in my analysis.
❤️ Please, support our work with like & comment! ❤️

EURAUD - Bullish... but not for long!Hello TradingView Family / Fellow Traders. This is Richard, also known as theSignalyst.
📈EURAUD has been overall bullish trading within the rising channel marked in blue. However, it is currently retesting the upper bound of the channel.
Moreover, the green zone is a strong structure and resistance.
🏹 Thus, the highlighted red circle is a strong area to look for sell setups as it is the intersection of the upper blue trendline and resistance.
📚 As per my trading style:
As #EURAUD is around the red circle zone, I will be looking for bearish reversal setups (like a double top pattern, trendline break , and so on...)
📚 Always follow your trading plan regarding entry, risk management, and trade management.
Good luck!
All Strategies Are Good; If Managed Properly!
~Rich
Disclosure: I am part of Trade Nation's Influencer program and receive a monthly fee for using their TradingView charts in my analysis.

EUR/CHF BULLISH BIAS RIGHT NOW| LONG
EUR/CHF SIGNAL
Trade Direction: long
Entry Level: 0.933
Target Level: 0.936
Stop Loss: 0.931
RISK PROFILE
Risk level: medium
Suggested risk: 1%
Timeframe: 2h
Disclosure: I am part of Trade Nation's Influencer program and receive a monthly fee for using their TradingView charts in my analysis.
✅LIKE AND COMMENT MY IDEAS✅

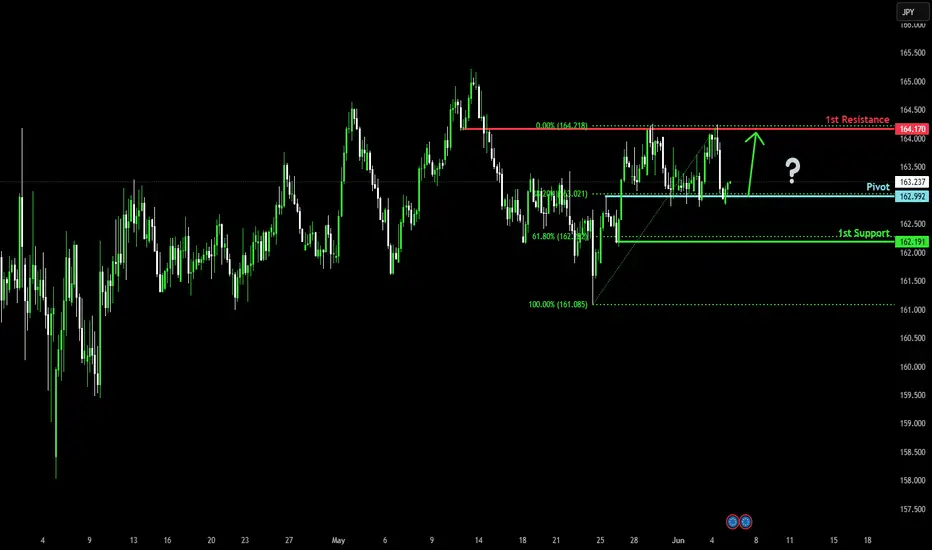
Could the price bounce from here?EUR/JPY has reacted off the pivot that lines up with the 38.2% Fibonacci retracement and could bounce to the 1st resistance.
Pivot: 162.99
1st Support: 162.19
1st Resistance: 164.17
Risk Warning:
Trading Forex and CFDs carries a high level of risk to your capital and you should only trade with money you can afford to lose. Trading Forex and CFDs may not be suitable for all investors, so please ensure that you fully understand the risks involved and seek independent advice if necessary.
Disclaimer:
The above opinions given constitute general market commentary, and do not constitute the opinion or advice of IC Markets or any form of personal or investment advice.
Any opinions, news, research, analyses, prices, other information, or links to third-party sites contained on this website are provided on an "as-is" basis, are intended only to be informative, is not an advice nor a recommendation, nor research, or a record of our trading prices, or an offer of, or solicitation for a transaction in any financial instrument and thus should not be treated as such. The information provided does not involve any specific investment objectives, financial situation and needs of any specific person who may receive it. Please be aware, that past performance is not a reliable indicator of future performance and/or results. Past Performance or Forward-looking scenarios based upon the reasonable beliefs of the third-party provider are not a guarantee of future performance. Actual results may differ materially from those anticipated in forward-looking or past performance statements. IC Markets makes no representation or warranty and assumes no liability as to the accuracy or completeness of the information provided, nor any loss arising from any investment based on a recommendation, forecast or any information supplied by any third-party.