Breakout Identified in EURJPY | 1st DecSignal ID: 78503
Time Issued: Wednesday, 01 December 2021 04:23:16 GMT
Status: open
Entry: 128.284 - 128.649
Limit: 129.121
Stop Loss: 127.659
The Breakout Opportunities system has just bought EURJPY at 128.492. The system recommends entering this trade at any price between 128.284 and 128.649. The signal was issued because the EURJPY has broken its 24-hour high while our Speculative Sentiment Index was at -1.251, suggesting that the EURJPY may have further to rise. A stop loss has been set at the 24-hour low of 127.659 and a profit target has been set at the 1 Day ATR level at 129.121. The system will move the stop to the next 24-hour low every time that 24-hour low is higher than the previous 24-hour low. Breakout Opportunities is a breakout strategy that aims to catch the significant moves that typically happen when currencies break through technical support or resistance.
Any opinions, news, research, analyses, prices, other information, or links to third-party sites contained on this website are provided on an "as-is" basis, as general market commentary, and do not constitute investment advice. The market commentary has not been prepared in accordance with legal requirements designed to promote the independence of investment research, and it is therefore not subject to any prohibition on dealing ahead of dissemination. Although this commentary is not produced by an independent source, FXCM takes all sufficient steps to eliminate or prevent any conflicts of interest arising out of the production and dissemination of this communication. The employees of FXCM commit to acting in the clients' best interests and represent their views without misleading, deceiving, or otherwise impairing the clients' ability to make informed investment decisions. For more information about the FXCM's internal organizational and administrative arrangements for the prevention of conflicts, please refer to the Firms' Managing Conflicts Policy. Please ensure that you read and understand our Full Disclaimer and Liability provision concerning the foregoing Information, which can be accessed on the website
Eur-jpy

Breakout Identified in EURJPY | 1st Dec Signal ID: 78503
Time Issued: Wednesday, 01 December 2021 04:23:16 GMT
Status: open
Entry: 128.284 - 128.649
Limit: 129.121
Stop Loss: 127.659
The Breakout Opportunities system has just bought EURJPY at 128.492. The system recommends entering this trade at any price between 128.284 and 128.649. The signal was issued because the EURJPY has broken its 24-hour high while our Speculative Sentiment Index was at -1.251, suggesting that the EURJPY may have further to rise. A stop loss has been set at the 24-hour low of 127.659 and a profit target has been set at the 1 Day ATR level at 129.121. The system will move the stop to the next 24-hour low every time that 24-hour low is higher than the previous 24-hour low. Breakout Opportunities is a breakout strategy that aims to catch the significant moves that typically happen when currencies break through technical support or resistance.
Any opinions, news, research, analyses, prices, other information, or links to third-party sites contained on this website are provided on an "as-is" basis, as general market commentary, and do not constitute investment advice. The market commentary has not been prepared in accordance with legal requirements designed to promote the independence of investment research, and it is therefore not subject to any prohibition on dealing ahead of dissemination. Although this commentary is not produced by an independent source, FXCM takes all sufficient steps to eliminate or prevent any conflicts of interest arising out of the production and dissemination of this communication. The employees of FXCM commit to acting in the clients' best interests and represent their views without misleading, deceiving, or otherwise impairing the clients' ability to make informed investment decisions. For more information about the FXCM's internal organizational and administrative arrangements for the prevention of conflicts, please refer to the Firms' Managing Conflicts Policy. Please ensure that you read and understand our Full Disclaimer and Liability provision concerning the foregoing Information, which can be accessed on the website

EUR/JPY Looking to go up ! Hi Guys ,
as you can see price passing through the upper channel, the downtrend in red seems to be will break out due to the daily support line 127.400, So I suggest waiting for price action to confirm the breakout then re-test the S-line then we can BUY
Thanks '
Ahmed

Possible trend shift in EURJPY – going short | 29th NovSignal ID: 78478
Time Issued: Monday, 29 November 2021 04:00:15 GMT
Status: open
Entry: 127.854 - 128.602
Limit: N/A
Stop Loss: 129.724
The Tidal Shift Strategy has just sold EURJPY at 128.228. The system recommends entering this trade at any price between 127.854 and 128.602. The signal was issued because our Speculative Sentiment Index has hit its most extreme positive level for the past 145 trading hours at -1.059, which suggests that the EURJPY could be trending downwards.The 14-period Average True Range on a daily chart is 0.299, so the stop loss has been set at 129.724. This stop loss order is a trailing stop that will move down as the market moves down. There is no profit target for this strategy. We expect to be closed by the stop loss.Tidal Shift is a trend trading strategy that aims to catch shifts in trend using trader sentiment as an indicator. The strategy looks to buy when the Speculative Sentiment Index reaches its lowest value for the past 145 trading hours, and looks to short when it reaches its highest value for the past 145 trading hours.
Any opinions, news, research, analyses, prices, other information, or links to third-party sites contained on this website are provided on an "as-is" basis, as general market commentary, and do not constitute investment advice. The market commentary has not been prepared in accordance with legal requirements designed to promote the independence of investment research, and it is therefore not subject to any prohibition on dealing ahead of dissemination. Although this commentary is not produced by an independent source, FXCM takes all sufficient steps to eliminate or prevent any conflicts of interest arising out of the production and dissemination of this communication. The employees of FXCM commit to acting in the clients' best interests and represent their views without misleading, deceiving, or otherwise impairing the clients' ability to make informed investment decisions. For more information about the FXCM's internal organizational and administrative arrangements for the prevention of conflicts, please refer to the Firms' Managing Conflicts Policy. Please ensure that you read and understand our Full Disclaimer and Liability provision concerning the foregoing Information, which can be accessed on the website.

Possible trend shift in EURJPY – going short | 29th Nov Signal ID: 78478
Time Issued: Monday, 29 November 2021 04:00:15 GMT
Status: open
Entry: 127.854 - 128.602
Limit: N/A
Stop Loss: 129.724
The Tidal Shift Strategy has just sold EURJPY at 128.228. The system recommends entering this trade at any price between 127.854 and 128.602. The signal was issued because our Speculative Sentiment Index has hit its most extreme positive level for the past 145 trading hours at -1.059, which suggests that the EURJPY could be trending downwards.The 14-period Average True Range on a daily chart is 0.299, so the stop loss has been set at 129.724. This stop loss order is a trailing stop that will move down as the market moves down. There is no profit target for this strategy. We expect to be closed by the stop loss.Tidal Shift is a trend trading strategy that aims to catch shifts in trend using trader sentiment as an indicator. The strategy looks to buy when the Speculative Sentiment Index reaches its lowest value for the past 145 trading hours, and looks to short when it reaches its highest value for the past 145 trading hours.
Any opinions, news, research, analyses, prices, other information, or links to third-party sites contained on this website are provided on an "as-is" basis, as general market commentary, and do not constitute investment advice. The market commentary has not been prepared in accordance with legal requirements designed to promote the independence of investment research, and it is therefore not subject to any prohibition on dealing ahead of dissemination. Although this commentary is not produced by an independent source, FXCM takes all sufficient steps to eliminate or prevent any conflicts of interest arising out of the production and dissemination of this communication. The employees of FXCM commit to acting in the clients' best interests and represent their views without misleading, deceiving, or otherwise impairing the clients' ability to make informed investment decisions. For more information about the FXCM's internal organizational and administrative arrangements for the prevention of conflicts, please refer to the Firms' Managing Conflicts Policy. Please ensure that you read and understand our Full Disclaimer and Liability provision concerning the foregoing Information, which can be accessed on the website.

⚜ EURJPY Long 450pipsHello Traders, 🙋♂️🙋♂️🙋♂️
Here we have a EURJPY long trade idea. If you like this idea please show your support!
We can see a break in the WFB line which has also performed another double bottom.
EUR
The EURO ( EUR ) has been impacted by the new COVID-19 variant. This has impacted the EURO drastically. However, we are beginning to see control in Europe.
Portugal - Portuguese Prime Minister António Costa announced on Thursday (November 25) that the country will reintroduce tighter pandemic restrictions.
Czech Republic - A 30-day state of emergency comes into effect on Friday (November 26) as the Czech Republic sees record-high COVID-19 cases.
Slovakia - Slovakia declared a 90-day state of emergency and a two-week lockdown following a spike in COVID-19 cases that saw the country’s seven-day average of cases rise above 10,000.
These are the few fundamental factors which will help make the EURO stronger. Also technically we can see there is strength expected as there is a double bottom & we can see much resistance in this area.
On the other hand we still have the virus spreading and EU countries are locking down or protesting. We must keep this in mind.
JPY
The Japanese Yen ( JPY ) has very strong last week. This has made many XXXJPY pairs very weak especially CADJPY which has had dropped 270pips on Friday alone!
We are expecting some JPY weakness as we can see many XXXJPY pairs at their structure zones which correlate. Such as GBPJPY
We can see the price is in a structure level and DAILY EMA zone
There is also some bad news forecasted for Retail Sales on the fundamental side which will push JPY down in value.
If you want to improve your trading, do not hesitate to send me a message! 📲
Please trade with caution and make sure you set your stop losses! Happy Trading 😁
Be sure to check out my other ideas below!
⚜⚜⚜⚜⚜

EURJPY is on bearish momentum! | 26 Nov 2021Price on a bearish momentum. We spot a potential sell entry at 128.518 in line with 127.2% Fibonacci extension towards our Take Profit at127.499 in line with 200% Fibonacci extension and 100% Fibonacci Retracement. Technical indicators are showing bearish momentum.
Any opinions, news, research, analyses, prices, other information, or links to third-party sites contained on this website are provided on an "as-is" basis, as general market commentary, and do not constitute investment advice. The market commentary has not been prepared in accordance with legal requirements designed to promote the independence of investment research, and it is therefore not subject to any prohibition on dealing ahead of dissemination. Although this commentary is not produced by an independent source, FXCM takes all sufficient steps to eliminate or prevent any conflicts of interest arising out of the production and dissemination of this communication. The employees of FXCM commit to acting in the clients' best interests and represent their views without misleading, deceiving, or otherwise impairing the clients' ability to make informed investment decisions. For more information about the FXCM's internal organizational and administrative arrangements for the prevention of conflicts, please refer to the Firms' Managing Conflicts Policy. Please ensure that you read and understand our Full Disclaimer and Liability provision concerning the foregoing Information, which can be accessed on the website.

EURJPY Potential for uptrend | 25th NovSignal ID: 78391
Time Issued: Thursday, 25 November 2021 03:11:15 GMT
Status: open
Entry: 129.224 - 129.526
Limit: 129.979
Stop Loss: 128.771
The Breakout Opportunities system has just bought EURJPY at 129.375. The system recommends entering this trade at any price between 129.224 and 129.526. The signal was issued because the EURJPY has broken its 24-hour high while our Speculative Sentiment Index was at -1.369, suggesting that the EURJPY may have further to rise. A stop loss has been set at the 24-hour low of 128.771 and a profit target has been set at the 1 Day ATR level at 129.979. The system will move the stop to the next 24-hour low every time that 24-hour low is higher than the previous 24-hour low. Breakout Opportunities is a breakout strategy that aims to catch the significant moves that typically happen when currencies break through technical support or resistance.
Any opinions, news, research, analyses, prices, other information, or links to third-party sites contained on this website are provided on an "as-is" basis, as general market commentary, and do not constitute investment advice. The market commentary has not been prepared in accordance with legal requirements designed to promote the independence of investment research, and it is therefore not subject to any prohibition on dealing ahead of dissemination. Although this commentary is not produced by an independent source, FXCM takes all sufficient steps to eliminate or prevent any conflicts of interest arising out of the production and dissemination of this communication. The employees of FXCM commit to acting in the clients' best interests and represent their views without misleading, deceiving, or otherwise impairing the clients' ability to make informed investment decisions. For more information about the FXCM's internal organizational and administrative arrangements for the prevention of conflicts, please refer to the Firms' Managing Conflicts Policy. Please ensure that you read and understand our Full Disclaimer and Liability provision concerning the foregoing Information, which can be accessed on the website.

EURJPY Potential for uptrend | 25th Nov Signal ID: 78391
Time Issued: Thursday, 25 November 2021 03:11:15 GMT
Status: open
Entry: 129.224 - 129.526
Limit: 129.979
Stop Loss: 128.771
The Breakout Opportunities system has just bought EURJPY at 129.375. The system recommends entering this trade at any price between 129.224 and 129.526. The signal was issued because the EURJPY has broken its 24-hour high while our Speculative Sentiment Index was at -1.369, suggesting that the EURJPY may have further to rise. A stop loss has been set at the 24-hour low of 128.771 and a profit target has been set at the 1 Day ATR level at 129.979. The system will move the stop to the next 24-hour low every time that 24-hour low is higher than the previous 24-hour low. Breakout Opportunities is a breakout strategy that aims to catch the significant moves that typically happen when currencies break through technical support or resistance.
Any opinions, news, research, analyses, prices, other information, or links to third-party sites contained on this website are provided on an "as-is" basis, as general market commentary, and do not constitute investment advice. The market commentary has not been prepared in accordance with legal requirements designed to promote the independence of investment research, and it is therefore not subject to any prohibition on dealing ahead of dissemination. Although this commentary is not produced by an independent source, FXCM takes all sufficient steps to eliminate or prevent any conflicts of interest arising out of the production and dissemination of this communication. The employees of FXCM commit to acting in the clients' best interests and represent their views without misleading, deceiving, or otherwise impairing the clients' ability to make informed investment decisions. For more information about the FXCM's internal organizational and administrative arrangements for the prevention of conflicts, please refer to the Firms' Managing Conflicts Policy. Please ensure that you read and understand our Full Disclaimer and Liability provision concerning the foregoing Information, which can be accessed on the website.


EURJPY can move further low? 🦐EURJPY after our last analysis moved as expected to the support area.
The market is now trading over a weekly support and already retested the trendline.
According to Plancton's strategy if the price will break below and satisfy the ACADEMY conditions we will set a nice short order.
--––
Follow the Shrimp 🦐
Keep in mind.
🟣 Purple structure -> Monthly structure.
🔴 Red structure -> Weekly structure.
🔵 Blue structure -> Daily structure.
🟡 Yellow structure -> 4h structure.
⚫️ Black structure -> <4h structure.
Here is the Plancton0618 technical analysis , please comment below if you have any question.
The ENTRY in the market will be taken only if the condition of the Plancton0618 strategy will trigger.

EURJPY bearish continuation | 23rd Nov 2021Price is abiding to the descending trendline resistance, signifying bearish momentum. We can expect price to drop from pivot level in line with 127.2% Fibonacci projection and 61.8% Fibonacci retracement towards 1st Support in line with 61.8% Fibonacci retracement. Our bearish bias is further supported by price holding below the ichimoku Cloud.
Any opinions, news, research, analyses, prices, other information, or links to third-party sites contained on this website are provided on an "as-is" basis, as general market commentary, and do not constitute investment advice. The market commentary has not been prepared in accordance with legal requirements designed to promote the independence of investment research, and it is therefore not subject to any prohibition on dealing ahead of dissemination. Although this commentary is not produced by an independent source, FXCM takes all sufficient steps to eliminate or prevent any conflicts of interest arising out of the production and dissemination of this communication. The employees of FXCM commit to acting in the clients' best interests and represent their views without misleading, deceiving, or otherwise impairing the clients' ability to make informed investment decisions. For more information about the FXCM's internal organizational and administrative arrangements for the prevention of conflicts, please refer to the Firms' Managing Conflicts Policy. Please ensure that you read and understand our Full Disclaimer and Liability provision concerning the foregoing Information, which can be accessed on the website.

price will goan ascending triangle is formed, which is an upward signal. Where do you think the price will go?

EURJPY is on a bearish momentum! | 22 Nov 2021Prices are on bearish momentum. We see potential for a dip from our sell entry at 129.056 which is an area of Fibonacci confluences towards our Take Profit at 127.997 in line with 200% Fibonacci projection and graphical swing low. Technical indicators are showing bearish momentum.
Any opinions, news, research, analyses, prices, other information, or links to third-party sites contained on this website are provided on an "as-is" basis, as general market commentary, and do not constitute investment advice. The market commentary has not been prepared in accordance with legal requirements designed to promote the independence of investment research, and it is therefore not subject to any prohibition on dealing ahead of dissemination. Although this commentary is not produced by an independent source, FXCM takes all sufficient steps to eliminate or prevent any conflicts of interest arising out of the production and dissemination of this communication. The employees of FXCM commit to acting in the clients' best interests and represent their views without misleading, deceiving, or otherwise impairing the clients' ability to make informed investment decisions. For more information about the FXCM's internal organizational and administrative arrangements for the prevention of conflicts, please refer to the Firms' Managing Conflicts Policy. Please ensure that you read and understand our Full Disclaimer and Liability provision concerning the foregoing Information, which can be accessed on the website.

EURJPY can make a lower low? 🦐EURJPY on the 4h chart is trading in a descending channel.
The market after the recent low retraced over the daily structure at the 0.382 Fibonacci level.
According to Plancton's strategy if the price will break below and satisfy the ACADEMY rules we will set a nice short order.
--––
Follow the Shrimp 🦐
Keep in mind.
🟣 Purple structure -> Monthly structure.
🔴 Red structure -> Weekly structure.
🔵 Blue structure -> Daily structure.
🟡 Yellow structure -> 4h structure.
⚫️ Black structure -> <4h structure.
Here is the Plancton0618 technical analysis , please comment below if you have any question.
The ENTRY in the market will be taken only if the condition of the Plancton0618 strategy will trigger.

EURJPY Short OpportunityEUR has weakness today while JPY showing stronger. This short sell idea has 50 pips potential profit.

EURJPY is on a bearish momentum! | 19 Nov 2021Prices are on a bearish momentum and consolidating in a bearish channel. We see potential for dips from our sell entry at 129.839 in line with 23.8% Fibonacci retracement, 78.6 Fibonacci extension and 23.6% Fibonacci retracement towards our Take Profit at 129.435 in line with 78.6% Fibonacci retracement and 61.8% Fibonacci retracement. Technical indicators are showing bearish momentum.
Any opinions, news, research, analyses, prices, other information, or links to third-party sites contained on this website are provided on an "as-is" basis, as general market commentary, and do not constitute investment advice. The market commentary has not been prepared in accordance with legal requirements designed to promote the independence of investment research, and it is therefore not subject to any prohibition on dealing ahead of dissemination. Although this commentary is not produced by an independent source, FXCM takes all sufficient steps to eliminate or prevent any conflicts of interest arising out of the production and dissemination of this communication. The employees of FXCM commit to acting in the clients' best interests and represent their views without misleading, deceiving, or otherwise impairing the clients' ability to make informed investment decisions. For more information about the FXCM's internal organizational and administrative arrangements for the prevention of conflicts, please refer to the Firms' Managing Conflicts Policy. Please ensure that you read and understand our Full Disclaimer and Liability provision concerning the foregoing Information, which can be accessed on the website.

FOREX ANALYSIS : EURJPYFX:EURJPY
The blue and red lines mean: I think prices can return in these areas.
Green lines mean: I think the price can reach these areas. They are therefore known as transaction targets.
If you want to use this deal, please risk only one percent of your account balance.

EURJPY - LONG POSITION (8HR) Overall bullish on EUR and JPY so kinda conflicted on this pair despite confluences stacking up. Need to see candle rejections in order to re-enter as I have already taken significant pain on this trade.
Confluences:
- Bullish market structure confirmed by trend line and breakout and retest of downtrend
- Rejection of blue region
- Rejection of 71% fib area
- significant rejection candles at the fib level

EURJPY for longThe euro fell, with fears of a strong outbreak of the Corona virus again within the union.
Technically, the EURJPY is approaching good potential selling areas, supported by the approaching completion of the bat harmonic pattern in an extended area from 129.10 to 128.60 as a stop loss with a target of up to 132.40, with the first target being 130.70

# EURJPY in the weekly it is bullish #EURJPY
we had triangle in the chart and we had 5 wave📉
but 5wave is over
and we will have ABC wave📈and i draw the price target in the long time
and we had up trend
all says we are in ascending
if you like this analys and want to see more follow like and comment
good luck

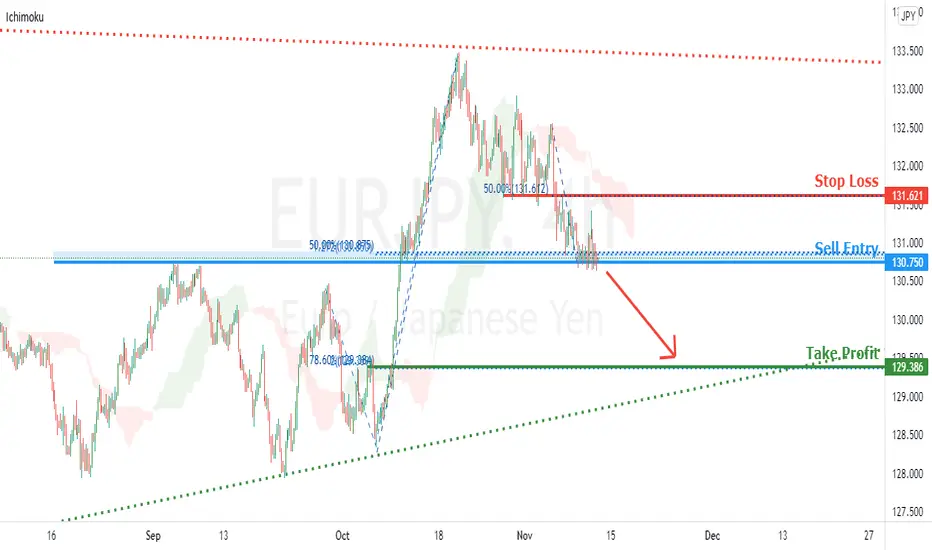
EURJPY potential for further downtrend | 11 NovPrice is near sell entry price of 130.745 which is 50% Fibonacci retracement and 127.2% Fibonacci projection . Price can potentially dip to the take profit level of 129.386 which is also 78.6% Fibonacci retracement and graphical overlap support. Our bearish bias is supported by ichimoku cloud indicator as price is trading under it.
Any opinions, news, research, analyses, prices, other information, or links to third-party sites contained on this website are provided on an "as-is" basis, as general market commentary, and do not constitute investment advice. The market commentary has not been prepared in accordance with legal requirements designed to promote the independence of investment research, and it is therefore not subject to any prohibition on dealing ahead of dissemination. Although this commentary is not produced by an independent source, FXCM takes all sufficient steps to eliminate or prevent any conflicts of interest arising out of the production and dissemination of this communication. The employees of FXCM commit to acting in the clients' best interests and represent their views without misleading, deceiving, or otherwise impairing the clients' ability to make informed investment decisions. For more information about the FXCM's internal organizational and administrative arrangements for the prevention of conflicts, please refer to the Firms' Managing Conflicts Policy. Please ensure that you read and understand our Full Disclaimer and Liability provision concerning the foregoing Information, which can be accessed on the website
delivery of the pricedelivery of the price to the minimums is still incomplete. it is worth waiting for a rebound from resistance.
