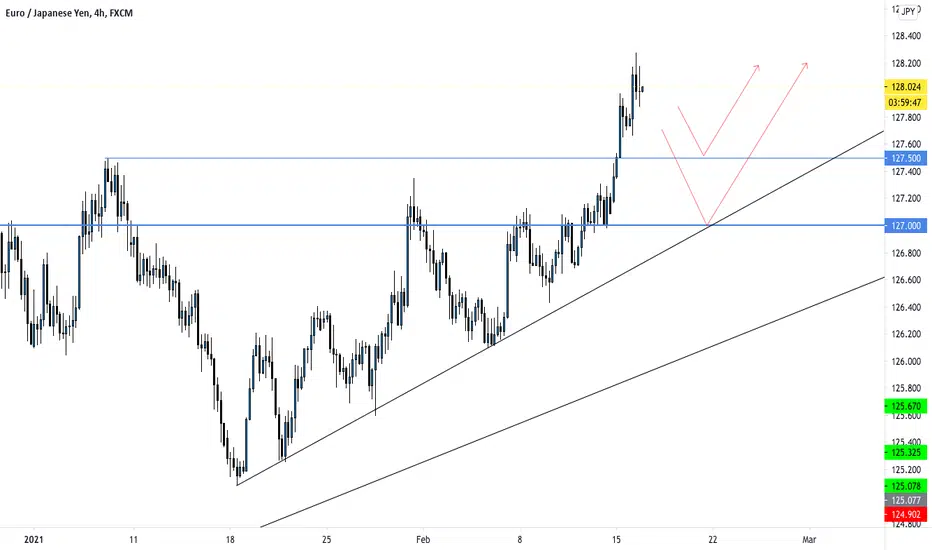
EURJPY for a retest of the support🦐EURJPY after our last analysis broke above the monthly resistance and now is retracing for a retest of it.
The price is moving over an ascending trendline and according to Plancton's strategy at the new sign of inversion, we can set a nice long order.
--––
Follow the Shrimp 🦐
Keep in mind.
🟣 Purple structure -> Monthly structure.
🔴 Red structure -> Weekly structure.
🔵 Blue structure -> Daily structure.
🟡 Yellow structure -> 4h structure.
⚫️ Black structure -> <4h structure.
Here is the Plancton0618 technical analysis , please comment below if you have any question.
The ENTRY in the market will be taken only if the condition of the Plancton0618 strategy will trigger.
Feb 11
Comment:
Eur-jpy

EUR/JPY, ready for the turnover?🧙🏻♂️EUR/JPY has come back to re-test the area of resistance that it has broken. From this point, we are opening BUY positions and aiming for our First Target as shown on the chart🙌🏻

EURJPY: Important Breakout
Hey traders,
New higher high higher close on a daily chart on EURJPY.
After a quite long bullish accumulation, the price managed to break 127.5 major resistance.
Now a local rising trend line and a broken horizontal level give us a demand zone.
It can give us a nice spot to catch a bullish continuation after retest.
Next strong resistance is 129.0
Good luck!

EUR JPY SELL (EURO - JAPANESE YEN)Hi there. Price is forming a reversal pattern to change its direction.
Watch strong price action at the current levels for sell.

EUR/JPY - Expecting a 500 Pips Bullish MoveGood morning traders, today we bring you a long-term analysis on the EUR/JPY, since it made an important breakout that we have been waiting for a long time.
🔸After the break of the bearish channel and the resistance zone, the price consolidated for several weeks with no clear direction.
🔸Apparently, this corrective process is over, as we are witnessing a bullish breakout.
🔸This is an important event, as it gives us a very strong bullish scenario towards the next resistance zone, at 133,000.
🔸During the next few weeks or months it is very likely that the price will be in an impulsive phase.

Eur/jpy long ideaWill be looking for a pullback to the 127 region to consider long positions on this pair.
EURJPY could pull back to the trendline and bounce!EURJPY could pull back to the trendline and bounce!

EURJPY could pull back to the trendline and bounce! EURJPY could pull back to the trendline and bounce!

EURJPY: The price is FOLLOWING the main TRENDLINEHi traders and welcome to my channel, if you enjoy my FREE Technical Analysis 📈 and Trading Tips 📉, support the idea hitting the LIKE 👍 button and don't forget to SUBSCRIBE ✔️ my channel, you won't miss anything !
🟢 Forex Pair :
EUR/JPY
⚪ Technical Analysis :
Since the end of January 2021, the price has been following an interesting uptrend, bouncing many times on its trendline.
On the 29th of January the price broke through the strong S/R zone at about 126.500, pushing up after a quick re-test during the beginning of February. A strong bullish candle was absolutely an interesting entry point as a comfirmation of a new uptrend.
Today the price broke the resistance zone at about 127.500 and it is currenly consolitading.
🔴 Conclusion :
Considering the daily time frame, I can see that the market is following a strong uptrend and after this strong impulse, there is a possibility to see a short retracement.
I'm not sure if it would be a market reversal, but on this pair, I'll be waiting for a re-test of the S/R zone at 127.500 before planning my new long position on this trade.
Stay tuned for Updates and Trading Signals !
What's your opinion? Share your idea writing a comment!
⚠️ Please note the views are not investment advice and should be used only for educational purposes ⚠️
Trade Safe and Responsibly ,
Gianni

EURJPYWe have just entered a long position on EURJPY. We are currently working off a 4hr and a 1day time frame. If the trade doesn't play out by the market closure later then we will look at manually closing out of this trade to prevent running any trades over the weekend.

EURJPY is facing bullish pressure | 15 Feb 2021Price is facing bullish pressure where we could see a further upside above this level.

EURJPY is facing bullish pressure | 15 Feb 2021 LongPrice is facing bullish pressure where we could see a further upside above this level.

EUR/JPY Analysis Welcome back! Please support this idea with a LIKE if you find it useful.
*** EUR/JPY - Price is currently re-testing a very strong resistance zone. I expect it possible break to the downside, but if price pushes higher, we can look for a nice short returning back to previous resistance which will become future support (target).
We recommend that you keep this pair on your watchlist and enter when the entry criteria of your strategy is met.
Click "Follow" on our profile if you'd like these trade ideas delivered straight to your email in the future.
Thanks for your continued support!
Brian Kenya Horton, BK Forex Academy

EURJPY 4hour Analysis February, 14th, 2021EURJPY Long Idea
Weekly Trend: Bullish
Daily Trend: Bullish
4hour Trend: Bullish
Trade scenario 1: EJ is still very bullish on all relevant timeframes. Price action currently is at a fairly large supply zone around 127.400 but we will remain with the overall bullish trend until we see otherwise. Ideally we want to see a higher low form within this pattern and present a long opportunity. We will look to target the supply zone and will look to continue to manage above this zone if price action breaks above.
Trade scenario 2: For us to consider EJ bearish we need to see a lower high form below 127.000 and present strong bearish setups. Look to enter on a confirmed lower high and target lower toward key support.


EURJPY ready for a break to the upside? 🦐EURJPY after the break below the 125.800 structure bounces over the 0.5 Fibonacci level of the previous leg.
The market from there started a new impulse and now testing a strong resistance level.
If the price will break above, according to Plancton's strategy, we can set a nice long order.
--––
Follow the Shrimp
Keep in mind.
🟣 Purple structure -> Monthly structure.
🔴 Red structure -> Weekly structure.
🔵 Blue structure -> Daily structure.
🟡 Yellow structure -> 4h structure.
⚫️ Black structure -> <4h structure.
Here is the Plancton0618 technical analysis , please comment below if you have any question.
The ENTRY in the market will be taken only if the condition of the Plancton0618 strategy will trigger.


EURJPY - Buy BiasHigher highs & higher lows. Looking for the price to return to our psych level creating a higher low off this 61.8% fib or even come a bit lower to the 50% before a proper move. Waiting for these impulses is key as it can identify where the market is going. We want price to come up and test these highs again.

EURJPY - Setting up for SHORTWe first require a few confirmations before entering this trade. Await an impulse down and wait for correction. Ideally correction should retest the area marked.

EURJPY - Setting up for SHORTWe first require a few confirmations before entering this trade. Await an impulse down and wait for correction. Ideally correction should retest the area marked.

Short to weekly PPIn this post you can see how ona may use the Least Square Moving Average (LSMA) of the highs, lows and the median along with Camarilla pivot points.
The new LSMA is one of the most sophisticated moving averages which incorporates linear regression. It appeared on the market in 2000s.
You may use LSMA weekly, monthly or daily channels. MAC (Moving Average Channel of highs and lows) was introduced by Jake Bernstein. Periods can be changed of course. I applied 45 as in geometry the right angle is 45 degrees and backtesting shows that values slightly below 50 tend to give more accurate signals.
I this trade I target Camarilla L3 weekly reversal level / weekly PP (central Pivot Point - typically price rarely misses those, its a strategy of its own). Price is below monthly close (= camarilla monthly pivot) - didnt plot that. And is also rejecting from 45 weekly LSMA of the lows.
Good luck in your trading!
FOR EDUCATIONAL PURPOSES

EURJPY can break the monthly resistance? 🦐EURJPY after the break below the 125.800 structure bounces over the 0.5 Fibonacci level of the previous leg.
The market from there started a new impulse and now testing a strong resistance level .
If the price will break above, according to Plancton's strategy, we can set a nice long order.
--––
Follow the Shrimp 🦐
Keep in mind.
🟣 Purple structure -> Monthly structure.
🔴 Red structure -> Weekly structure.
🔵 Blue structure -> Daily structure.
🟡 Yellow structure -> 4h structure.
⚫️ Black structure -> <4h structure.
Here is the Plancton0618 technical analysis , please comment below if you have any question.
The ENTRY in the market will be taken only if the condition of the Plancton0618 strategy will trigger.
