Bullish bounce?EUR/USD is falling towards the support level which is a pullback support that line sup with the 50% Fibonacci retracement and could bounce from this level to our take profit.
Entry: 1.0925
Why we like it:
There is a pullback support level that aligns with the 50% Fibonacci retracement.
Stop loss: 1.0853
Why we like it:
There is a pullback support level that lines up with the 71% Fibonacci retracement.
Take profit: 1.1086
Why we like it:
There is a pullback resistance level.
Enjoying your TradingView experience? Review us!
Please be advised that the information presented on TradingView is provided to Vantage (‘Vantage Global Limited’, ‘we’) by a third-party provider (‘Everest Fortune Group’). Please be reminded that you are solely responsible for the trading decisions on your account. There is a very high degree of risk involved in trading. Any information and/or content is intended entirely for research, educational and informational purposes only and does not constitute investment or consultation advice or investment strategy. The information is not tailored to the investment needs of any specific person and therefore does not involve a consideration of any of the investment objectives, financial situation or needs of any viewer that may receive it. Kindly also note that past performance is not a reliable indicator of future results. Actual results may differ materially from those anticipated in forward-looking or past performance statements. We assume no liability as to the accuracy or completeness of any of the information and/or content provided herein and the Company cannot be held responsible for any omission, mistake nor for any loss or damage including without limitation to any loss of profit which may arise from reliance on any information supplied by Everest Fortune Group.
Eur-usd

EURUSD update 20.03After a successful swing long
that was taken
We've reached external liquidity
Now, I expect a correction to the green box; from it, we will go even higher—reaching liquidity from above.
The current correction will take some time to form. It may happen faster, but I have indicated the targets on the chart.
Best regards EXCAVO

EURUSD forming a top?EURUSD - Intraday
Continued upward momentum from 1.0778 resulted in the pair posting net daily gains yesterday.
Trades at the highest level in 6 months.
A Fibonacci confluence area is located at 1.1105.
Our medium term bias is bearish below 1.1014 towards 1.0700.
There is scope for mild buying at the open but gains should be limited.
We look to Sell at 1.1160 (stop at 1.1245)
Our profit targets will be 1.0837 and 1.0700
Resistance: 1.1146 / 1.1160 / 1.1214
Support: 1.0837 / 1.0700 / 1.0675
Risk Disclaimer
The trade ideas beyond this page are for informational purposes only and do not constitute investment advice or a solicitation to trade. This information is provided by Signal Centre, a third-party unaffiliated with OANDA, and is intended for general circulation only. OANDA does not guarantee the accuracy of this information and assumes no responsibilities for the information provided by the third party. The information does not take into account the specific investment objectives, financial situation, or particular needs of any particular person. You should take into account your specific investment objectives, financial situation, and particular needs before making a commitment to trade, including seeking advice from an independent financial adviser regarding the suitability of the investment, under a separate engagement, as you deem fit.
You accept that you assume all risks in independently viewing the contents and selecting a chosen strategy.
Where the research is distributed in Singapore to a person who is not an Accredited Investor, Expert Investor or an Institutional Investor, Oanda Asia Pacific Pte Ltd (“OAP“) accepts legal responsibility for the contents of the report to such persons only to the extent required by law. Singapore customers should contact OAP at 6579 8289 for matters arising from, or in connection with, the information/research distributed.

Bullish bounce?The Fiber (EUR/USD) is falling towards the pivot which lines up with the 50% Fibonacci retracement and could bounce to the 1st resistance.
Pivot: 1.0946
1st Support: 1.0836
1st Resistance: 1.1144
Risk Warning:
Trading Forex and CFDs carries a high level of risk to your capital and you should only trade with money you can afford to lose. Trading Forex and CFDs may not be suitable for all investors, so please ensure that you fully understand the risks involved and seek independent advice if necessary.
Disclaimer:
The above opinions given constitute general market commentary, and do not constitute the opinion or advice of IC Markets or any form of personal or investment advice.
Any opinions, news, research, analyses, prices, other information, or links to third-party sites contained on this website are provided on an "as-is" basis, are intended only to be informative, is not an advice nor a recommendation, nor research, or a record of our trading prices, or an offer of, or solicitation for a transaction in any financial instrument and thus should not be treated as such. The information provided does not involve any specific investment objectives, financial situation and needs of any specific person who may receive it. Please be aware, that past performance is not a reliable indicator of future performance and/or results. Past Performance or Forward-looking scenarios based upon the reasonable beliefs of the third-party provider are not a guarantee of future performance. Actual results may differ materially from those anticipated in forward-looking or past performance statements. IC Markets makes no representation or warranty and assumes no liability as to the accuracy or completeness of the information provided, nor any loss arising from any investment based on a recommendation, forecast or any information supplied by any third-party.

Bullish bounce?EUR/USD is falling towards the support level which is a pullback support that lines up with the 50% Fibonacci retracement and could bounce from this level to our take profit.
Entry: 1.0951
Why we like it:
There is a pullback support level that aligns with the 50% Fibonacci retracement.
Stop loss: 1.0853
Why we like it:
There is a pullback support level that lines up with the 71% Fibonacci retracement.
Take profit: 1.1146
Why we like it:
There is a pullback resistance.
Enjoying your TradingView experience? Review us!
Please be advised that the information presented on TradingView is provided to Vantage (‘Vantage Global Limited’, ‘we’) by a third-party provider (‘Everest Fortune Group’). Please be reminded that you are solely responsible for the trading decisions on your account. There is a very high degree of risk involved in trading. Any information and/or content is intended entirely for research, educational and informational purposes only and does not constitute investment or consultation advice or investment strategy. The information is not tailored to the investment needs of any specific person and therefore does not involve a consideration of any of the investment objectives, financial situation or needs of any viewer that may receive it. Kindly also note that past performance is not a reliable indicator of future results. Actual results may differ materially from those anticipated in forward-looking or past performance statements. We assume no liability as to the accuracy or completeness of any of the information and/or content provided herein and the Company cannot be held responsible for any omission, mistake nor for any loss or damage including without limitation to any loss of profit which may arise from reliance on any information supplied by Everest Fortune Group.
Enjoying your TradingView experience? Review us!

EURUSD: Forming long term top inside 5 days.EURUSD is bullish on its 1D technical outlook (RSI = 59.837, MACD = 0.006, ADX = 25.790) as since last Thursday it is rebounding on the 1D MA200. This is a perfect repetition of the September 2024 Double Top and right now we are on the final mini Channel Up, which inside 5 days priced that past top. Consequently we are prepared to turn bearish by halfway next week and aim for the S1 initially (TP = 1.0400).
See how our prior idea has worked out:
## If you like our free content follow our profile to get more daily ideas. ##
## Comments and likes are greatly appreciated. ##

EUR/USD - Waiting for a long Hi,
FX:EURUSD ascending triangle
I will wait for a pullback towards 1.075 or the major support at 1.6129 before entering in a long position as previously mentioned.
I'm expecting the 1.10 area of resistance to be tested before we see any real downwards momentum.
Wait for the Blue area circled to give way to confirm heavy selling pressure.

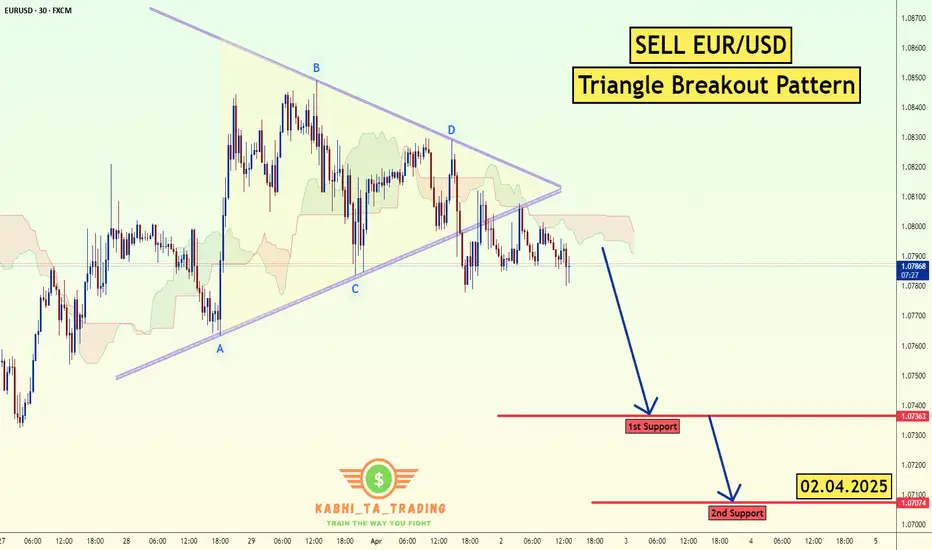
EUR/USD Triangle Breakout (02.04.2025)The EUR/USD Pair on the M30 timeframe presents a Potential Selling Opportunity due to a recent Formation of a Triangle Breakout Pattern. This suggests a shift in momentum towards the downside in the coming hours.
Possible Short Trade:
Entry: Consider Entering A Short Position around Trendline Of The Pattern.
Target Levels:
1st Support – 1.0736
2nd Support – 1.0707
🎁 Please hit the like button and
🎁 Leave a comment to support for My Post !
Your likes and comments are incredibly motivating and will encourage me to share more analysis with you.
Best Regards, KABHI_TA_TRADING
Thank you.
Bullish bounce?EUR/USD is falling towards the support level which is a pullback support that lines up with the 78.6% Fibonacci retracement and could bounce from this level to our take profit.
Entry: 1.0765
Why we like it:
There is a pullback support level that line sup with the 78.6% Fibonacci retracement.
Stop loss: 1.0732
Why we like it:
There is a pullback support level.
Take profit: 1.0836
Why we like it:
There is an overlap resistance level.
Enjoying your TradingView experience? Review us!
Please be advised that the information presented on TradingView is provided to Vantage (‘Vantage Global Limited’, ‘we’) by a third-party provider (‘Everest Fortune Group’). Please be reminded that you are solely responsible for the trading decisions on your account. There is a very high degree of risk involved in trading. Any information and/or content is intended entirely for research, educational and informational purposes only and does not constitute investment or consultation advice or investment strategy. The information is not tailored to the investment needs of any specific person and therefore does not involve a consideration of any of the investment objectives, financial situation or needs of any viewer that may receive it. Kindly also note that past performance is not a reliable indicator of future results. Actual results may differ materially from those anticipated in forward-looking or past performance statements. We assume no liability as to the accuracy or completeness of any of the information and/or content provided herein and the Company cannot be held responsible for any omission, mistake nor for any loss or damage including without limitation to any loss of profit which may arise from reliance on any information supplied by Everest Fortune Group.

EURUSD 4H Bearish Cross starting the peak formation.The EURUSD pair posted a strong rebound last week, which is along the lines of our long-term bearish structure estimate, similar to the September 2024 Top.
The 4H MA50/100 Bearish Cross that was formed on Thursday, simply confirms that the pattern goes according to plan as on September 06 2024, the price got rejected after its completion and then rebounded to test Resistance 1 before the ultimate market peak.
We still expect a similar development, with our ultimate long-term Target being 1.03650, just above Support 1.
-------------------------------------------------------------------------------
** Please LIKE 👍, FOLLOW ✅, SHARE 🙌 and COMMENT ✍ if you enjoy this idea! Also share your ideas and charts in the comments section below! This is best way to keep it relevant, support us, keep the content here free and allow the idea to reach as many people as possible. **
-------------------------------------------------------------------------------
Disclosure: I am part of Trade Nation's Influencer program and receive a monthly fee for using their TradingView charts in my analysis.
💸💸💸💸💸💸
👇 👇 👇 👇 👇 👇

Potential bearish reversal?EUR/USD is rising towards the resistance level which is a pullback resistance that aligns with the 61.8% Fibonacci retracement and could reverse from this level to our take profit.
Entry: 1.0876
Why we like it:
There is a pullback resistance that lines up with the 61.8% Fibonacci retracement.
Stop loss: 1.0948
Why we like it:
There is a pullback resistance.
Take profit: 1.0799
Why we like it:
There is a pullback support level.
Enjoying your TradingView experience? Review us!
Please be advised that the information presented on TradingView is provided to Vantage (‘Vantage Global Limited’, ‘we’) by a third-party provider (‘Everest Fortune Group’). Please be reminded that you are solely responsible for the trading decisions on your account. There is a very high degree of risk involved in trading. Any information and/or content is intended entirely for research, educational and informational purposes only and does not constitute investment or consultation advice or investment strategy. The information is not tailored to the investment needs of any specific person and therefore does not involve a consideration of any of the investment objectives, financial situation or needs of any viewer that may receive it. Kindly also note that past performance is not a reliable indicator of future results. Actual results may differ materially from those anticipated in forward-looking or past performance statements. We assume no liability as to the accuracy or completeness of any of the information and/or content provided herein and the Company cannot be held responsible for any omission, mistake nor for any loss or damage including without limitation to any loss of profit which may arise from reliance on any information supplied by Everest Fortune Group.

Bearish drop off 38.2% Fibonacci resistance?EUR/USD is rising towards the resistance level which is a pullback resistance that line sup with the 38.2% Fibonacci retracement and could drop from this level to our take profit.
Entry: 1.0833
Why we like it:
There is a pullback resistance level that lines up with the 38.2% Fibonacci retracement.
Stop loss: 1.0884
Why we like it:
There is a pullback resistance level that lines up with the 61.8% Fibonacci retracement.
Take profit: 1.0706
Why we like it:
There is a pullback support level that lines up with the 38.2% Fibonacci retracement.
Enjoying your TradingView experience? Review us!
Please be advised that the information presented on TradingView is provided to Vantage (‘Vantage Global Limited’, ‘we’) by a third-party provider (‘Everest Fortune Group’). Please be reminded that you are solely responsible for the trading decisions on your account. There is a very high degree of risk involved in trading. Any information and/or content is intended entirely for research, educational and informational purposes only and does not constitute investment or consultation advice or investment strategy. The information is not tailored to the investment needs of any specific person and therefore does not involve a consideration of any of the investment objectives, financial situation or needs of any viewer that may receive it. Kindly also note that past performance is not a reliable indicator of future results. Actual results may differ materially from those anticipated in forward-looking or past performance statements. We assume no liability as to the accuracy or completeness of any of the information and/or content provided herein and the Company cannot be held responsible for any omission, mistake nor for any loss or damage including without limitation to any loss of profit which may arise from reliance on any information supplied by Everest Fortune Group.

Euro can drop to 1.0650 points, breaking support levelHello traders, I want share with you my opinion about Euro. Earlier, the price was moving inside a range, bouncing between the boundaries and forming a buyer zone near the lower support area. After several rebounds, EUR started to grow and eventually broke out from the range, making a strong upward impulse. The growth continued with a breakout through the support level, which later turned into a support area. From there, the price continued its bullish trend, but after touching the resistance line, it turned around and entered a correction phase. Over the last few sessions, Euro has been forming a pennant pattern, trading between the resistance line and the support line. Now the price is consolidating near the apex of the pennant, showing weak momentum. I expect a false breakout to the upside, followed by a sharp decline from the resistance line. In this scenario, the price would likely break through the current support area and move toward the 1.0650 points - this is my TP1. Given the recent price structure, the correction phase, and the weakening bullish pressure, I remain bearish and anticipate further decline. Please share this idea with your friends and click Boost 🚀

Bearish drop?The Fiber (EUR/USD) has reacted off the pivot and could drop to the 1st support.
Pivot: 1.0835
1st Support: 1.0722
1st Resistance: 1.0911
Risk Warning:
Trading Forex and CFDs carries a high level of risk to your capital and you should only trade with money you can afford to lose. Trading Forex and CFDs may not be suitable for all investors, so please ensure that you fully understand the risks involved and seek independent advice if necessary.
Disclaimer:
The above opinions given constitute general market commentary, and do not constitute the opinion or advice of IC Markets or any form of personal or investment advice.
Any opinions, news, research, analyses, prices, other information, or links to third-party sites contained on this website are provided on an "as-is" basis, are intended only to be informative, is not an advice nor a recommendation, nor research, or a record of our trading prices, or an offer of, or solicitation for a transaction in any financial instrument and thus should not be treated as such. The information provided does not involve any specific investment objectives, financial situation and needs of any specific person who may receive it. Please be aware, that past performance is not a reliable indicator of future performance and/or results. Past Performance or Forward-looking scenarios based upon the reasonable beliefs of the third-party provider are not a guarantee of future performance. Actual results may differ materially from those anticipated in forward-looking or past performance statements. IC Markets makes no representation or warranty and assumes no liability as to the accuracy or completeness of the information provided, nor any loss arising from any investment based on a recommendation, forecast or any information supplied by any third-party.

EURUSDBuy Eurusd
Entry: 1.08032
SL: 1.08017 or 1.08016
TP; 1.08077
Your reward is 3 times greater than your risk.

EURUSD Forming the new long-term Top.The EURUSD pair continues to trade within a Bullish Megaphone pattern and is about to complete today the 4th straight red 1D candle.
This is technically a top formation as the 1D RSI went from overbought (above 70.00) to below 60.00. Technically a downtrend gets confirmed when the price breaks below the 1D MA50 (blue trend-line) so until it does, the probability for another short-term bounce there isn't small. This is what took place in September 2024.
Once the 1D MA50 breaks though, we expect a test of Support 1 at 1.03650, as it happened on October 23 2024.
-------------------------------------------------------------------------------
** Please LIKE 👍, FOLLOW ✅, SHARE 🙌 and COMMENT ✍ if you enjoy this idea! Also share your ideas and charts in the comments section below! This is best way to keep it relevant, support us, keep the content here free and allow the idea to reach as many people as possible. **
-------------------------------------------------------------------------------
Disclosure: I am part of Trade Nation's Influencer program and receive a monthly fee for using their TradingView charts in my analysis.
💸💸💸💸💸💸
👇 👇 👇 👇 👇 👇

EUR/USD LONG 4H
Hello, I am Forex Trader Andrea Russo, and today I want to share with you a strategy I have adopted for a position on EUR/USD. I will analyze the reasoning behind my choice and the setup I am using to maximize opportunities, minimizing risk.
The trade setup
I decided to enter EUR/USD with an entry level at 1.08483, setting a stop loss (SL) at 1.08095 and a take profit (TP) at 1.0944. This trade is based on a series of technical and fundamental factors that suggest a probable continuation of the upward movement.
Technical analysis
My decision is supported by some key technical signals:
Uptrend: The EUR/USD cross has shown good recent strength, supported by a series of higher lows.
Support at 1.08095: The SL level has been set below the main support to protect the trade from a potential reversal.
Resistance at 1.0944: The TP was calculated based on a major resistance level that could serve as a target for a significant upside move.
Fundamental Analysis
From a fundamental perspective, there are several elements that are positively influencing EUR/USD:
Divergent monetary policies: The prospect of more hawkish ECB policies versus the Fed is supporting the euro.
Macroeconomic factors: Recent data on economic growth expectations in the eurozone provide a favorable backdrop for the cross to rise.
Risk/reward ratio
With a stop loss set at 1.08095 and a take profit at 1.0944, the risk/reward ratio of this trade is optimal, standing at around 1:2. This setup allows you to contain your risk and aim for a significant gain.
Trade Management
Once the position is opened, I will monitor the market movements and keep an eye on key indicators to assess any adjustments. If prices move quickly towards the TP, I may consider partially closing the position to protect profits.
Conclusion
This trade represents an interesting opportunity in a dynamic and variable market. Risk management remains the cornerstone of any winning strategy, and with a well-calculated setup like this, we aim to make the most of market conditions.

EURUSD Potential DownsidesHey Traders, in today's trading session we are monitoring EURUSD for a selling opportunity around 1.08500 zone, EURUSD is trading in a downtrend and currently is in a correction phase in which it is approaching the trend at 1.08500 support and resistance area.
Trade safe, Joe.

EURUSD Channel Down bottomed. Short term buy.EURUSD is trading inside a (1h) Channel Down pattern, which just reached its bottom.
Last time that happened, the market rallied by 1.25%.
Trading Plan:
1. Buy on the current market price.
Targets:
1. 1.09200 (+1.25%).
Tips:
1. The RSI (1h) is trading on higher lows, which is a bullish divegernce in contrast to the price's lower lows. Standard bottom signal.
Please like, follow and comment!!

Bearish reversal?EUR/USD is rising towards the resistance level which is a pullback resistance that aligns with the 50% Fibonacci retracement and could drop from this level to our take profit.
Entry: 1.0871
Why we like it:
There is a pullback resistance level that lines up with the 50% Fibonacci retracement.
Stop loss: 1.0911
Why we like it:"
There is an overlap resistance level.
Take profit: 1.0809
Why we like it:
There is a pullback support level.
Enjoying your TradingView experience? Review us!
Please be advised that the information presented on TradingView is provided to Vantage (‘Vantage Global Limited’, ‘we’) by a third-party provider (‘Everest Fortune Group’). Please be reminded that you are solely responsible for the trading decisions on your account. There is a very high degree of risk involved in trading. Any information and/or content is intended entirely for research, educational and informational purposes only and does not constitute investment or consultation advice or investment strategy. The information is not tailored to the investment needs of any specific person and therefore does not involve a consideration of any of the investment objectives, financial situation or needs of any viewer that may receive it. Kindly also note that past performance is not a reliable indicator of future results. Actual results may differ materially from those anticipated in forward-looking or past performance statements. We assume no liability as to the accuracy or completeness of any of the information and/or content provided herein and the Company cannot be held responsible for any omission, mistake nor for any loss or damage including without limitation to any loss of profit which may arise from reliance on any information supplied by Everest Fortune Group.

EUR | USD THE DOLLAR SHAKES, THE EURO DANCES with PipGuardEUR | USD THE DOLLAR SHAKES, THE EURO DANCES with PipGuard
IF YOU LIKE MY ANALYSIS, CONGRATS, YOU’RE SMART.
NOW HIT THAT FOLLOW BUTTON, DROP A BOOST, AND LEAVE A COMMENT.
Come on, don’t be shy, those buttons won’t wear out. Support free and independent analysis, because if you want me to keep dropping these market gems, you gotta show some love. Otherwise, you’ll see me opening a shaved ice stand. 🍧
GOOD MORNING, DEAR NON-FRIENDS!
Yeah, because if you were my friends, we’d be throwing death stares at each other by the coffee machine every time someone dared to question my analysis. But instead, here I am—calm, composed, and totally not petty.
Today, we’re talking about EUR/USD. But first, a challenge: SHOW ME ANOTHER ANALYSIS FROM NOVEMBER THAT'S STILL ACCURATE TODAY.
Go check the related article. Do yourself a favor, so maybe you’ll stop busting my chops at the coffee machine. Oh, by the way, got a spare euro? No? Alright, no analysis for you.
Just kidding, just kidding. I know you’re smart, humble, and definitely not thin-skinned… or at least, I hope so, otherwise, get ready for another lawsuit.
Anyway, let’s be clear—my analysis is NOT financial advice.
No, you don’t need to mortgage your house and bet it all. Also, let’s be real, you don’t even have one! 😆
LET’S GET TO THE POINT.
Back in November, I called the U.S. recession.
Guess who didn’t call me? Bloomberg.
Guess who did? An investment fund.
And guess how it went? Badly. My spoken English is worse than a drunk tourist trying to order a beer in a London pub, so I panicked and hung up. 📞❌
Unless you want to talk money 💰 or women 💃, don’t call me. Write me. But again—only for money or women, not for emotional support. I’m not your therapist.
EUROPE, REARMAMENT, AND THE CIRCUS OF POWER.
Same old show:
The tall blond guy with the orange face? Check.
The bald dude in the tie? Still there.
The political circus? In full swing. 🎭
But let’s cut to the chase: if you’re in the Eurozone, BUY A HOUSE.
I did— 180K for 122 square meters of prime real estate. Solid deal.
And why?
Because the euro is set to rise. 📈
Because Russia is in an economic lockdown.
Because when sanctions lift, we’ll likely see a mini Russian market collapse.
And the dollar? The U.S. is reliving 2008, but this time, it’s even dumber.
What’s different? Instead of subprime mortgages, now it’s credit card debt spiraling out of control.
Yes, you heard me. Americans are sinking their economy with loans for iPhones, 85-inch TVs, and vacations to Hawaii.
And banks?
“No worries, the debt is under control.”
Oh yeah? So if you’re 100K in debt for a house, that’s a crisis, but if you blow 100K on home decor and luxury junk, that’s fine? Make it make sense.
But who cares—I’m Italian, I eat pasta for breakfast. 🍝 Their problem, not mine.
NOW, THE TECHNICAL ANALYSIS.
Trend is BULLISH, get that in your head. Look for long setups, not shorts. If you must short, do it only for retracements.
Reversal zone: 1.082 – 1.095.
If it closes above, we keep going up.
Watch out for liquidity between 1.099 and 1.10.
If price gets there, look for a key level on the 4H. If it reacts bearish, wait for confirmation before shorting. If it closes above, we send it to 1.21.
Other key support levels:
1.076 – 1.062, solid area for bullish reaction.
If that’s not enough, 1.060 – 1.052 is the ultimate buy zone.
If you mess up, toss your PC. 💻🔥
Kidding. Hold on tight, because price is going up from there.
IF MY ANALYSIS HELPED YOU, HIT FOLLOW, DROP A BOOST, LEAVE A COMMENT.
Or else… I’ll have to come find you.
Much love, PipGuard.

EURUSD: Big Bearish Divergence on 4H.EURUSD is bullish on its 1D technical outlook (RSI = 66.538, MACD = -0.013, ADX = 29.911) but just crossed under the 4H MA50 for the first time since the March 3rd 2025 breakout when the parabolic rally started. The strongest sell signal is nonetheless given by the 4H RSI which, while the price is on a Channel Up, it has been on a Channel Down, i.e. a Bearish Divergence. The previous time an uptrend broke below its 4H MA50 on the same RSI Bearish Divergence was on the September 30th 2024 High. The result was a strong bearish breakdown to the S1 level. Consequently, we can turn bearish here and aim a little higher than S1 (TP = 1.0400).
## If you like our free content follow our profile to get more daily ideas. ##
## Comments and likes are greatly appreciated. ##

EUR/USD Trade Ideas Short or Long??? News is going to be heavy!Looking for the right signals for a long, Everything is explained on the chart. If I do not get the confluences I want I will not take the trade. If price action takes out lows I'll look for liquidity, retrace, or reversal and reaccess my trade for shorts. Major news coming out for USD this week so stay frosty!
