Bearish reversal?EUR/USD is rising towards the resistance level which is an overlap resistance that aligns with the 50% Fibonacci retracement and could drop from this level to our take profit.
Entry: 1.0887
Why we like it:
There is an overlap resistance level that aligns with the 50% Fibonacci retracement.
Stop loss: 1.0947
Why we like it:
There is a pullback resistance level.
Take profit: 1.0809
Why we like it:
There is a pullback support level.
Enjoying your TradingView experience? Review us!
Please be advised that the information presented on TradingView is provided to Vantage (‘Vantage Global Limited’, ‘we’) by a third-party provider (‘Everest Fortune Group’). Please be reminded that you are solely responsible for the trading decisions on your account. There is a very high degree of risk involved in trading. Any information and/or content is intended entirely for research, educational and informational purposes only and does not constitute investment or consultation advice or investment strategy. The information is not tailored to the investment needs of any specific person and therefore does not involve a consideration of any of the investment objectives, financial situation or needs of any viewer that may receive it. Kindly also note that past performance is not a reliable indicator of future results. Actual results may differ materially from those anticipated in forward-looking or past performance statements. We assume no liability as to the accuracy or completeness of any of the information and/or content provided herein and the Company cannot be held responsible for any omission, mistake nor for any loss or damage including without limitation to any loss of profit which may arise from reliance on any information supplied by Everest Fortune Group.
Eur-usd

EUR/USD Triangle Pattern (13.3.25)The EUR/USD Pair on the M30 timeframe presents a Potential Selling Opportunity due to a recent Formation of a Triangle Pattern. This suggests a shift in momentum towards the downside in the coming hours.
Possible Short Trade:
Entry: Consider Entering A Short Position around Trendline Of The Pattern.
Target Levels:
1st Support – 1.0805
2nd Support – 1.0771
🎁 Please hit the like button and
🎁 Leave a comment to support for My Post !
Your likes and comments are incredibly motivating and will encourage me to share more analysis with you.
Best Regards, KABHI_TA_TRADING
Thank you.

EURUSD: Overbought but 1H Channel Up is still intact.EURUSD is massively overbought on its 1D technical outlook (RSI = 73.384, MACD = 0.012, ADX = 38.553) but on the short term we have a Channel Up pattern that's good until broken. The 1H MA50-MA100 Zone is in firm support of this structure and every time a bearish wave like the current one bottoms inside this pattern, the price rallies by +1.15%. So as long as the 1H MA100 holds, buy (TP = 1.09800). If the 1H MA100 fails and breaks, sell and aim for the 1H MA200 (TP = 1.07500>
## If you like our free content follow our profile to get more daily ideas. ##
## Comments and likes are greatly appreciated. ##

EUR/USD is shaping up for a solid short entry.EUR/USD is shaping up for a solid short entry. 🤔🤔🤔
The pair has tested the 61.8% Fibonacci retracement level and a key liquidity zone where stop losses tend to cluster.
At the same time, the dollar index is turning upward on a larger scale.
A short position with tight stops could make sense, with a target around $1.00 .
Considering the increasing geopolitical risks in Europe , holding funds in euros doesn’t seem wise anymore.
In times like these, staying in USD looks like the safest bet.
Dollar Index:
SP500/SPY:
GOLD/USD:

EURUSD entering multiyear Sell Zone, but might go to 1.160 firstEURUSD hit this week its 1month MA50 for the first time since October 2024. This is the first long term Sell Zone for the pair.
The 1month MA50 - MA100 Zone has formed the last two major peaks of the market (September 2024 and July 2023), so it is highly likely to see a top getting formed here in March-April.
Since however the 10year pattern is a Channel Down and the major bullish wave in 2017 was +21.67%, there is a possibility to see an overextension of the trend a little higher than the 1month MA100.
A max +21.67% rise would take the price a little over 1.1600, which would approach the 1month MA200 (10year Resistance).
This scenario is also supported by the 1month RSI, which during this 10 year span has topped twice at 665.00 and as you see makes a very distinct (nearly) Double Top formation.
In both cases, long term traders/ investors may target below parity prices at around 0.9000.
Follow us, like the idea and leave a comment below!!

EURUSD PoVIn recent months, inflation data in both Europe and the United States has shown contrasting trends, creating an uncertain outlook for the EUR/USD pair. In Europe, inflation has remained relatively stable, but with signs of a slight increase, while in the United States, there has been a more pronounced rise in consumer prices. This scenario has prompted the European Central Bank and the Federal Reserve to carefully assess their respective monetary policies, with potential interest rate hikes in the future. At the same time, recent trade policies under U.S. President Donald Trump have added further volatility to the currency market. In February 2025, Trump imposed significant tariffs on imports from Mexico, Canada, and China, raising global concerns. The European Union criticized the Trump administration for not engaging in negotiations to avoid such tariffs, increasing trade tensions. Trump's actions, including the introduction of a universal 10% tariff on all imports and a 100% tariff on cars produced abroad, have raised questions about their effectiveness in strengthening the U.S. economy and reducing the trade deficit. If these policies do not produce the expected results, we could see the dollar weaken, with the EUR/USD pair potentially surpassing the 1.09300 level, a liquidity intersection point. On the other hand, if Trump's measures prove effective in improving the trade balance and supporting the economy, the dollar could strengthen, pushing the EUR/USD pair towards parity. In summary, the future direction of the EUR/USD pair appears uncertain, influenced by central bank policies and U.S. trade strategies, with potential significant movements depending on the effectiveness of these measures.

EURUSD Potential UpsidesHey Traders, in today's trading session we are monitoring EURUSD for a buying opportunity around 1.08000 zone, EURUSD is trading in an uptrend and currently is in a correction phase in which it is approaching the trend at 1.08000 support and resistance area.
Trade safe, Joe.

EURUSD on its 1W MA200 after 5 months.The EURUSD pair hit on Friday its 1W MA200 (orange trend-line) for the first time in 5 months (since October 03 2024). This is a major Resistance level which initiated a strong -4.00% decline on December 28 2023.
In fact -4.00% declines have been quite common for EURUSD in the past 2 years. However, the pair's strongest Resistance level has been the 1M MA100 (red trend-line) which has formed both market tops on October 01 2024 and July 18 2023.
As a result, the most optimal sell entry would be when the 1W RSI hits its Resistance Zone, with the price probably close to the 1M MA100 within the Lower Highs Zone. On the long-term, the R/R has shifted dramatically in favor of selling right now. If the rejection does happen on the 1W MA200 eventually and won't close any 1W candle above it, we have a short-term Target at 1.04600 (-4.00% decline) and if the rejection takes place higher, we will be expecting a bottom near parity with a technical Target at 1.00500 (Lower Lows Zone).
-------------------------------------------------------------------------------
** Please LIKE 👍, FOLLOW ✅, SHARE 🙌 and COMMENT ✍ if you enjoy this idea! Also share your ideas and charts in the comments section below! This is best way to keep it relevant, support us, keep the content here free and allow the idea to reach as many people as possible. **
-------------------------------------------------------------------------------
Disclosure: I am part of Trade Nation's Influencer program and receive a monthly fee for using their TradingView charts in my analysis.
💸💸💸💸💸💸
👇 👇 👇 👇 👇 👇

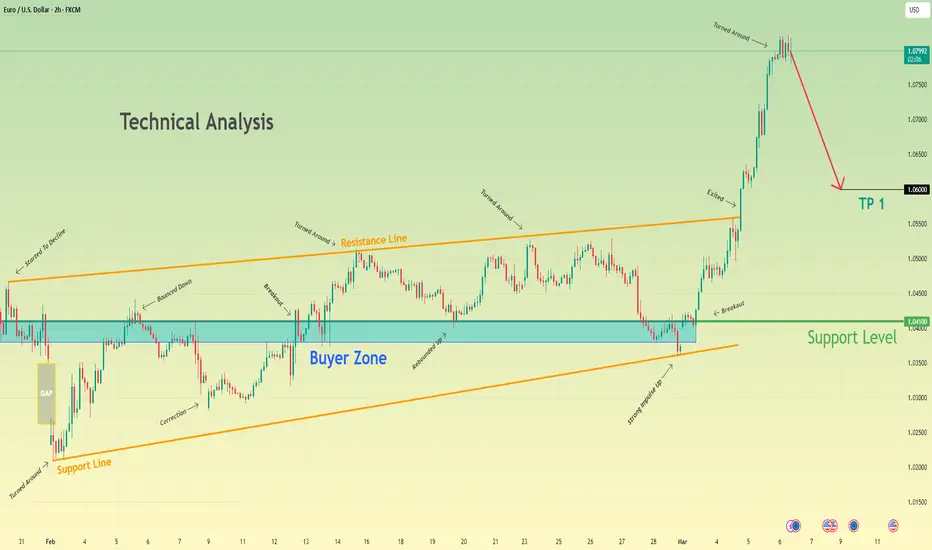
After strong impulse up, Euro makes correction to 1.0600 pointsHello traders, I want share with you my opinion about Euro. Looking at the chart, we can see that the price entered a wedge formation and immediately started to decline. The Euro broke through the 1.0410 level, creating a strong gap before reaching the wedge's support line and beginning to rise. In a short time, it climbed back to the support level and attempted to break it but failed, pulling back slightly. After that, the Euro returned to the 1.0410 support level and finally managed to break through. Following this move, it reached the resistance line of the wedge and made a correction down to the support level. Then, the Euro pushed back up to the resistance line, consolidating near it for a while before dropping to the buyer zone, where it later touched the wedge’s support line again. From there, it made a strong upward impulse, breaking the 1.0410 level once more, exiting the wedge, and surging to 1.0820. However, more recently, the price reversed and started to decline. I believe the Euro may enter a corrective phase after such a strong upward move. Based on this, my TP is set at 1.0600 points. Please share this idea with your friends and click Boost 🚀
Could the Fiber reverse from here?The price is reacting off the pivot and could reverse to the 1st support.
Pivot: 1.0783
1st Support: 1.0598
1st Resistance: 1.1007
Risk Warning:
Trading Forex and CFDs carries a high level of risk to your capital and you should only trade with money you can afford to lose. Trading Forex and CFDs may not be suitable for all investors, so please ensure that you fully understand the risks involved and seek independent advice if necessary.
Disclaimer:
The above opinions given constitute general market commentary, and do not constitute the opinion or advice of IC Markets or any form of personal or investment advice.
Any opinions, news, research, analyses, prices, other information, or links to third-party sites contained on this website are provided on an "as-is" basis, are intended only to be informative, is not an advice nor a recommendation, nor research, or a record of our trading prices, or an offer of, or solicitation for a transaction in any financial instrument and thus should not be treated as such. The information provided does not involve any specific investment objectives, financial situation and needs of any specific person who may receive it. Please be aware, that past performance is not a reliable indicator of future performance and/or results. Past Performance or Forward-looking scenarios based upon the reasonable beliefs of the third-party provider are not a guarantee of future performance. Actual results may differ materially from those anticipated in forward-looking or past performance statements. IC Markets makes no representation or warranty and assumes no liability as to the accuracy or completeness of the information provided, nor any loss arising from any investment based on a recommendation, forecast or any information supplied by any third-party.

Bearish reversal off pullback resistance?EUR/USD is reacting off the resistance which is a pullback resistance that lines up with the 138.2% Fibonacci extension and could reverse from this level to our take profit.
Entry: 1.0788
Why we like it:
There is a pullback resistance that aligns with the 138.2% Fibonacci extension.
Stop loss: 1.0954
Why we like it:
There is a pullback resistance that is slightly above the 71% Fibonacci retracement.
Take profit: 1.0616
Why we like it:
There is an overlap support level that lines up with the 50% Fibonacci retracement.
Enjoying your TradingView experience? Review us!
Please be advised that the information presented on TradingView is provided to Vantage (‘Vantage Global Limited’, ‘we’) by a third-party provider (‘Everest Fortune Group’). Please be reminded that you are solely responsible for the trading decisions on your account. There is a very high degree of risk involved in trading. Any information and/or content is intended entirely for research, educational and informational purposes only and does not constitute investment or consultation advice or investment strategy. The information is not tailored to the investment needs of any specific person and therefore does not involve a consideration of any of the investment objectives, financial situation or needs of any viewer that may receive it. Kindly also note that past performance is not a reliable indicator of future results. Actual results may differ materially from those anticipated in forward-looking or past performance statements. We assume no liability as to the accuracy or completeness of any of the information and/or content provided herein and the Company cannot be held responsible for any omission, mistake nor for any loss or damage including without limitation to any loss of profit which may arise from reliance on any information supplied by Everest Fortune Group.

EURUSD Rejection expected that will take it to parity.EURUSD crossed above its MA200 (1d) and is headed for the top of the long term Channel Down.
A rejection similar to September 2024 is highly likely (which pulled the price to the 1.382 Fib), especially since this week's rise has been huge and based solely on geopolitics.
Trading Plan:
1. Sell on the current market price.
Targets:
1. 1.000 (the 1.382 Fibonacci extension).
Tips:
1. The RSI (1d) is overbought. The last time it was this high was on August 23rd 2024. Exactly on the last Lower High of the Channel Down.
Please like, follow and comment!!

EURUSD Channel Up testing 1D MA200 after 4 months!The EURUSD pair has been trading within a Channel Up since the January 13 Low and after the 1D MA50 (blue trend-line) bounce, the current Bullish Leg is testing the 1D MA200 (orange trend-line).
This is the first 1D MA200 test since November 06 2024 and happens to be at the top of the Channel Up with the 1D RSI almost overbought (70.00). These conditions create a low risk opportunity for a short-term Sell. Our Target is the bottom of the Channel Up and the 1D MA50 at 1.04500.
-------------------------------------------------------------------------------
** Please LIKE 👍, FOLLOW ✅, SHARE 🙌 and COMMENT ✍ if you enjoy this idea! Also share your ideas and charts in the comments section below! This is best way to keep it relevant, support us, keep the content here free and allow the idea to reach as many people as possible. **
-------------------------------------------------------------------------------
Disclosure: I am part of Trade Nation's Influencer program and receive a monthly fee for using their TradingView charts in my analysis.
💸💸💸💸💸💸
👇 👇 👇 👇 👇 👇

EURUSD: Channel Up has topped. Sell signal.EURUSD is bullish on its 1D technical outlook (RSI = 62.145, MACD = 0.003, ADX = 17.266) and overbought on the lower timeframes with the 4H RSI in particular above 75.000. The Channel Up that started on the February 2nd low had every HH pull back to its 0.618 Fib level. Consequently we are short on the short term (TP = 1.04500). If the price crosses under this 1 month Channel Up, the longer Channel Up should push even lower to the 0.786 Fib of the greater bullish wave (TP = 1.03000).
## If you like our free content follow our profile to get more daily ideas. ##
## Comments and likes are greatly appreciated. ##

EURUSD 3-7 Mar 2025 W10 - Weekly Analysis- EU Rate - US NFP WeekThis is my Weekly analysis on EURUSD for 3-7 Mar 2025 W10 based on Smart Money Concept (SMC) which includes the following:
Market Sentiment
Weekly Chart Analysis
Daily Chart Analysis
4H Chart Analysis
Economic Events for the Week
Market Sentiment
The EUR/USD pair faces a slightly bearish bias this week, driven by key economic events, geopolitical risks, and trade uncertainties.
Key Events to Watch:
🔹 ECB Interest Rate Decision (March 6) – Markets expect a 25 bps rate cut to 2.50%. A dovish ECB could pressure the euro, while any hints of a pause may provide support.
🔹 U.S. Non-Farm Payrolls (March 7) – Forecast at +133K jobs, with unemployment steady at 4.0%. Weak data could weigh on the USD, while stronger payrolls and wage growth may boost it.
🔹 Trump’s Tariffs & Trade War Risks – New U.S. tariffs on Mexico, Canada, and China take effect March 4, with potential auto tariffs on Europe looming. These policies favor the dollar by driving risk-off sentiment.
🔹 Geopolitical Tensions – U.S.-Ukraine relations deteriorated after a public Oval Office clash between Trump and Zelenskiy. Further instability could impact investor confidence and increase safe-haven demand for the USD.
Trading Strategy:
✅ Bearish Scenario: A dovish ECB, strong U.S. NFP, and escalating trade risks could push EUR/USD down.
✅ Bullish Scenario: If the ECB signals a rate-cut pause and U.S. jobs data disappoint, EUR/USD may test 1.055–1.06 .
Overall, the fundamental backdrop leans in favor of the USD, but volatility is expected, especially around the ECB and NFP releases. Traders should stay alert to geopolitical developments and tariff announcements that may shift sentiment.
Weekly Chart Analysis
1️⃣
🔹Swing Bearish
🔹Internal Bearish (Pullback Phase)
🔹In Swing Discount
🔹Swing Continuation Phase (Pro Swing + Pro Internal)
2️⃣
🔹INT structure continuing bearish with iBOS following the Bearish Swing. (End of 2023 till end of 2024 was a pullback phase after the first bearish iBOS)
3️⃣
🔹After the bearish iBOS we expect a pullback, price tapped into Monthly Demand and the liquidity below Nov 2022 which is above the weekly demand formed with the initiation of the bearish iBOS pullback phase.
🔹Price made a bullish CHoCH which indicated that the liquidity was enough as per previous weeks analysis to initiate a pullback phase for the bearish iBOS.
🔹Price pulled back after the Bullish CHoCH to the Weekly Demand formed and showed reaction after volatile week.
🔹With the previous week Bearish close, weekly is consolidating between 1.05xx and 1.02xx
🔹Still the recent Bullish Fractal and Demand holding but failed to break the high (1.0533) so there is a probability to target the low 1.0285/10 and could extend to continue the Bearish INT Structure with iBOS.
Daily Chart Analysis
1️⃣
🔹Swing Bearish
🔹INT Bearish
🔹Swing Continuation Phase (Pro Swing + Pro Internal)
2️⃣
🔹Following the Bearish Swing BOS, INT Structure continuing bearish tapping the weekly demand zone.
3️⃣
🔹After the failure to close below the Weak INT Low, price continued bullish sweeping the liquidity above Dec 30 and mitigating a Daily supply zone within the INT Structure Premium Zone.
🔹With the mitigation of the Daily supply, price created a Bearish CHoCH signaling the end of the Pullback Phase of the INT structure and the start of the Bearish move targeting the Weak INT Low.
🔹Price failed for the 2nd time to close below the Weak INT Low after mitigating the Daily Demand formed from the failure to close below the Weak INT Low which triggered aggressive Bullish reaction and mitigating the Daily Supply Zone formed from the recent Bearish CHoCH.
🔹After Supply mitigation, price continued Bearish following the Bearish INT Structure continuation phase.
🔹With the Weekly is consolidating the Daily consolidation range showing that we are failing to continue Bullish and with the recent Bearish CHoCH we are back to the Bearish INT Structure continuation and we may target the Weak INT Low (At least 1.0285).
🔹Price could pullback to the recent Daily Supply before continuing down.
🔹Expectation is set to Bearish with cautious of the Liq. built above 1.05333 and the range we are in.
4H Chart Analysis
1️⃣
🔹Swing Bullish (Reached Swing Extreme Demand)
🔹INT Bearish (Adjusted my INT structure to align with the previous Bullish move)
🔹Complex Swing INT Structure
2️⃣
🔹As the Swing is Bullish, expectations were set to continue Bullish targeting the Weak Swing High and create a Bullish BOS after the Deep Pullback to the Swing Demand.
🔹During the Swing Bullish Continuation after the Deep Pullback, INT Structure kept holding Bullish to fulfill the Bullish continuation phase.
🔹With price reaching the Swing Extreme Premium zone and the expectation of breaking the Weak Swing High, price failed 2 times and with the 3rd attempt it created a Bearish iBOS. This indicated that the Swing INT structure is Complex and the Daily/Weekly TFs are still in play.
3️⃣
🔹After the Bearish iBOS, we expect PB, there is no clear POI for price to initiate PB except the Liq. at 1.03730 which was swept on Friday and 1.03173 before mitigating the last clear 4H Demand.
🔹With the recent Bearish iBOS, the PB could start at anytime. The Liq. swept from 1.0373 could provide that PB otherwise we will continue Bearish till the clear 4H Demand (Which I doubt that it could provide the continuation) but with LTF shifting Bullish, we can follow that.
Economic Events for the Week

EURUSD Potential DownsidesHey Traders, in the coming week we are monitoring EURUSD for a selling opportunity around 1.04200 zone, EURUSD is trading in a downtrend and currently is in a correction phase in which it is approaching the trend at 1.04200 support and resistance area.
Trade safe, Joe.

EURUSD - Bullish No More!Hello TradingView Family / Fellow Traders. This is Richard, also known as theSignalyst.
📈 EURUSD has been overall bullish, trading within the rising channel, however it is currently retesting the upper bound of the channel.
Moreover, the red zone is the upper bound of its weekly range.
🏹 Thus, the highlighted red circle is a strong area to look for sell setups as it is the intersection of the structure and upper red trendline acting as a non-horizontal resistance.
📚 As per my trading style:
As #EURUSD approaches the red circle, I will be looking for bearish reversal setups (like a double top pattern, trendline break , and so on...)
📚 Always follow your trading plan regarding entry, risk management, and trade management.
Good luck!
All Strategies Are Good; If Managed Properly!
~Rich
Disclosure: I am part of Trade Nation's Influencer program and receive a monthly fee for using their TradingView charts in my analysis.

EURUSD 28 Feb 2025 W9 -Intraday Analysis- US PCE Day! EOM FlowsThis is my Intraday analysis on FOREXCOM:EURUSD for 28 Feb 2025 W9 based on Smart Money Concept (SMC) which includes the following:
Market Sentiment
4H Chart Analysis
15m Chart Analysis
Market Sentiment
Heavy economic news:
EU : German Prelim CPI m/m
US : the most awaited report Core PCE Price Index m/m - Personal Spending m/m - Chicago PMI
The market sentiment detailed as following:
Trump's Tariff Announcements:
President Trump's announcements regarding new and increased tariffs significantly impacted market sentiment. Uncertainty surrounding trade relations with various countries, including the European Union, Mexico, and Canada, created volatility.
These tariff announcements created fears of trade wars, which negatively impacted investor confidence.
Economic Data:
Reports of declining new home sales in the U.S. and concerns about overall economic health contributed to market unease.
Also, the release of various economic data points, and the anticipation of the PCE inflation data release, influenced market movement.
NVIDIA's Performance and AI Competition:
While NVIDIA beat earnings estimates, concerns about increased competition from Chinese AI companies, particularly DeepSeek, led to a significant drop in its stock price, impacting the broader tech sector.
Geopolitical Uncertainty:
Geopolitical factors, such as the removal of Chevron's oil license in Venezuela, contributed to fluctuations in commodity prices, particularly oil.
Bank of Japan governor Ueda's statements regarding the uncertainty of US policies also added to uncertainty.
Additional Factors:
Geopolitical Resolution: A sudden de-escalation in a prior crisis (e.g., eased tensions in a conflict zone) might have reduced safe-haven demand for gold, though this was secondary to dollar strength.
Technical Factors: End-of-month rebalancing or options expirations could have amplified downward moves.
The interplay of a hawkish Fed, a resilient dollar, and risk aversion triggered broad-based declines. The overarching theme was a recalibration of investor expectations around tighter monetary policy and its implications for global growth and asset valuations.
4H Chart Analysis
1️⃣
🔹Swing Bullish (Reached Swing Extreme Demand)
🔹INT Bearish (Adjusted my INT structure to align with the previous Bullish move)
🔹Complex Swing INT Structure
2️⃣
🔹As the Swing is Bullish, expectations were set to continue Bullish targeting the Weak Swing High and create a Bullish BOS after the Deep Pullback to the Swing Demand.
🔹During the Swing Bullish Continuation after the Deep Pullback, INT Structure kept holding Bullish to fulfill the Bullish continuation phase.
🔹With price reaching the Swing Extreme Premium zone and the expectation of breaking the Weak Swing High, price failed 2 times and with the 3rd attempt it created a Bearish iBOS. This indicated that the Swing INT structure is Complex and the Daily/Weekly TFs are still in play.
3️⃣
🔹After the Bearish iBOS, we expect PB, there is no clear POI for price to initiate PB except the Liq. at 1.03730 and 1.03173 before mitigating the last clear 4H Demand.
🔹It’s not a must to reach these Liq. points as we already in a Daily partially mitigated Demand Zone and maybe some orders reside there. But Will need LTFs to show clear Bullish OF to confirm the 4H Bearish INT structure is staring the PB.
🔹Expectations is set to Bearish continuation till we have a clear Bullish OF. Also, keep in mind that Daily and Weekly are still Bearish and we may target the 4H Strong Swing Low to fulfill the Daily and Weekly move.
15m Chart Analysis
1️⃣
🔹Swing Bearish
🔹INT Bearish
🔹Swing Pullback
2️⃣
🔹Swing structure turned Bearish with confirmed BOS. And after BOS we expect PB phase to start.
🔹We didn’t mitigate any HP POI/Liq. to initiate the Swing PB phase.
🔹Will need a clear INT Structure shift to Bullish with momentum in order to play the PB phase otherwise price will continue Bearish till the sweep of Liq. on the 4H TF at 1.03730 and 1.03173 before tapping the clear 4H Demand.
3️⃣
🔹Expectations is set to continue Bearish with cautious from the Swing PB phase that can start at any time.
🔹Also keep in mind the End of Month Flows and PCE report today.

Bullish bounce off 61.8% Fibonacci support?The Fiber (EUR/USD) is falling towards the pivot and could bounce to the 1st resistance.
Pivot: 1.0373
1st Support: 1.0325
1st Resistance: 1.0464
Risk Warning:
Trading Forex and CFDs carries a high level of risk to your capital and you should only trade with money you can afford to lose. Trading Forex and CFDs may not be suitable for all investors, so please ensure that you fully understand the risks involved and seek independent advice if necessary.
Disclaimer:
The above opinions given constitute general market commentary, and do not constitute the opinion or advice of IC Markets or any form of personal or investment advice.
Any opinions, news, research, analyses, prices, other information, or links to third-party sites contained on this website are provided on an "as-is" basis, are intended only to be informative, is not an advice nor a recommendation, nor research, or a record of our trading prices, or an offer of, or solicitation for a transaction in any financial instrument and thus should not be treated as such. The information provided does not involve any specific investment objectives, financial situation and needs of any specific person who may receive it. Please be aware, that past performance is not a reliable indicator of future performance and/or results. Past Performance or Forward-looking scenarios based upon the reasonable beliefs of the third-party provider are not a guarantee of future performance. Actual results may differ materially from those anticipated in forward-looking or past performance statements. IC Markets makes no representation or warranty and assumes no liability as to the accuracy or completeness of the information provided, nor any loss arising from any investment based on a recommendation, forecast or any information supplied by any third-party.

Bullish bounce off 61.8% Fibonacci support?EUR/USD is falling towards the support level which is a pullback support that aligns with the 61.8% Fibonacci retracement and could bounce from this level to our take profit.
Entry: 1.0376
Why we like it:
There is a pullback support level that aligns with the 61.8% Fibonacci retracement.
Stop loss: 1.0327
Why we like it:
There is an overlap support level that is slightly below the 76.4% Fibonacci retracement.
Take profit: 1.0458
Why we like it:
There is an overlap resistance level.
Enjoying your TradingView experience? Review us!
Please be advised that the information presented on TradingView is provided to Vantage (‘Vantage Global Limited’, ‘we’) by a third-party provider (‘Everest Fortune Group’). Please be reminded that you are solely responsible for the trading decisions on your account. There is a very high degree of risk involved in trading. Any information and/or content is intended entirely for research, educational and informational purposes only and does not constitute investment or consultation advice or investment strategy. The information is not tailored to the investment needs of any specific person and therefore does not involve a consideration of any of the investment objectives, financial situation or needs of any viewer that may receive it. Kindly also note that past performance is not a reliable indicator of future results. Actual results may differ materially from those anticipated in forward-looking or past performance statements. We assume no liability as to the accuracy or completeness of any of the information and/or content provided herein and the Company cannot be held responsible for any omission, mistake nor for any loss or damage including without limitation to any loss of profit which may arise from reliance on any information supplied by Everest Fortune Group.

EUR/USD - H1- Chart - Ascending Triangle (27.02.2025) The EUR/USD Pair on the H1 timeframe presents a Potential Selling Opportunity due to a recent Formation of a Triangle Breakout Pattern. This suggests a shift in momentum towards the downside in the coming hours.
Possible Short Trade:
Entry: Consider Entering A Short Position around Trendline Of The Pattern.
Target Levels:
1st Support – 1.0433
2nd Support – 1.0405
🎁 Please hit the like button and
🎁 Leave a comment to support for My Post !
Your likes and comments are incredibly motivating and will encourage me to share more analysis with you.
Best Regards, KABHI_TA_TRADING
Thank you.

EURUSD 27 Feb 2025 W9 - Intraday Analysis - US GDP Day!This is my Intraday analysis on EURUSD for 27 Feb 2025 W9 based on Smart Money Concept (SMC) which includes the following:
Market Sentiment
4H Chart Analysis
15m Chart Analysis
Market Sentiment
Heavy economic news:
US: Durable Goods Orders - GDP - Initial Jobless Claims - Pending Home Sales
The market still in the same sentiment detailed in my Weekly Analysis . Below a summary:
Short-Term Bias: Cautiously bullish for EUR/USD, driven by optimism over delayed tariffs, geopolitical progress, and hopes for softer inflation.
Key Risks:
A hot PCE report reviving Fed hawkishness.
Sudden tariff escalations or breakdowns in peace talks.
4H Chart Analysis
1️⃣
🔹Swing Bullish (Reached Swing Extreme Demand)
🔹INT Bearish (Reached Extreme Supply)
🔹INT-INT Bullish (Swept ii-High Liq.)
🔹Swing Continuation
2️⃣
🔹Is the Bearish INT structure still intact?! This is the 1st scenario of the current 4H Bullish Swing PB. INT Structure still Bearish and we reached the INT Structure Extreme and now failing to break the Weak Swing High (Not confirmed yet, we need at least a Bearish ii-BOS) and LTFs started to show weakness that may support this scenario.
🔹Currently price had swept the Liq. above the Weak ii-High and created a bearish CHoCH.
🔹With that failure to break the Weak High, the low that failed to break the high is now the target. With that low having Liq. below and above the unmitigated 4H Demand, there is a probability that we may mitigate the 4H Demand after taking the Liq. reside above to continue Bullish if and only if price started to show Bullish on LTFs where its going to have Bullish Structures.
3️⃣
🔹Expectations is set to Bearish to target the Liq. above the unmitigated 4H Demand and maybe after we will have the Bullish continuation from the current move is looking for more Liq. to target the Weak Swing High.
🔹Also, keep in mind that today is having US Volatile new and tomorrow is the most awaited US PCE report where will have high volatility. (It’s always the rule of investors positioning before high volatile reports)
15m Chart Analysis
1️⃣
🔹Swing Bullish
🔹INT Bearish
🔹Swept Liq. above Weak Swing High
2️⃣
🔹With the INT structure turned Bearish yesterday in LDN session, this indicated that there is weakness in the 15m Swing continuation.
🔹Also, with Trump talk yesterday on Tariffs, this didn’t help price to hold Bullish and formed another Bearish iBOS after failing to break the Weak Swing High and just swept the Liq. above and confirmed Bearish INT structure.
🔹With failure to break the Weak Swing High, there is a HP that price will target the Low that failed to break the Swing High. The low that failed to break the high is having Liq. below above the 4H Demand where if price to keep the 15m Swing Bullish, this is the zone where we will see Bullish continuation from.
3️⃣
🔹Expectation is set to continue Bearish as intraday targeting the Liq. below the lows and mitigating the 4H Demand for maybe a Bullish continuation later after confirmation.

EURUSD - Short Trade IdeaLooking to ride a short to my long POI where my Stairway to Heaven model resides.
The short trade is based off a bullish manipulation during the start of London session towards the sellside liquidity and long POI is.
- R2F Trading
