Heading into pullback resistance?The Fiber (EUR/USD) is rising towards the pivot and could drop to the 1st support.
Pivot: 1.0251
1st Support: 1.0194
1st Resistance: 1.0289
Risk Warning:
Trading Forex and CFDs carries a high level of risk to your capital and you should only trade with money you can afford to lose. Trading Forex and CFDs may not be suitable for all investors, so please ensure that you fully understand the risks involved and seek independent advice if necessary.
Disclaimer:
The above opinions given constitute general market commentary, and do not constitute the opinion or advice of IC Markets or any form of personal or investment advice.
Any opinions, news, research, analyses, prices, other information, or links to third-party sites contained on this website are provided on an "as-is" basis, are intended only to be informative, is not an advice nor a recommendation, nor research, or a record of our trading prices, or an offer of, or solicitation for a transaction in any financial instrument and thus should not be treated as such. The information provided does not involve any specific investment objectives, financial situation and needs of any specific person who may receive it. Please be aware, that past performance is not a reliable indicator of future performance and/or results. Past Performance or Forward-looking scenarios based upon the reasonable beliefs of the third-party provider are not a guarantee of future performance. Actual results may differ materially from those anticipated in forward-looking or past performance statements. IC Markets makes no representation or warranty and assumes no liability as to the accuracy or completeness of the information provided, nor any loss arising from any investment based on a recommendation, forecast or any information supplied by any third-party.
Eur-usd

EURUSD Channel Down bottoming on oversold 4H RSI.The EURUSD pair has been trading within a Channel Down pattern since the December 06 2024 High. The 4H RSI is oversold (<30.00) and every time it has been so on this pattern, it was a buy opportunity.
The target of those buy signals has been the 4H MA50 (blue trend-line). We expect the price to be at least 1.02850 when it hits it.
-------------------------------------------------------------------------------
** Please LIKE 👍, FOLLOW ✅, SHARE 🙌 and COMMENT ✍ if you enjoy this idea! Also share your ideas and charts in the comments section below! This is best way to keep it relevant, support us, keep the content here free and allow the idea to reach as many people as possible. **
-------------------------------------------------------------------------------
💸💸💸💸💸💸
👇 👇 👇 👇 👇 👇

Could the Fiber reverse from here?The price is falling towards the pivot and could bounce to the 1st resistance which is a pullback resistance.
Pivot: 1.0185
1st Support: 1.0092
1st Resistance: 1.0340
Risk Warning:
Trading Forex and CFDs carries a high level of risk to your capital and you should only trade with money you can afford to lose. Trading Forex and CFDs may not be suitable for all investors, so please ensure that you fully understand the risks involved and seek independent advice if necessary.
Disclaimer:
The above opinions given constitute general market commentary, and do not constitute the opinion or advice of IC Markets or any form of personal or investment advice.
Any opinions, news, research, analyses, prices, other information, or links to third-party sites contained on this website are provided on an "as-is" basis, are intended only to be informative, is not an advice nor a recommendation, nor research, or a record of our trading prices, or an offer of, or solicitation for a transaction in any financial instrument and thus should not be treated as such. The information provided does not involve any specific investment objectives, financial situation and needs of any specific person who may receive it. Please be aware, that past performance is not a reliable indicator of future performance and/or results. Past Performance or Forward-looking scenarios based upon the reasonable beliefs of the third-party provider are not a guarantee of future performance. Actual results may differ materially from those anticipated in forward-looking or past performance statements. IC Markets makes no representation or warranty and assumes no liability as to the accuracy or completeness of the information provided, nor any loss arising from any investment based on a recommendation, forecast or any information supplied by any third-party.

EURUSD: Channel Down showing no signs of reversal yet.EURUSD is on a strong bearish 1D technical outlook (RSI = 37.852, MACD = -0.006, ADX = 18.889) as it is trading inside a Channel Down since September 30th 2024. As long as the 1D MA50 is unbroken, the bearish trend will continue to prevail. Right now the trend has slowed down, but the 1D RSI Rectangle clearly shows that a local top (LH) is in. We will remain bearish, aiming for the Channel'd middle (TP = 1.01700).
## If you like our free content follow our profile to get more daily ideas. ##
## Comments and likes are greatly appreciated. ##

Bearish drop for the Fiber?The price is rising towards the resistance level which is a pullback resistance that is slightly below the 50% Fibonacci retracement and could drop from this level to our take profit.
Entry: 1.0346
Why we like it:
There is a pullback resistance that is slightly below the 50% Fibonacci retracement.
Stop loss: 1.0381
Why we like it:
There is a pullback resistance level that is slightly above the 61.8% Fibonacci retracement.
Take profit: 1.0263
Why we like it:
There is a pullback support level.
Enjoying your TradingView experience? Review us!
Please be advised that the information presented on TradingView is provided to Vantage (‘Vantage Global Limited’, ‘we’) by a third-party provider (‘Everest Fortune Group’). Please be reminded that you are solely responsible for the trading decisions on your account. There is a very high degree of risk involved in trading. Any information and/or content is intended entirely for research, educational and informational purposes only and does not constitute investment or consultation advice or investment strategy. The information is not tailored to the investment needs of any specific person and therefore does not involve a consideration of any of the investment objectives, financial situation or needs of any viewer that may receive it. Kindly also note that past performance is not a reliable indicator of future results. Actual results may differ materially from those anticipated in forward-looking or past performance statements. We assume no liability as to the accuracy or completeness of any of the information and/or content provided herein and the Company cannot be held responsible for any omission, mistake nor for any loss or damage including without limitation to any loss of profit which may arise from reliance on any information supplied by Everest Fortune Group.

Bearish drop?The Fiber (EUR/USD) is rising towards the pivot which lines up with the 50% Fibonacci retracement and could drop to the 1st support which acts as a pullback support.
Pivot: 1.0362
1st Support: 1.0262
1st Resistance: 1.0424
Risk Warning:
Trading Forex and CFDs carries a high level of risk to your capital and you should only trade with money you can afford to lose. Trading Forex and CFDs may not be suitable for all investors, so please ensure that you fully understand the risks involved and seek independent advice if necessary.
Disclaimer:
The above opinions given constitute general market commentary, and do not constitute the opinion or advice of IC Markets or any form of personal or investment advice.
Any opinions, news, research, analyses, prices, other information, or links to third-party sites contained on this website are provided on an "as-is" basis, are intended only to be informative, is not an advice nor a recommendation, nor research, or a record of our trading prices, or an offer of, or solicitation for a transaction in any financial instrument and thus should not be treated as such. The information provided does not involve any specific investment objectives, financial situation and needs of any specific person who may receive it. Please be aware, that past performance is not a reliable indicator of future performance and/or results. Past Performance or Forward-looking scenarios based upon the reasonable beliefs of the third-party provider are not a guarantee of future performance. Actual results may differ materially from those anticipated in forward-looking or past performance statements. IC Markets makes no representation or warranty and assumes no liability as to the accuracy or completeness of the information provided, nor any loss arising from any investment based on a recommendation, forecast or any information supplied by any third-party.

Strong support zone building bouncy momentumStrong support and resistance zones marked, trends are clear, volatility is seen. Down at support zone is also a trend line marked from the past with multiple reactions, now it acts as support combined with horizontal support. Price had much volatility down to support zone, and then price quickly slowed down and now signifying a reversal.

EURUSD Buy signal on (4h)EURUSD is trading inside a Channel Down and is pulling back on the (4h) time frame after a double top near the MA200 (4h).
The crossing under the MA50 (4h) is following a pattern similar to December 2nd, which turns it now into a buy opportunity.
Trading Plan:
1. Buy on the current market price.
Targets:
1. 1.04500 (MA200 4h and under the +2.88% move that December did).
Tips:
1. The RSI (4h) is approaching the 40.00 level of the December 2nd bounce. Additional buy signal.
Please like, follow and comment!!

Bullish bounce off 50% Fibonacci support?EUR/USD is falling towards the support level which is a pullback support that aligns with the 50% Fibonacci retracement and could bounce from this level to our take profit.
Entry: 1.0335
Why we like it:
There is a pullback support that aligns with the 50% Fibonacci retracement.
Stop loss: 1.0265
Why we like it:
There is a pullback support level.
Take profit: 1.0442
Why we like it:
There is a pullback support level.
Enjoying your TradingView experience? Review us!
Please be advised that the information presented on TradingView is provided to Vantage (‘Vantage Global Limited’, ‘we’) by a third-party provider (‘Everest Fortune Group’). Please be reminded that you are solely responsible for the trading decisions on your account. There is a very high degree of risk involved in trading. Any information and/or content is intended entirely for research, educational and informational purposes only and does not constitute investment or consultation advice or investment strategy. The information is not tailored to the investment needs of any specific person and therefore does not involve a consideration of any of the investment objectives, financial situation or needs of any viewer that may receive it. Kindly also note that past performance is not a reliable indicator of future results. Actual results may differ materially from those anticipated in forward-looking or past performance statements. We assume no liability as to the accuracy or completeness of any of the information and/or content provided herein and the Company cannot be held responsible for any omission, mistake nor for any loss or damage including without limitation to any loss of profit which may arise from reliance on any information supplied by Everest Fortune Group.

EURUSD Potential DownsidesHey Traders, in today's trading session we are monitoring EURUSD for a selling opportunity around 1.05000 zone, EURUSD is trading in a downtrend and currently is in a correction phase in which it is approaching the trend at 1.05000 support and resistance area.
Trade safe, Joe.

EURUSD Short-term buying activity spotted.The EURUSD pair has been under heavy selling pressure for the whole December but despite the red candle, it closed last week on a long wick and opened today on a green note. The weekly closing managed to make it inside the 2-year Megaphone pattern.
At the same time, the 1W RSI is making a Double Bottom and that resembles the August 06 2018 candle, which was also a medium-term bottom after a multi-month decline. The rebound that followed peaked a little below the 1W MA50 (blue trend-line) and Resistance.
As a result, we are bullish on this pair, at least on the medium-term, targeting 1.0600 (just below the Resistance level).
-------------------------------------------------------------------------------
** Please LIKE 👍, FOLLOW ✅, SHARE 🙌 and COMMENT ✍ if you enjoy this idea! Also share your ideas and charts in the comments section below! This is best way to keep it relevant, support us, keep the content here free and allow the idea to reach as many people as possible. **
-------------------------------------------------------------------------------
💸💸💸💸💸💸
👇 👇 👇 👇 👇 👇

Bearish reversal?EUR/USD is rising towards the resistance level which is a pullback resistance that aligns with the 50% Fibonacci retracement and could drop from this level to our take profit.
Entry: 1.0345
Why we like it:
There is a pullback resistance level that line sup with the 50% Fibonacci retracement.
Stop loss: 1.0418
Why we like it:
There is a pullback resistance level tat is slightly above the 78.6% Fibonacci retracement.
Take profit: 1.0268
Why we like it:
There is a pullback support level.
Enjoying your TradingView experience? Review us!
Please be advised that the information presented on TradingView is provided to Vantage (‘Vantage Global Limited’, ‘we’) by a third-party provider (‘Everest Fortune Group’). Please be reminded that you are solely responsible for the trading decisions on your account. There is a very high degree of risk involved in trading. Any information and/or content is intended entirely for research, educational and informational purposes only and does not constitute investment or consultation advice or investment strategy. The information is not tailored to the investment needs of any specific person and therefore does not involve a consideration of any of the investment objectives, financial situation or needs of any viewer that may receive it. Kindly also note that past performance is not a reliable indicator of future results. Actual results may differ materially from those anticipated in forward-looking or past performance statements. We assume no liability as to the accuracy or completeness of any of the information and/or content provided herein and the Company cannot be held responsible for any omission, mistake nor for any loss or damage including without limitation to any loss of profit which may arise from reliance on any information supplied by Everest Fortune Group.

EURUSD: Still bearish long term. Don't buy a falling knife.EURUSD remains heavily bearish on its 1D technical outlook (RSI = 34.500, MACD = -0.006, ADX = 21.396) as the 1 month Channel Down remains intact. The current 4H rebound is the bullish wave of the Channel and technically once the 4H MA50 is hit, it will turn into a bearish opportunity again. We are waiting for that signal to sell towards the bottom of the Channel (TP = 1.0200).
## If you like our free content follow our profile to get more daily ideas. ##
## Comments and likes are greatly appreciated. ##

EURUSD Potential DownsidesHey Traders, in today's trading session we are monitoring EURUSD for a selling opportunity around 1.03400 zone, EURUSD is trading in a downtrend and currently is in a correction phase in which it is approaching the trend 1.03400 support and resistance area.
Trade safe, Joe.

Heading into pullback resistance?EUR/USD is rising towards the resistance level which is a pullback resistance that aligns with the 38.2% Fibonacci retracement and could reverse from this level to our take profit.
Entry: 1.0387
Why we like it:
There is a pullback resistance that lines up with the 38.2% Fibonacci retracement.
Stop loss: 1.04128
Why we like it:
There is an overlap resistance level that aligns with the 61.8% Fibonacci retracement.
Take profit: 1.0345
Why we like it:
There is a pullback support level.
Enjoying your TradingView experience? Review us!
Please be advised that the information presented on TradingView is provided to Vantage (‘Vantage Global Limited’, ‘we’) by a third-party provider (‘Everest Fortune Group’). Please be reminded that you are solely responsible for the trading decisions on your account. There is a very high degree of risk involved in trading. Any information and/or content is intended entirely for research, educational and informational purposes only and does not constitute investment or consultation advice or investment strategy. The information is not tailored to the investment needs of any specific person and therefore does not involve a consideration of any of the investment objectives, financial situation or needs of any viewer that may receive it. Kindly also note that past performance is not a reliable indicator of future results. Actual results may differ materially from those anticipated in forward-looking or past performance statements. We assume no liability as to the accuracy or completeness of any of the information and/or content provided herein and the Company cannot be held responsible for any omission, mistake nor for any loss or damage including without limitation to any loss of profit which may arise from reliance on any information supplied by Everest Fortune Group.

Heading into 38.2% Fibonacci resistance?EUR/USD is rising towards the resistance level which is a pullback resistance that aligns with the 38.2% Fibonacci retracement and could drop from this level to our take profit.
Entry: 1.0385
Why we like it:
There is a pullback resistance level that line sup with the 38.2% Fibonacci retracement.
Stop loss: 1.0445
Why we like it:
There is a pullback resistance level.
Take profit: 1.0343
Why we like it:
There is a pullback support.
Enjoying your TradingView experience? Review us!
Please be advised that the information presented on TradingView is provided to Vantage (‘Vantage Global Limited’, ‘we’) by a third-party provider (‘Everest Fortune Group’). Please be reminded that you are solely responsible for the trading decisions on your account. There is a very high degree of risk involved in trading. Any information and/or content is intended entirely for research, educational and informational purposes only and does not constitute investment or consultation advice or investment strategy. The information is not tailored to the investment needs of any specific person and therefore does not involve a consideration of any of the investment objectives, financial situation or needs of any viewer that may receive it. Kindly also note that past performance is not a reliable indicator of future results. Actual results may differ materially from those anticipated in forward-looking or past performance statements. We assume no liability as to the accuracy or completeness of any of the information and/or content provided herein and the Company cannot be held responsible for any omission, mistake nor for any loss or damage including without limitation to any loss of profit which may arise from reliance on any information supplied by Everest Fortune Group.

EURUSD Channel Up targeting the 4H MA200.The EURUSD pair broke above its 4H MA50 (blue trend-line) and following a Double Bottom bounce on the Support Zone on December 18, it started a Channel Up.
Having initiated that after a highly oversold 4H RSI, it shares many similarities with the November 22 Channel Up, which peaked just below the 4H MA200 (orange trend-line). This is where our current short-term Target is at 1.04900.
-------------------------------------------------------------------------------
** Please LIKE 👍, FOLLOW ✅, SHARE 🙌 and COMMENT ✍ if you enjoy this idea! Also share your ideas and charts in the comments section below! This is best way to keep it relevant, support us, keep the content here free and allow the idea to reach as many people as possible. **
-------------------------------------------------------------------------------
💸💸💸💸💸💸
👇 👇 👇 👇 👇 👇

Bearish drop off pullback resistance?The Fiber (EUR/USD) is rising towards the pivot and could drop to the 1st support which is a pullback support.
Pivot: 1.0466
1st Support: 1.0333
1st Resistance: 1.0609
Risk Warning:
Trading Forex and CFDs carries a high level of risk to your capital and you should only trade with money you can afford to lose. Trading Forex and CFDs may not be suitable for all investors, so please ensure that you fully understand the risks involved and seek independent advice if necessary.
Disclaimer:
The above opinions given constitute general market commentary, and do not constitute the opinion or advice of IC Markets or any form of personal or investment advice.
Any opinions, news, research, analyses, prices, other information, or links to third-party sites contained on this website are provided on an "as-is" basis, are intended only to be informative, is not an advice nor a recommendation, nor research, or a record of our trading prices, or an offer of, or solicitation for a transaction in any financial instrument and thus should not be treated as such. The information provided does not involve any specific investment objectives, financial situation and needs of any specific person who may receive it. Please be aware, that past performance is not a reliable indicator of future performance and/or results. Past Performance or Forward-looking scenarios based upon the reasonable beliefs of the third-party provider are not a guarantee of future performance. Actual results may differ materially from those anticipated in forward-looking or past performance statements. IC Markets makes no representation or warranty and assumes no liability as to the accuracy or completeness of the information provided, nor any loss arising from any investment based on a recommendation, forecast or any information supplied by any third-party.

Bearish drop?EUR/USD is rising towards the resistance level which is a pullback resistance that aligns with the 61.8% Fibonacci retracement and could drop from this level to our take profit.
Entry: 1.04543
Why we like it:
There is a pullback resistance level that lines up with the 61.8% Fibonacci retracement.
Stop loss: 1.0534
Why we like it:
There is an overlap resistance level that is slightly above the 61.8% Fibonacci retracement.
Take profit: 1.0352
Why we like it:
There is a pullback support.
Enjoying your TradingView experience? Review us!
Please be advised that the information presented on TradingView is provided to Vantage (‘Vantage Global Limited’, ‘we’) by a third-party provider (‘Everest Fortune Group’). Please be reminded that you are solely responsible for the trading decisions on your account. There is a very high degree of risk involved in trading. Any information and/or content is intended entirely for research, educational and informational purposes only and does not constitute investment or consultation advice or investment strategy. The information is not tailored to the investment needs of any specific person and therefore does not involve a consideration of any of the investment objectives, financial situation or needs of any viewer that may receive it. Kindly also note that past performance is not a reliable indicator of future results. Actual results may differ materially from those anticipated in forward-looking or past performance statements. We assume no liability as to the accuracy or completeness of any of the information and/or content provided herein and the Company cannot be held responsible for any omission, mistake nor for any loss or damage including without limitation to any loss of profit which may arise from reliance on any information supplied by Everest Fortune Group.

EURUSD | Big Monthly Support ZoneWe have seen the first monthly candle close with a big wick showing there is some kind of reaction to this zone. Will be looking on the lower time frames for bullish chart patterns for an entry.
Let me know what your outlook is!

EURUSD Is Switching Trend For Bearish Dollar SeasonHey Traders, in the coming week we are monitoring EURUSD for a buying opportunity around 1.04100 zone, EURUSD is trading in an uptrend and currently is in a correction phase in which it is approaching the trend at 1.04100 support and resistance area.
Trade safe, Joe.

EURUSD: 4H MA50 crossing signals new rally.EURUSD is remains bearish on its 1D technical outlook (RSI = 41.523, MACD = -0.006, ADX = 15.575) but today it crossed and closed a 4H candle over the 4H MA50 for the first time since December 10th. Along with that, it crossed above the LH trend-line, thus technically invalidating the short term bearish trend. Given the recent December 18th double bottom on the S1 Zone, the pattern that prevails is a Rectangle, thus today's breakout is technically targeting the patterns top. Consequently our target is near the R1 Zone (TP = 1.0600).
## If you like our free content follow our profile to get more daily ideas. ##
## Comments and likes are greatly appreciated. ##

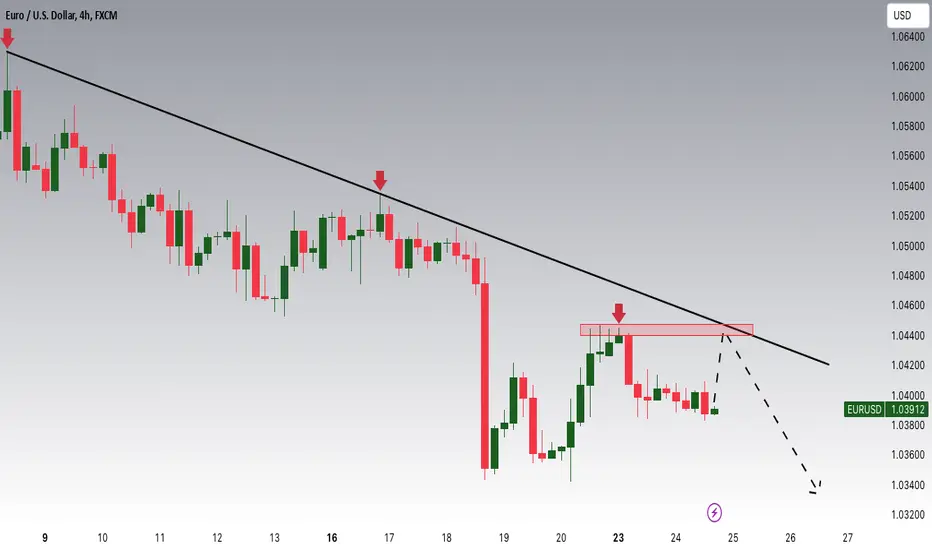
EURUSD Potential DownsidesHey Traders, in this week we are monitoring EURUSD for a selling opportunity around 1.04400 zone, EURUSD is trading in a downtrend and currently is in a correction phase in which it is approaching the trend at 1.04400 support and resistance area.
Trade safe, Joe.