EUR/AUD: Short Setup Forming—Is the Downside Just Beginning?EUR/AUD is flashing the early signs of a new short trading opportunity, with the latest chart pointing toward a fresh move lower as the corrective phase may be wrapping up.
What the Current Structure Shows (Primary Scenario)
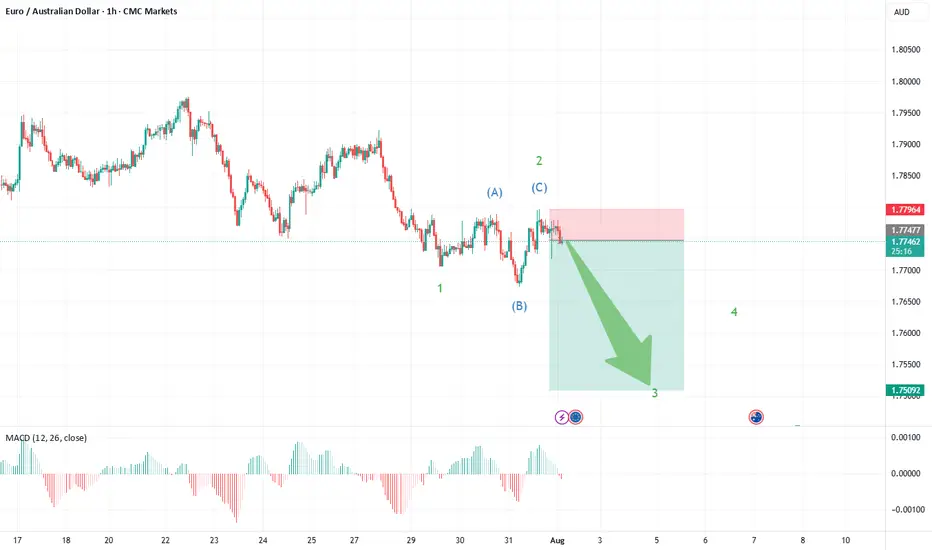
Corrective Pattern Complete: The strong advance off the May 14th, 2025 lows at 1.7247 unfolded as a classic double zigzag (WXY), culminating at recent highs. Price action has since reversed and formed an initial impulse down—clear evidence that the correction may be over.
Wave 1 Down, Expanded Flat for Wave 2: The chart now displays a completed wave 1 on the downside, followed by an expanded flat for wave 2—where price retraced upward but failed to break the previous peak, a sign of fading bullish momentum.
The recent structure shows a sharp, impulsive move down (wave 1), fitting Elliott Wave expectations for a new trend immediately after a complex correction.
The expanded flat for wave 2—where the B wave exceeded the start of A and C pushed higher—typically heralds a strong, extended wave 3. This supports a bearish outlook from current levels.
EURAUD
EURAUD Ready to Bounce? Key Support & Fundamentals Aligned!Today I want to share a Long position idea on EURAUD ( OANDA:EURAUD ) with you.
From a fundamental perspective , both the Euro (EUR) and Australian Dollar (AUD) are currently under pressure. However, the Aussie appears fundamentally weaker in the short term, making the EURAUD Long setup more favorable at this stage.
AUD Weakness :
The Reserve Bank of Australia (RBA) has held rates steady at 3.85%, but recent inflation data has dropped to 2.7%, the lowest in over 3 years.
Most economists now expect the RBA to cut rates in its next meeting in August, possibly by 25 basis points.
Slowing economic growth and dovish forward guidance from the central bank are weighing heavily on AUD sentiment.
EUR Outlook :
The European Central Bank (ECB) is also facing weak economic data, but is taking a more cautious approach toward cutting rates.
Despite softer PMIs and sluggish growth in countries like Germany and France, the ECB has not confirmed a near-term rate cut, keeping EUR relatively stable.
This divergence between the RBA’s dovish stance and the ECB’s pause is supportive of EUR strength against AUD.
Summary :
With the RBA likely to ease policy soon and the ECB holding ground for now, the interest rate differential favors EURAUD upside. Fundamentals point toward further weakness in AUD, making the EURAUD Long a strategically sound trade idea for the coming days.
-------------------------------------------
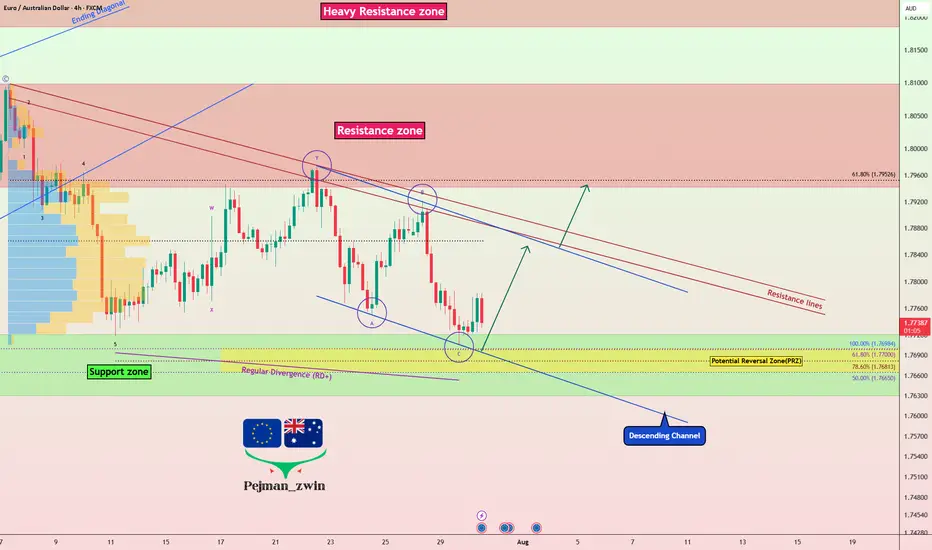
Now let's analyze the conditions of the EURAUD chart on the 4-hour time frame .
EURAUD is currently trading near the Support zone(1.772 AUD-1.763 AUD) , Potential Reversal Zone(PRZ) , and near the lower line of the descending channel .
According to Elliott Wave theory , EURAUD appears to have completed a Zigzag Correction(ABC/5-3-5) .
Also, we can see the Regular Divergence(RD+) between Consecutive Valleys .
I expect EURAUD to rise to at least 1.784 AUD .
Second Target: 1.792 AUD
Note: Stop Loss(SL): 1.762 AUD
Please respect each other's ideas and express them politely if you agree or disagree.
Euro/Australian Dollar Analyze (EURAUD), 4-hour time frame.
Be sure to follow the updated ideas.
Do not forget to put a Stop loss for your positions (For every position you want to open).
Please follow your strategy and updates; this is just my Idea, and I will gladly see your ideas in this post.
Please do not forget the ✅' like '✅ button 🙏😊 & Share it with your friends; thanks, and Trade safe.
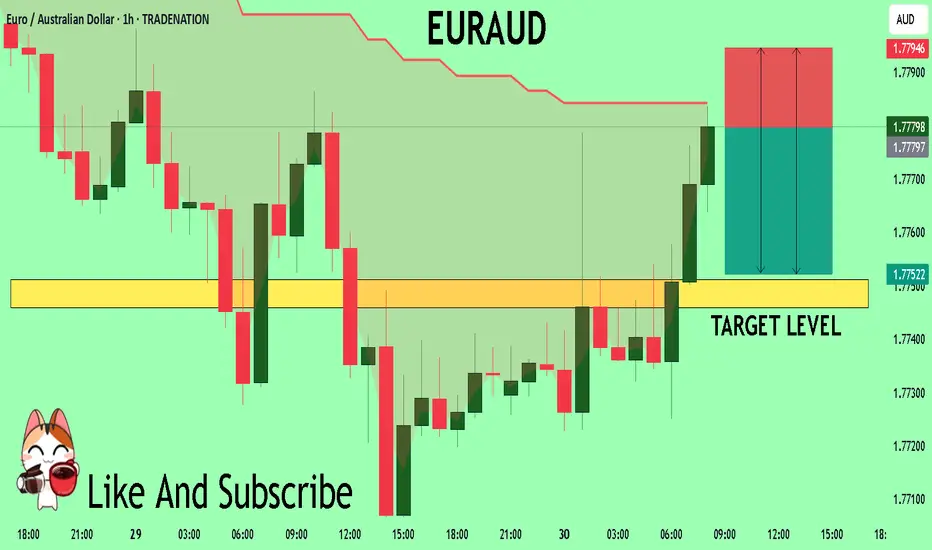
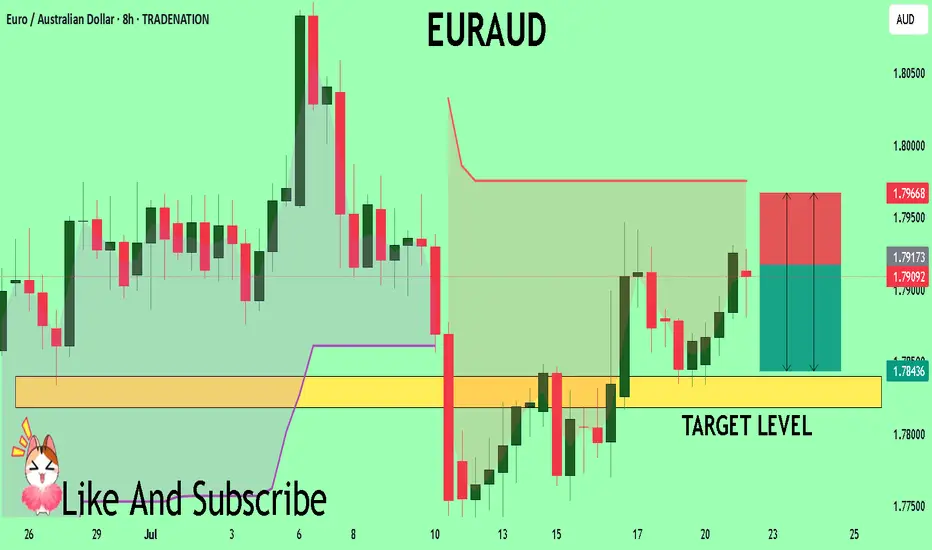
EUR/AUD BEARS ARE GAINING STRENGTH|SHORT
EUR/AUD SIGNAL
Trade Direction: short
Entry Level: 1.777
Target Level: 1.768
Stop Loss: 1.782
RISK PROFILE
Risk level: medium
Suggested risk: 1%
Timeframe: 2h
Disclosure: I am part of Trade Nation's Influencer program and receive a monthly fee for using their TradingView charts in my analysis.
✅LIKE AND COMMENT MY IDEAS✅

EUR-AUD Bullish Breakout! Buy!
Hello,Traders!
EUR-AUD made a bullish
Breakout of the falling resistance
And the breakout is confirmed
So we are bullish biased
And we will be expecting
A further bullish move up
On Monday!
Buy!
Comment and subscribe to help us grow!
Check out other forecasts below too!
Disclosure: I am part of Trade Nation's Influencer program and receive a monthly fee for using their TradingView charts in my analysis.

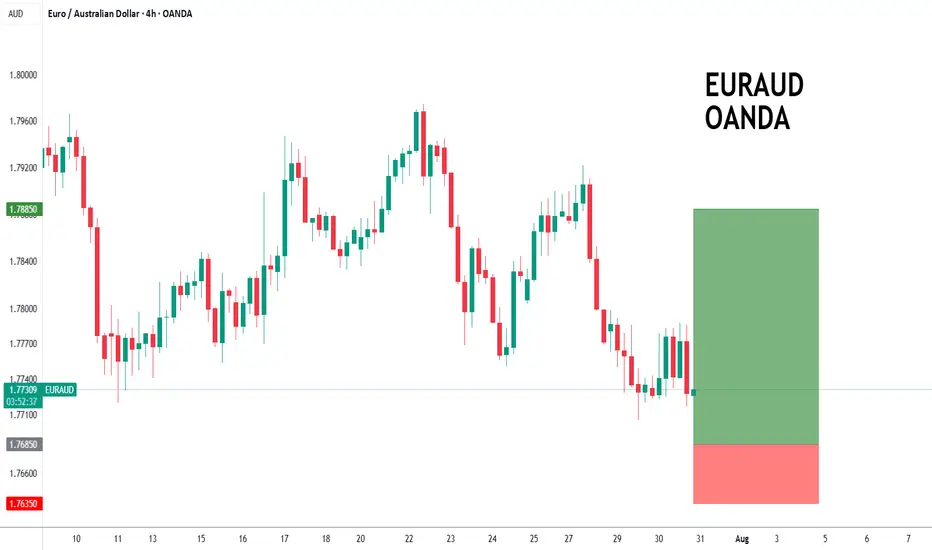
EURAUD to see a temporary move lower?EURAUD - 24h expiry
The primary trend remains bullish.
The selloff is close to an exhaustion count on the daily chart.
Preferred trade is to buy on dips.
Risk/Reward would be poor to call a buy from current levels.
Bespoke support is located at 1.7685.
We look to Buy at 1.7685 (stop at 1.7635)
Our profit targets will be 1.7885 and 1.7910
Resistance: 1.7850 / 1.7910 / 1.7950
Support: 1.7700 / 1.7680 / 1.7630
Risk Disclaimer
The trade ideas beyond this page are for informational purposes only and do not constitute investment advice or a solicitation to trade. This information is provided by Signal Centre, a third-party unaffiliated with OANDA, and is intended for general circulation only. OANDA does not guarantee the accuracy of this information and assumes no responsibilities for the information provided by the third party. The information does not take into account the specific investment objectives, financial situation, or particular needs of any particular person. You should take into account your specific investment objectives, financial situation, and particular needs before making a commitment to trade, including seeking, under a separate engagement, as you deem fit.
You accept that you assume all risks in independently viewing the contents and selecting a chosen strategy.
Where the research is distributed in Singapore to a person who is not an Accredited Investor, Expert Investor or an Institutional Investor, Oanda Asia Pacific Pte Ltd (“OAP“) accepts legal responsibility for the contents of the report to such persons only to the extent required by law. Singapore customers should contact OAP at 6579 8289 for matters arising from, or in connection with, the information/research distributed.
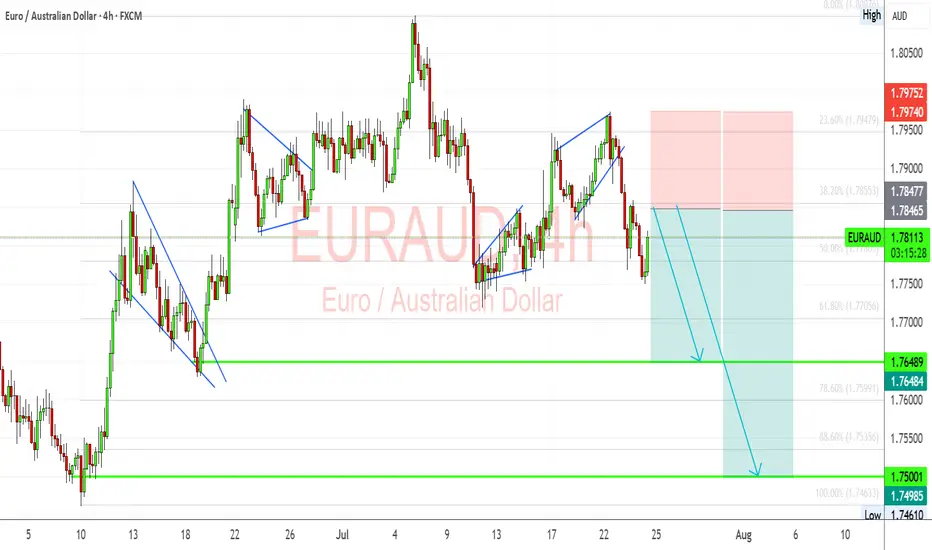
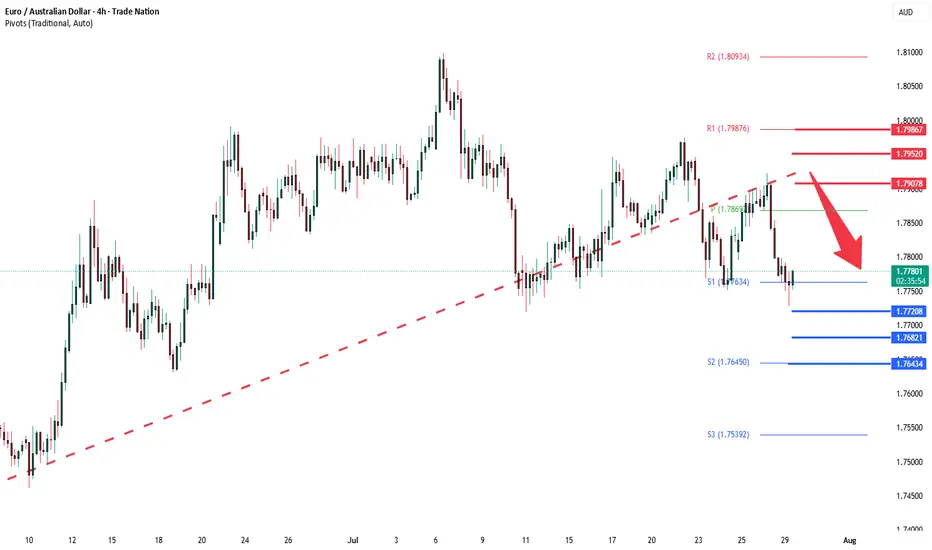
EURAUD Breakdown: Bearish Continuation Ahead of ECBEURAUD is showing signs of renewed downside pressure as fundamental and technical forces align in favor of Australian dollar strength. With the European Central Bank expected to hold rates steady and provide a cautious growth outlook, the euro remains vulnerable. Meanwhile, upside surprises in Australian inflation and supportive commodity dynamics continue to boost AUD sentiment. Technically, the pair has broken down from a rising wedge, confirming bearish momentum and setting the stage for further declines toward key support near 1.7648 and potentially 1.7500.
🟢 Current Bias: Bearish
🔑 Key Fundamentals:
ECB: Markets expect the ECB to hold rates steady this week. While this ends a 7-year streak of cuts, the bank has turned cautiously neutral, with no clear signal of future tightening. Core inflation remains subdued, and growth momentum across Germany and the euro area is weak.
RBA & Australia: The RBA faces persistent inflation risks after the June CPI surprised to the upside, putting rate hikes back on the table. The Aussie dollar is drawing strength from this, especially with rising commodity prices and China's potential fiscal stimulus aiding demand-side confidence.
Macro Divergence: Australia’s macro picture is improving vs. the eurozone. AUD has tailwinds; EUR is under pressure from stagnant growth and tepid inflation outlook.
⚠️ Risks to Bias:
ECB Surprise: A sudden hawkish tone from the ECB (e.g., lifting forecasts or emphasizing wage-driven inflation risk) could spark short-term EUR upside.
RBA Softness: A dovish RBA pivot or weak Aussie data could weaken AUD strength and slow EURAUD downside.
Geopolitical Risk: Broader global volatility (e.g., US-China, oil disruptions) could cause flows into euro as a semi-safe haven.
📅 Key News/Events to Watch:
ECB Rate Decision & Press Conference – July 25
Eurozone Flash GDP + CPI – Next week
China industrial data (AUD-sensitive)
RBA August Meeting Statement (early Aug)
📉 Technical Breakdown (4H Chart):
Price broke bearish from a wedge consolidation.
Minor bullish pullbacks are being sold into, confirming a distribution phase.
Targets:
1st Target: 1.76480 (support & fib confluence)
2nd Target: 1.7500–1.7460 zone (major swing low)
Resistance: 1.7855–1.7975 zone is key invalidation area.
Structure favors lower highs & continuation patterns until support zones break.
🧭 Leader/Lagger Behavior:
AUD is leading the move. Strong CPI and China demand backdrop are fueling bullish AUD momentum.
EUR is lagging, tracking broader USD risk tone and internal Eurozone data weakness.
EURAUD is currently reactive to external forces rather than setting direction for other pairs.
✅ Summary: Bias and Watchpoints
Bias: Bearish
Fundamentals: Weak Eurozone growth vs. hotter Aussie inflation and hawkish RBA tone.
Risk: ECB hawkish tilt or a dovish shift from the RBA.
Event to Watch: ECB press conference and Aussie CPI commentary from policymakers.
Leader/Lagger: Lagger — following AUD strength rather than leading.
EURAUD Under Pressure! SELL!
My dear followers,
I analysed this chart on EURAUD and concluded the following:
The market is trading on 1.7780 pivot level.
Bias - Bearish
Technical Indicators: Both Super Trend & Pivot HL indicate a highly probable Bearish continuation.
Target - 1.7751
Safe Stop Loss - 1.7794
About Used Indicators:
A super-trend indicator is plotted on either above or below the closing price to signal a buy or sell. The indicator changes color, based on whether or not you should be buying. If the super-trend indicator moves below the closing price, the indicator turns green, and it signals an entry point or points to buy.
Disclosure: I am part of Trade Nation's Influencer program and receive a monthly fee for using their TradingView charts in my analysis.
———————————
WISH YOU ALL LUCK
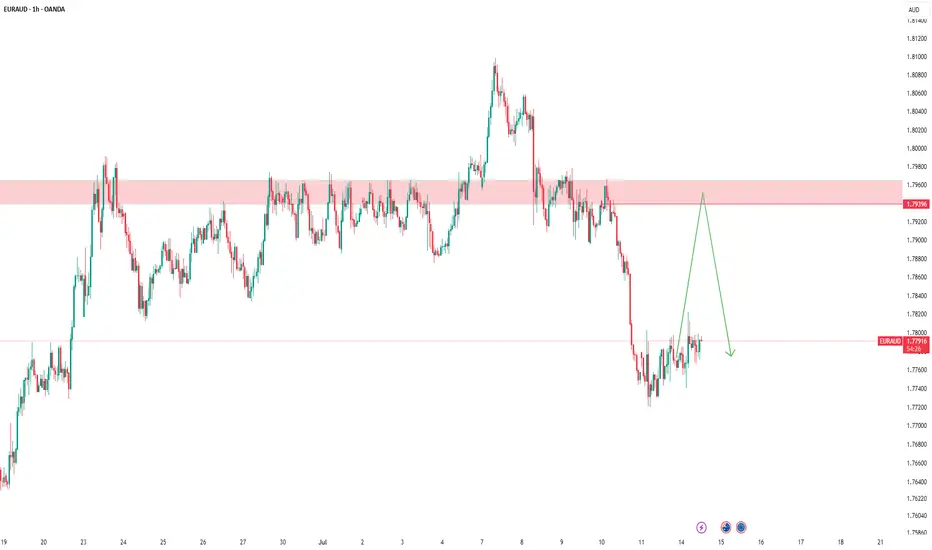
EURAUD oversold bounce backs capped at 1.7907The EURAUD pair is currently trading with a bearish bias, aligned with the broader range-bound sideway consolidation. Recent price action shows a retest of the resistance, (previous rising support)
Key resistance is located at 1.7907, a prior consolidation zone. This level will be critical in determining the next directional move.
A bearish rejection from 1.7907 could confirm the resumption of the downtrend, targeting the next support levels at 1.7720, followed by 1.7680 and 1.7643 over a longer timeframe.
Conversely, a decisive breakout and daily close above 1.7907 would invalidate the current bearish setup, shifting sentiment to bullish and potentially triggering a move towards 1.7950, then 1.7986.
Conclusion:
The short-term outlook remains bearish unless the pair breaks and holds above 1.7907. Traders should watch for price action signals around this key level to confirm direction. A rejection favours fresh downside continuation, while a breakout signals a potential trend reversal or deeper correction.
This communication is for informational purposes only and should not be viewed as any form of recommendation as to a particular course of action or as investment advice. It is not intended as an offer or solicitation for the purchase or sale of any financial instrument or as an official confirmation of any transaction. Opinions, estimates and assumptions expressed herein are made as of the date of this communication and are subject to change without notice. This communication has been prepared based upon information, including market prices, data and other information, believed to be reliable; however, Trade Nation does not warrant its completeness or accuracy. All market prices and market data contained in or attached to this communication are indicative and subject to change without notice.
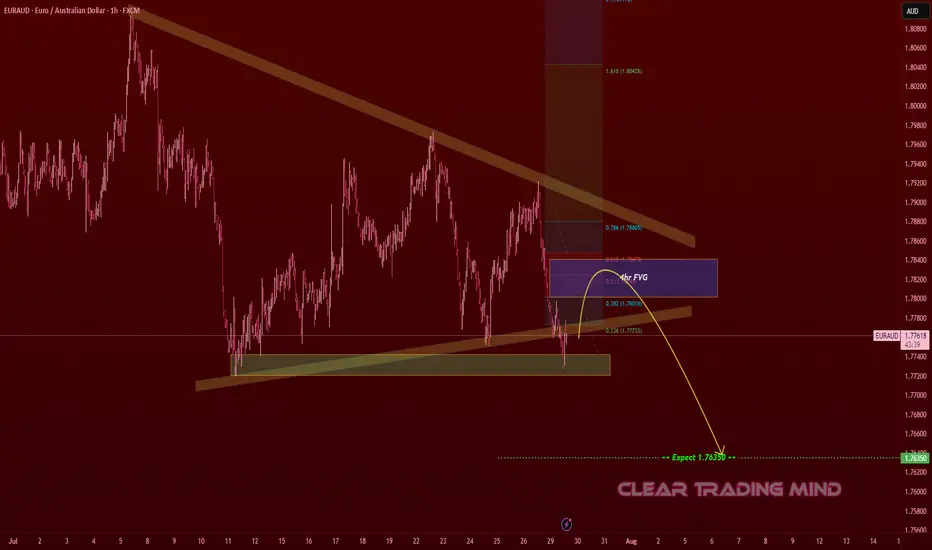
EURAUD Bearish Pullback – Short From 4hr FVG to 1.7635EURAUD – Bearish Outlook
- Key Zone: 4hr FVG (Fair Value Gap) near 1.7800 – 1.7820
- Fibonacci Levels: Retracement aligns with 0.5 – 0.618 zone, potential reaction point.
- Expected Target: 1.76350
Analysis:
1. Market shows a downward structure with lower highs and lower lows.
2. A possible pullback into the FVG zone could trigger a bearish continuation.
3. Confluence with Fibonacci levels strengthens the case for short trades targeting 1.76350.
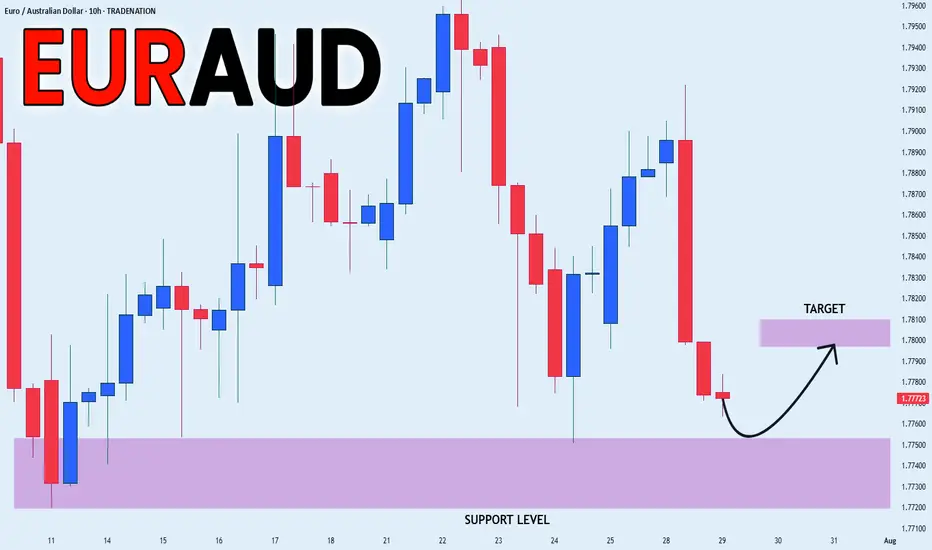
EUR_AUD LOCAL GROWTH AHEAD|LONG|
✅EUR_AUD will soon retest a key support level of 1.7750
So I think that the pair will make a rebound
And go up to retest the supply level above at 1.7800
LONG🚀
✅Like and subscribe to never miss a new idea!✅
Disclosure: I am part of Trade Nation's Influencer program and receive a monthly fee for using their TradingView charts in my analysis.
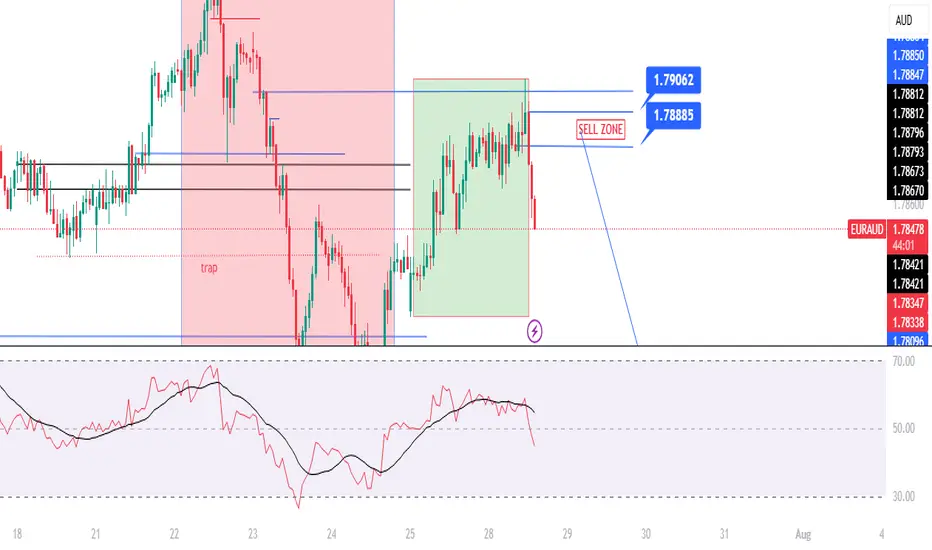
EURAUD | One Kiss from 1.7906 and I’m In – TP 140 Pips!The big picture of EURAUD is SELL possible up to 1.7750
Spot that H1 BUY range?
Inside it, there is conflict. A sneaky SELL range form inside it after rejection H4 BLUE LINE.
See that top blue line at 1.7916?
It got a gentle kiss from the H4 candle (REJECTION).
Then H1 already whispered, "a sweet breakout"!
📌LONG STORY SHORT, I'M SELL AROUND 1.7888 - 7906
If H4 comes and kisses one of the line (just a touch and wick), I’m SELLING — no more playing hard to get. 😘
Other wise, I’ll quietly cry in the corner
TP? 1.7750 — that’s a sweet 140-candlelit dinner!
WISH ME LUCK...!!!
EURAUD Set To Fall! SELL!
My dear followers,
I analysed this chart on EURAUD and concluded the following:
The market is trading on 1.7917 pivot level.
Bias - Bearish
Technical Indicators: Both Super Trend & Pivot HL indicate a highly probable Bearish continuation.
Target - 1.7840
Safe Stop Loss - 1.7966
About Used Indicators:
A super-trend indicator is plotted on either above or below the closing price to signal a buy or sell. The indicator changes color, based on whether or not you should be buying. If the super-trend indicator moves below the closing price, the indicator turns green, and it signals an entry point or points to buy.
Disclosure: I am part of Trade Nation's Influencer program and receive a monthly fee for using their TradingView charts in my analysis.
———————————
WISH YOU ALL LUCK
EURAUD: Bullish Forecast & Outlook
Our strategy, polished by years of trial and error has helped us identify what seems to be a great trading opportunity and we are here to share it with you as the time is ripe for us to buy EURAUD.
Disclosure: I am part of Trade Nation's Influencer program and receive a monthly fee for using their TradingView charts in my analysis.
❤️ Please, support our work with like & comment! ❤️

EURAUD – Planning Ahead, Not PredictingAs usual, I have marked my level.
🎯 I’m waiting for the price to reach it and if a valid sell signal appears, I will enter a short position.
If the level is broken cleanly,
I’ll wait for a pullback and enter a buy trade.
We are just traders, not predictors.
We have no impact on the market —
we are just a tiny part of a huge system.
🧠 So I never say: “Price will come here, then must fall.”
That’s not my mindset.
My belief is simple:
Manage risk, be prepared for everything.
One trade won’t make me rich,
and I won’t let one trade destroy me.
📌 Stop-loss is the first and last rule.
Trading without a stop-loss is just gambling.
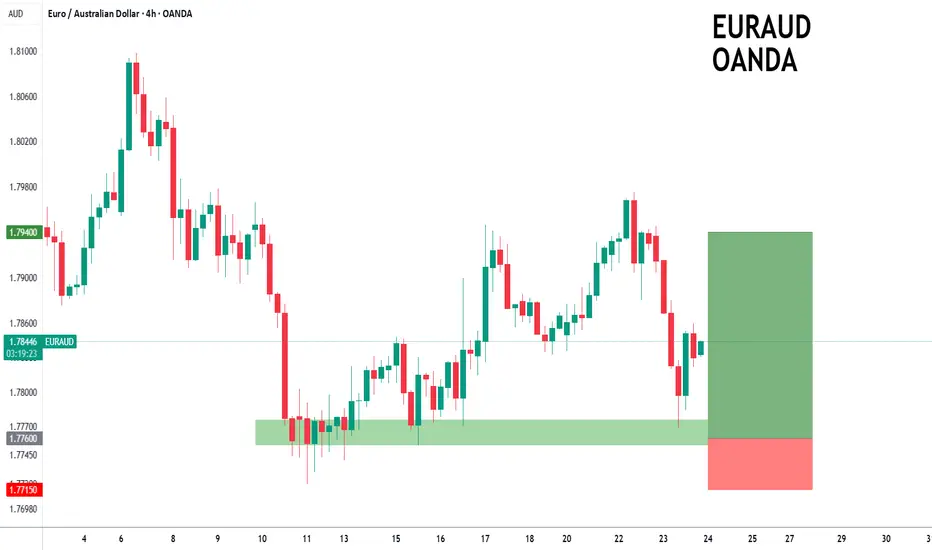
EURAUD to find buyers at previous support?EURAUD - 24h expiry
The primary trend remains bullish.
We are trading at oversold extremes.
Preferred trade is to buy on dips.
Risk/Reward would be poor to call a buy from current levels.
Bespoke support is located at 1.7760.
We look to Buy at 1.7760 (stop at 1.7715)
Our profit targets will be 1.7940 and 1.7960
Resistance: 1.7840 / 1.7900 / 1.7950
Support: 1.7750 / 1.7720 / 1.7700
Risk Disclaimer
The trade ideas beyond this page are for informational purposes only and do not constitute investment advice or a solicitation to trade. This information is provided by Signal Centre, a third-party unaffiliated with OANDA, and is intended for general circulation only. OANDA does not guarantee the accuracy of this information and assumes no responsibilities for the information provided by the third party. The information does not take into account the specific investment objectives, financial situation, or particular needs of any particular person. You should take into account your specific investment objectives, financial situation, and particular needs before making a commitment to trade, including seeking, under a separate engagement, as you deem fit.
You accept that you assume all risks in independently viewing the contents and selecting a chosen strategy.
Where the research is distributed in Singapore to a person who is not an Accredited Investor, Expert Investor or an Institutional Investor, Oanda Asia Pacific Pte Ltd (“OAP“) accepts legal responsibility for the contents of the report to such persons only to the extent required by law. Singapore customers should contact OAP at 6579 8289 for matters arising from, or in connection with, the information/research distributed.
EURAUD: Waiting for the FVG Tap and Confirmation to ShortPrice ran previous liquidity and dropped aggressively, creating a clean FVG.
I’m now watching for price to retrace into that imbalance and form a strong bearish candle. If it does, I’ll be looking to short down
Clean structure. Just waiting for confirmation.

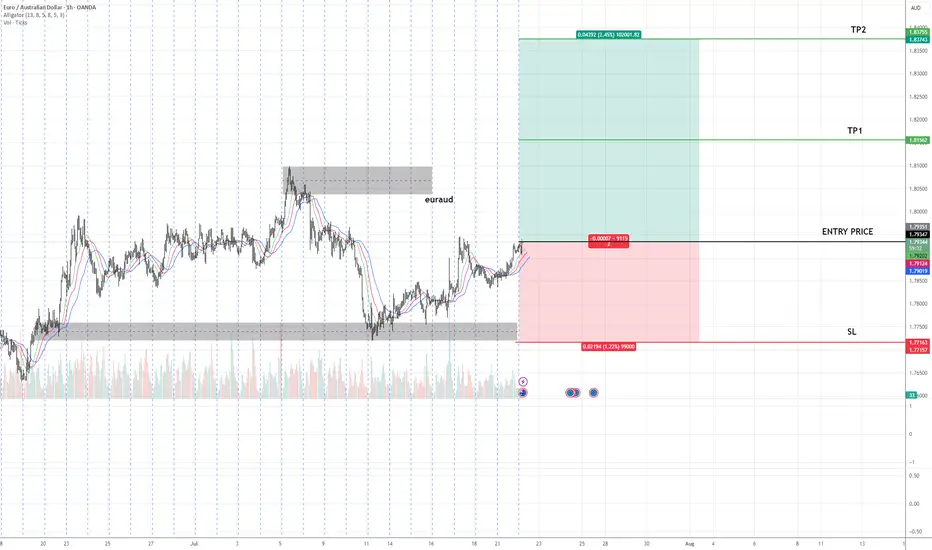
EURAUD Buy Setup – Advanced Analysis Entry: As marked on chart
🎯 TP1: As highlighted on chart
🎯 TP2: As highlighted on chart
🛑 SL: As defined on chart
📊 Technical Insight:
Price has completed a higher low formation, indicating the potential start of a new uptrend phase.
The market has shown an accumulation phase followed by a breakout above minor resistance, suggesting strong demand at current levels.
Volume analysis supports the breakout, with increased participation on bullish pushes and decreasing volume on retracements, confirming healthy trend dynamics.
📍 As long as price holds above the stop loss zone, we expect continuation towards TP1 and TP2 in line with the primary trend.
EUR/AUD BUYERS WILL DOMINATE THE MARKET|LONG
EUR/AUD SIGNAL
Trade Direction: long
Entry Level: 1.787
Target Level: 1.791
Stop Loss: 1.785
RISK PROFILE
Risk level: medium
Suggested risk: 1%
Timeframe: 1h
Disclosure: I am part of Trade Nation's Influencer program and receive a monthly fee for using their TradingView charts in my analysis.
✅LIKE AND COMMENT MY IDEAS✅

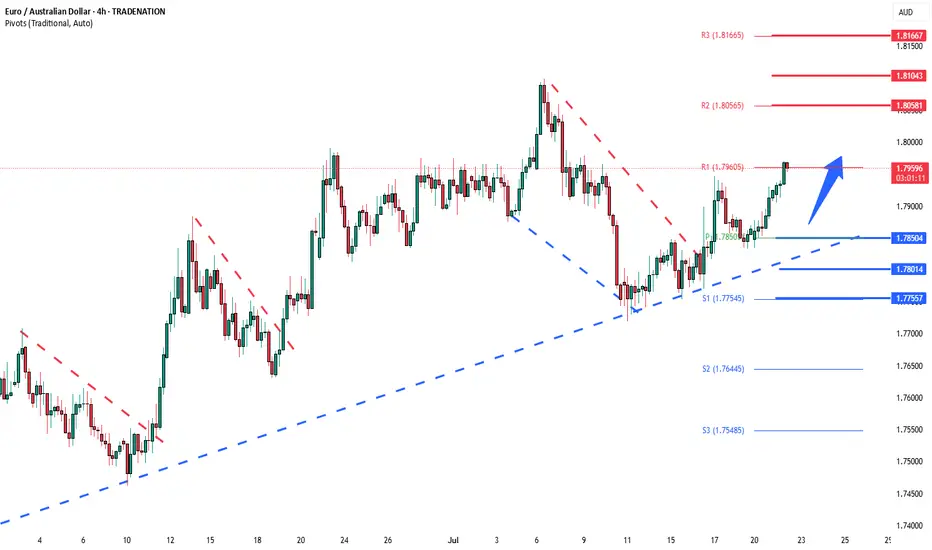
EURUAD is in the Buy directionHello Traders
In This Chart EUR/AUD 4 HOURLY Forex Forecast By FOREX PLANET
today EUR/AUD analysis 👆
🟢This Chart includes_ (EUR/AUD market update)
🟢What is The Next Opportunity on EUR/AUD Market
🟢how to Enter to the Valid Entry With Assurance Profit
This CHART is For Trader's that Want to Improve Their Technical Analysis Skills and Their Trading By Understanding How To Analyze The Market Using Multiple Timeframes and Understanding The Bigger Picture on the Charts


EURAUD Bullish breakout supported at 1.7650The EURAUD remains in a bullish trend, with recent price action indicating a continuation breakout within the broader uptrend.
Support Zone: 1.7850 – a key level from previous consolidation. Price is currently testing or approaching this level.
A bullish rebound from 1.7850 would confirm ongoing upside momentum, with potential targets at:
1.8060 – initial resistance
1.8100 – psychological and structural level
1.8165 – extended resistance on the longer-term chart
Bearish Scenario:
A confirmed break and daily close below 1.7850 would weaken the bullish outlook and suggest deeper downside risk toward:
1.7800 – minor support
1.7755 – stronger support and potential demand zone
Outlook:
Bullish bias remains intact while the EURAUD holds above 1.7850. A sustained break below this level could shift momentum to the downside in the short term.
This communication is for informational purposes only and should not be viewed as any form of recommendation as to a particular course of action or as investment advice. It is not intended as an offer or solicitation for the purchase or sale of any financial instrument or as an official confirmation of any transaction. Opinions, estimates and assumptions expressed herein are made as of the date of this communication and are subject to change without notice. This communication has been prepared based upon information, including market prices, data and other information, believed to be reliable; however, Trade Nation does not warrant its completeness or accuracy. All market prices and market data contained in or attached to this communication are indicative and subject to change without notice.
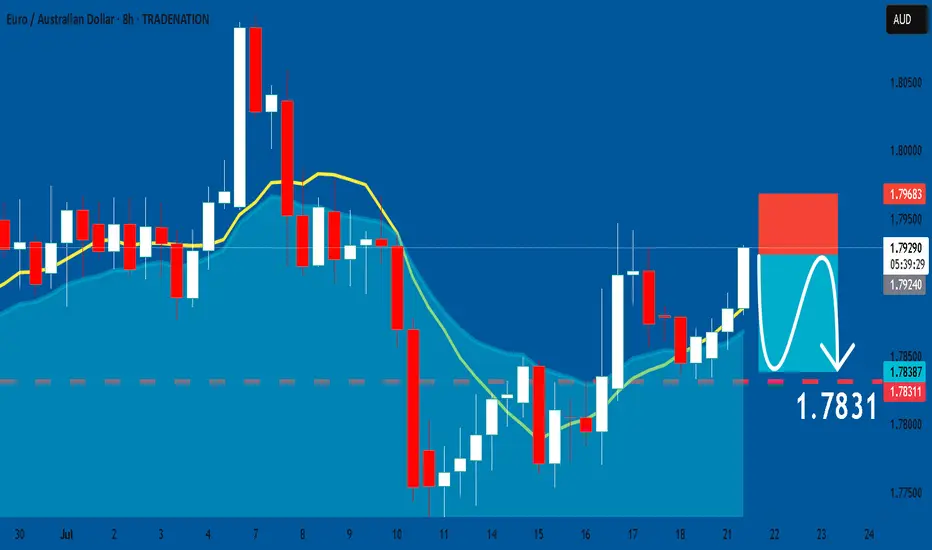
EURAUD: Short Signal Explained
EURAUD
- Classic bearish pattern
- Our team expects retracement
SUGGESTED TRADE:
Swing Trade
Sell EURAUD
Entry - 1.7924
Stop - 1.7968
Take - 1.7831
Our Risk - 1%
Start protection of your profits from lower levels
Disclosure: I am part of Trade Nation's Influencer program and receive a monthly fee for using their TradingView charts in my analysis.
❤️ Please, support our work with like & comment! ❤️
euraud long tradein my opinion this is a good trade with a good r/r
hope hit the tp
consider this is my trade not your trade and i just like to share my trades with world
