EURCAD - Overextended and Ready to Reverse?The EURCAD pair is showing clear signs of exhaustion in its bullish trend on the monthly chart, with an overextended price that has already liquidated a significant high. Futures market analysis confirms the accumulation of short positions, suggesting a potential bearish movement driven by institutional players. On the daily chart, the price has shifted to a clear downtrend.
Technical Analysis:
🔹 Monthly Chart:
The price has reached overextended levels, signaling a possible reversal.
A key high has been liquidated, indicating potential demand exhaustion.
🔹 Futures Market Data:
Short positions are accumulating, showing that major market participants are positioning for a bearish move.
Commercial market conditions reflect a weakening bullish sentiment.
🔹 Daily Chart:
Structural change confirms a bearish trend.
Possible selling opportunities on pullbacks to recent resistance levels.
EURCAD

EURCAD Set To Fall! SELL!
My dear subscribers,
This is my opinion on the EURCAD next move:
The instrument tests an important psychological level 1.5718
Bias - Bearish
Technical Indicators: Supper Trend gives a precise Bearish signal, while Pivot Point HL predicts price changes and potential reversals in the market.
Target - 1.5674
My Stop Loss - 1.5743
About Used Indicators:
On the subsequent day, trading above the pivot point is thought to indicate ongoing bullish sentiment, while trading below the pivot point indicates bearish sentiment.
Disclosure: I am part of Trade Nation's Influencer program and receive a monthly fee for using their TradingView charts in my analysis.
———————————
WISH YOU ALL LUCK

EUR/CAD Long Bias🚀 EUR/CAD – Strong Long Opportunity Based on Multi-Factor Confluence
Over the past week, I conducted a comprehensive macro and sentiment-driven analysis across G10 FX pairs. Among several potential setups, EUR/CAD emerged as the most fundamentally and technically aligned long opportunity, supported by a confluence of high-probability signals across positioning, macro divergence, and capital flow sentiment.
🔍 Key Drivers Behind the EUR/CAD Long Bias:
1️⃣ Macroeconomic Divergence (ENDO View)
🇪🇺 Eurozone has shown relative stability in core macro indicators:
Inflation continues to cool, providing flexibility for ECB rate guidance.
GDP growth remains structurally flat but not contracting — suggesting resilience.
🇨🇦 Canada, on the other hand:
Shows a deteriorating inflation-growth mix.
Retail Sales and Industrial Production trends are softening.
ENDO analysis flags CAD as one of the weakest among G10 currencies.
2️⃣ Positioning – COT Report & Z-Scores
Speculative traders are increasing their long exposure to EUR (COT net longs rising +13,887 last week).
Z-Score on EUR long positions: +1.33 → statistically elevated interest in long EUR exposure.
CAD positioning is flat-to-negative, with no bullish buildup in speculative flows.
This gives EUR a clear relative edge in terms of speculative conviction.
3️⃣ Score & EXO Sentiment Framework
EUR/CAD is one of few pairs showing clear directional consensus across:
✅ EXO Score Sheet: Long Bias confirmed.
✅ RR_w Sheet: Strong risk/reward rating supports further upside.
✅ IR Forecast Sheet: ECB-CAD policy spread favors EUR strength in medium term.
4️⃣ Market Sentiment – Risk Regime
We are currently in a “Risk-On” sentiment regime, which generally favors currencies like EUR over defensive, commodity-linked currencies like CAD.
CAD tends to underperform in reflationary sentiment waves — especially when Oil fails to support the currency.
5️⃣ Cluster & Trend Confirmation
While not a primary factor, cluster analysis shows that EUR/CAD is not in a weak trend regime.
Trend alignment over 30 and 14 days remains favorable.
🔚 Conclusion:
EUR/CAD is one of the few pairs this week that aligns across all analytical fronts: macro, positioning, sentiment, and structure. In a crowded FX environment, such confluence is rare and valuable.

EUR-CAD An Interesting Setup! Buy!
Hello,Traders!
EUR-CAD is trading in an
Uptrend along the rising
Support which now
Confluences with the falling
Support line as well so as the
Pair was making a bearish
Correction we will be expecting
A bullish rebound from the
Confluence area and a further
Bullish move up
Sell!
Comment and subscribe to help us grow!
Check out other forecasts below too!
Disclosure: I am part of Trade Nation's Influencer program and receive a monthly fee for using their TradingView charts in my analysis.

EUR/CAD Best Place To Sell Very Clear , Ready For 250 Pips ?Here is my opinion on EUR/CAD , I See that the price will touch 1.59500 and then go down very hard cuz it`s a very good res area and forced the prices to go down very hard last time and prove that it`s a good res , so i will sell this pair when the price touch this area and give us a good bearish price action for confirmation .

EUR_CAD LOCAL SHORT|
✅EUR_CAD is going up now
But a strong resistance level is ahead at 1.5760
Thus I am expecting a pullback
And a move down towards the target of 1.5660
SHORT🔥
✅Like and subscribe to never miss a new idea!✅
Disclosure: I am part of Trade Nation's Influencer program and receive a monthly fee for using their TradingView charts in my analysis.

EURCAD The Target Is DOWN! SELL!
My dear friends,
My technical analysis for EURCAD is below:
The market is trading on 1.5657 pivot level.
Bias - Bearish
Technical Indicators: Both Super Trend & Pivot HL indicate a highly probable Bearish continuation.
Target - 1.5622
About Used Indicators:
A pivot point is a technical analysis indicator, or calculations, used to determine the overall trend of the market over different time frames.
Disclosure: I am part of Trade Nation's Influencer program and receive a monthly fee for using their TradingView charts in my analysis.
———————————
WISH YOU ALL LUCK

EURCAD's Triangle Hints Drop AheadThe correction looks like a contracting triangle, which is a common pattern in Elliott Wave theory. This kind of triangle usually forms during wave B or wave 4. It includes five smaller waves labeled A, B, C, D, and E, which move within two sloping lines that get closer together. There is also a demand zone marked in red on the chart.
Triangles often show a pause in the market before the price continues in the same direction as before. In this case, the triangle suggests that once wave E is complete, the price may drop again to finish wave C. The expected target area is between 1.54900 and 1.54320. This outlook remains valid as long as the price stays within the correction channel.

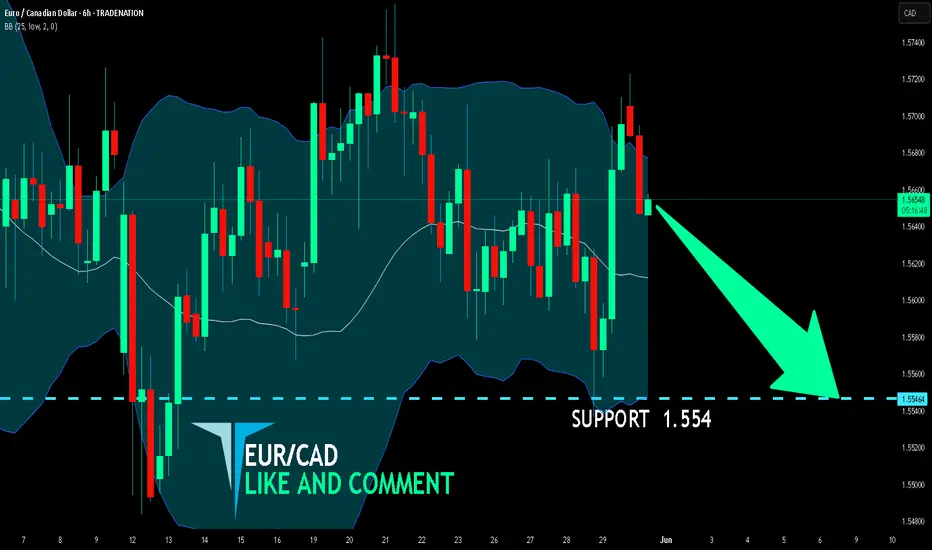
EUR/CAD BEARS ARE STRONG HERE|SHORT
Hello, Friends!
EUR/CAD pair is trading in a local uptrend which we know by looking at the previous 1W candle which is green. On the 6H timeframe the pair is going up too. The pair is overbought because the price is close to the upper band of the BB indicator. So we are looking to sell the pair with the upper BB line acting as resistance. The next target is 1.554 area.
Disclosure: I am part of Trade Nation's Influencer program and receive a monthly fee for using their TradingView charts in my analysis.
✅LIKE AND COMMENT MY IDEAS✅
eurcad sell h1#eurcad sell @ 1.5650
stop: 1.5700 (-50) pips
target 1: 1.5600 (+50) pips
target 2: 1.5500 (+100) pips
target 3: 1.5430 (+170) pips
ICMARKETS:EURCAD

EURCAD | 20.05.2025SELL 1.56900 | STOP 1.59700 | TAKE 1.54100 | In the medium term, the price is in a wide range of movement. We expect the price of this pair to decline to the values of the nearest strong supports. Observe the news background and take into account the data publications.

EURCAD (Supply/Demand + OTE + Liquidity)Hello traders!
We have valid 705 fib level, there we can expect reversal + mitigation demand zone.
Now price go to local correction. In local 0.5 fib level you will see big volume like confirmation before impulse till Demand.
Entry: confirmation on LTF in POI
Target: First problem zone is OB 4H
MAIN MOVE IN SHORT - TILL 0.5 of GLOBAL FIB LEVEL. SEE PRIVOIUS IDEA.
Demand zone also can be like fuel, so
Have a profitable day and don't forget to subscribe for more updates!
If you like this idea drop a like, leave a comment.

EUR_CAD RISKY LONG|
✅EUR_CAD is going down to retest
A horizontal support of 1.5570
Which makes me locally bullish biased
And I think that we will see a rebound
And a move up from the level
Towards the target above at 1.5630
LONG🚀
✅Like and subscribe to never miss a new idea!✅
Disclosure: I am part of Trade Nation's Influencer program and receive a monthly fee for using their TradingView charts in my analysis.

EURCAD What Next? BUY!
My dear subscribers,
This is my opinion on the EURCAD next move:
The instrument tests an important psychological level 1.5605
Bias - Bullish
Technical Indicators: Supper Trend gives a precise Bullish signal, while Pivot Point HL predicts price changes and potential reversals in the market.
Target - 1.5669
About Used Indicators:
On the subsequent day, trading above the pivot point is thought to indicate ongoing bullish sentiment, while trading below the pivot point indicates bearish sentiment.
Disclosure: I am part of Trade Nation's Influencer program and receive a monthly fee for using their TradingView charts in my analysis.
———————————
WISH YOU ALL LUCK

EUR/CAD SHORT FROM RESISTANCE
Hello, Friends!
EUR/CAD pair is trading in a local uptrend which we know by looking at the previous 1W candle which is green. On the 8H timeframe the pair is going up too. The pair is overbought because the price is close to the upper band of the BB indicator. So we are looking to sell the pair with the upper BB line acting as resistance. The next target is 1.569 area.
Disclosure: I am part of Trade Nation's Influencer program and receive a monthly fee for using their TradingView charts in my analysis.
✅LIKE AND COMMENT MY IDEAS✅

EUR/CAD SENDS CLEAR BEARISH SIGNALS|SHORT
EUR/CAD SIGNAL
Trade Direction: short
Entry Level: 1.567
Target Level: 1.549
Stop Loss: 1.579
RISK PROFILE
Risk level: medium
Suggested risk: 1%
Timeframe: 12h
Disclosure: I am part of Trade Nation's Influencer program and receive a monthly fee for using their TradingView charts in my analysis.
✅LIKE AND COMMENT MY IDEAS✅

EUR/CAD Bearish Reversal Setuphello Trader
what are your thoughts on eurcad.
Enrty: 1.59-1.60
stop loss 1.61
take profit 1.50
Analysis:
Key Resistance Zone: The red-highlighted area around 1.5800 marks a strong resistance zone where price previously faced rejection.
Double-Top Formation: A potential double-top pattern is forming, indicating a bearish reversal.
Bearish Projection: The blue trend lines suggest a downward move after a possible retest of the resistance area.
Support Levels: The marked horizontal blue lines at 1.5581, 1.5411, 1.5269, 1.5151, and 1.4977 represent key support levels where price might react.
Target Area: The projected move suggests a decline towards the 1.5151 level, with further downside potential toward 1.4977.

EURCAD Is Bullish! Long!
Please, check our technical outlook for EURCAD.
Time Frame: 4h
Current Trend: Bullish
Sentiment: Oversold (based on 7-period RSI)
Forecast: Bullish
The market is approaching a key horizontal level 1.556.
Considering the today's price action, probabilities will be high to see a movement to 1.566.
P.S
We determine oversold/overbought condition with RSI indicator.
When it drops below 30 - the market is considered to be oversold.
When it bounces above 70 - the market is considered to be overbought.
Disclosure: I am part of Trade Nation's Influencer program and receive a monthly fee for using their TradingView charts in my analysis.
Like and subscribe and comment my ideas if you enjoy them!

EURCAD (BOS 1D + Demand + OTE + Volume + OrderFlow)Hello traders!
As you can clearly see OF, daily structure(BOS 1D), expecting reversal from OTE zone. Alarm on 618 Fib level. In this moment we see divergence(also possible 3 tops). Price build liquidity to come back to our POI.(DEMAND)
Have a profitable day and don't forget to subscribe for updates!

EURCAD: Market Sentiment & Price Action
Balance of buyers and sellers on the EURCAD pair, that is best felt when all the timeframes are analyzed properly is shifting in favor of the sellers, therefore is it only natural that we go short on the pair.
Disclosure: I am part of Trade Nation's Influencer program and receive a monthly fee for using their TradingView charts in my analysis.
❤️ Please, support our work with like & comment! ❤️

EURCAD SELL.SHORTBy utilizing levels, historical patterns, , we can formulate a hypothesis that the market might follow a similar trajectory if bearish sentiment prevails.

EURCAD SELL/SHORTBy utilizing levels, historical patterns, , we can formulate a hypothesis that the market might follow a similar trajectory if bearish sentiment prevails.

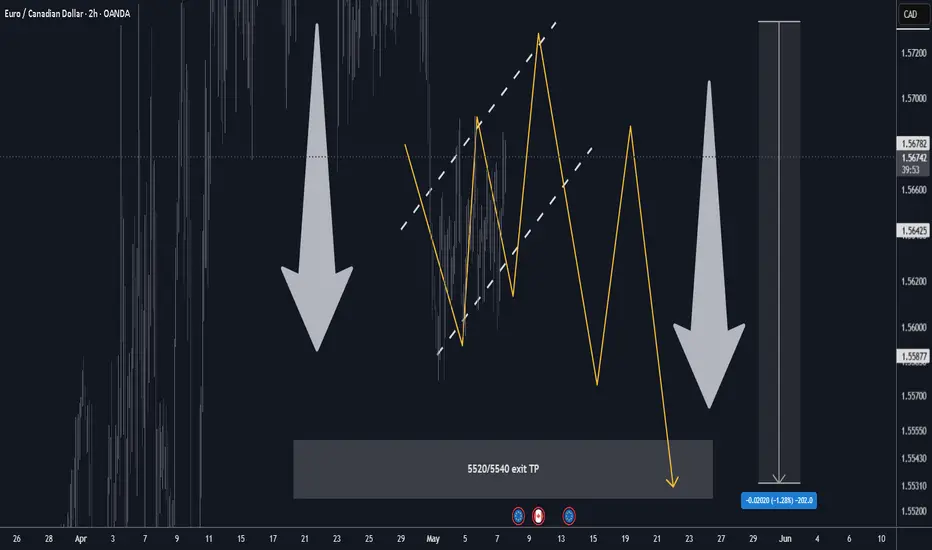
EURCAD H2 Best Level to SHORT/HOLD +100/+200 pips🏆 EURCAD Market Update H2 chart
📊 Technical Outlook
🔸broke down on high vol
🔸compression BEAR FLAG
🔸Mid-term: BEARS 5500
🔸Status: compression/dump
🔸5710/5720 heavy S/R BEARS
🔸5520/5540 key s/r zones below
🔸Price Target Bears: 5520
🔸final pump possible
🔸strategy: SHORT SELL 5710/5720
🔸SL 40 pips TP1 +100 pips TP2 +200 pips
🔸swing trade setup for patient traders
📊 Forex Market Update (May 7, 2025)
🇪🇺 EUR/USD
📉 Price: \~1.1370
USD strength ahead of Fed dampens Euro
German HCOB Services PMI fell in April; ECB rate-cut bets rising
Key Levels: Support 1.1320 | Resistance 1.1380
🇬🇧 GBP/USD
📉 Price: \~1.3320 (slid from recent highs)
Modest USD buying ahead of Fed decision
BoE policy caution keeps Pound in check
Key Levels: Support 1.3300 | Resistance 1.3400
🇺🇸 DXY (US Dollar Index)
📈 Price: \~99.39
Supported by rising U.S. yields and Fed rate-cut delays
Pressured by strategic uncertainty and trade tensions
Key Levels: Support 98.00 | Resistance 100.00