EUR/CAD Trying To Breakout Strong Support , Be Ready For Sell !Here is my opinion about EUR/CAD , The price at very strong support and can`t close below it , so if we have a clear closure below it we can enter a sell trade with the retest and targeting 150 pips at least . just wait for the breakout and for bearish Price Action and then we can go down hard with it ! if we have not a closure below so this idea should be canceled .
EURCAD

EURCAD: Bearish Continuation & Short Signal
EURCAD
- Classic bearish pattern
- Our team expects retracement
SUGGESTED TRADE:
Swing Trade
Sell EURCAD
Entry - 1.5898
Stop - 1.5970
Take - 1.5735
Our Risk - 1%
Start protection of your profits from lower levels
Disclosure: I am part of Trade Nation's Influencer program and receive a monthly fee for using their TradingView charts in my analysis.
❤️ Please, support our work with like & comment! ❤️

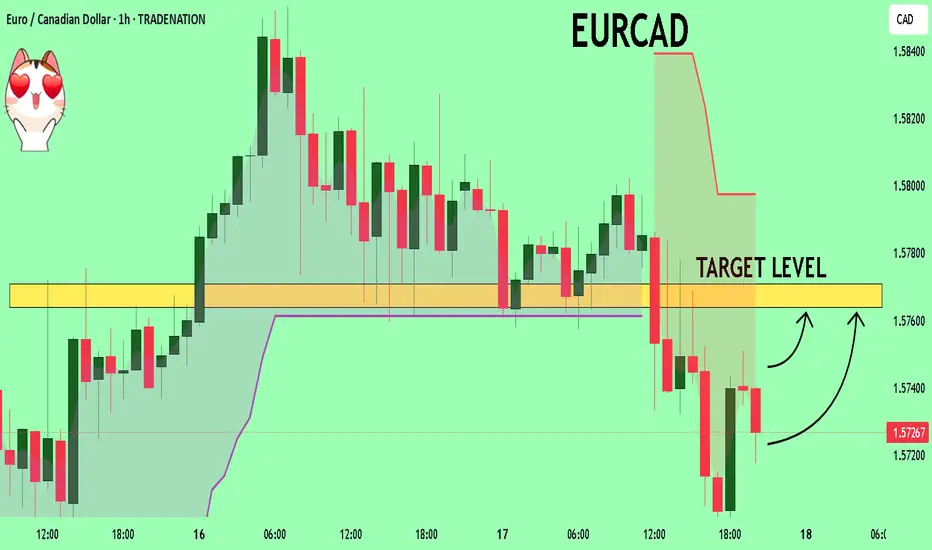
EURCAD..LONGOANDA:EURCAD
Price is testing a level that has proven significant in the past. Will it hold or break this time? The market always tells a story — we just have to listen.
A confirmed breakout and retest of this level could shift the bias and offer a new opportunity.

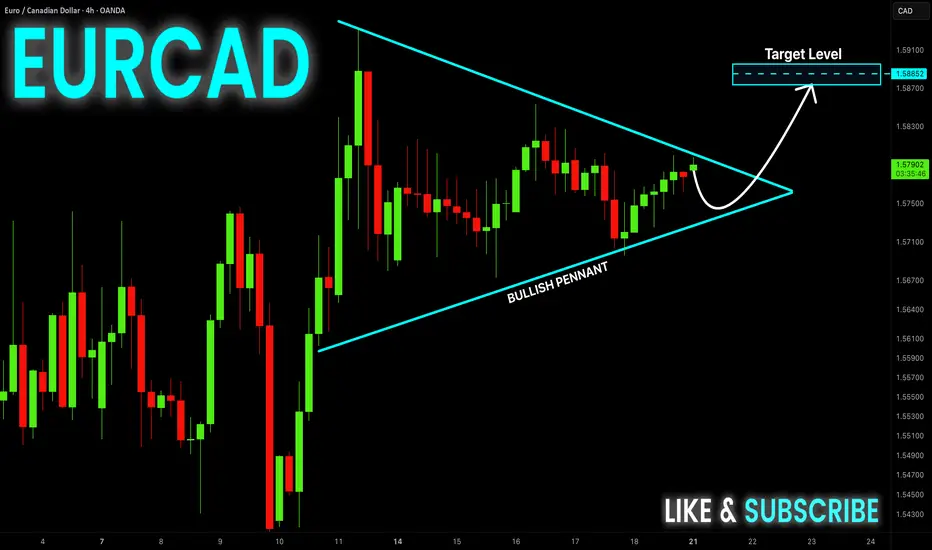
EUR-CAD Wait For Breakout! Buy!
Hello,Traders!
EUR-CAD has formed a
Bullish pennant pattern
While trading in an uptrend
So we are bullish biased and
IF we see a bullish breakout
We will be expecting a
Further bullish move up
Buy!
Comment and subscribe to help us grow!
Check out other forecasts below too!
Disclosure: I am part of Trade Nation's Influencer program and receive a monthly fee for using their TradingView charts in my analysis.
EUR_CAD BULLISH PENNANT|LONG|
✅EUR_CAD is trading in an
Uptrend and the pair has
Formed a bullish pennant
Pattern so IF we see a
Bullish breakout on Monday
We will be able to go long
On the pair
LONG🚀
✅Like and subscribe to never miss a new idea!✅
Disclosure: I am part of Trade Nation's Influencer program and receive a monthly fee for using their TradingView charts in my analysis.

EURCAD at 2009 Highs – Is a Massive 1,000 Pip Sell-Off Imminent?It's been a while since my last idea! (Too busy traveling lately 😅)
Today, we're zeroing in on a high-probability short setup on EURCAD. This pair has surged strongly since the start of the year, fueled by all the Trump-related market chaos.
Once we smashed through 1.52—last year's key resistance (a level where we previously banked over 600 pips on a massive drop)—the market has been steaming towards the next major SELL zone between 1.58 and 1.615. This area has been rock-solid resistance since 2009, causing significant sell-offs each time we've tested it. Can history repeat itself? Let’s dive into the charts.
Weekly Chart:
After the initial spike into our key zone in early March, we saw an immediate 600-pip rejection, but buyers quickly regrouped and drove the pair to fresh highs near 1.60. Crucially, we're now seeing a lack of follow-through on recent highs, which is a classic sign of buyer exhaustion. Even more telling, this week's candle is a spinning top—a textbook reversal signal.
Daily Chart:
Zooming into the daily timeframe, price action is becoming increasingly choppy with multiple rejection candles at the highs—clear signs that sellers are starting to step in. Additionally, MACD divergence is glaringly obvious, reinforcing the bearish setup.
4-Hour Chart:
At the 4-hour level, the market is now trapped in a tight sideways range between 1.57 (floor) and just above 1.58 (ceiling). The MACD continues to signal divergence—another strong indication that the bullish momentum is losing steam and a reversal is likely imminent.
How I'm Trading It:
Given all these signals, I'm using my TRFX indicator to build a long-term short position, targeting sell signals on the 8-hour and daily charts. The daily chart alone has been flashing multiple sell signals already (see below):
One last thing: Don’t be surprised by a quick fake-out spike toward the upper bound at 1.615—it’s very common in setups like these. Any sharp spike up should get quickly rejected, giving us another great selling opportunity.
Targets:
First Target: Last year's major resistance at 1.52—expect a reaction and possibly a bounce here.
Second Target: Longer term, I'm eyeing a deeper move toward the major support level around 1.43, offering a huge profit potential if the reversal fully plays out.
That's my game plan—let me know your thoughts below! 😊

EURCADhello trader the price has reached the main support area with OB.. price is consolidating, price is still uptrend in HTF daily-wk, most likely correction for HTF.. no major breakout yet but wait for candle breakout or BOS in small tf and use proper risk management..
good luck

EURCAD What Next? SELL!
My dear followers,
I analysed this chart on EURCAD and concluded the following:
The market is trading on 1.5726 pivot level.
Bias - Bearish
Technical Indicators: Both Super Trend & Pivot HL indicate a highly probable Bearish continuation.
Target - 1.5763
About Used Indicators:
A super-trend indicator is plotted on either above or below the closing price to signal a buy or sell. The indicator changes color, based on whether or not you should be buying. If the super-trend indicator moves below the closing price, the indicator turns green, and it signals an entry point or points to buy.
Disclosure: I am part of Trade Nation's Influencer program and receive a monthly fee for using their TradingView charts in my analysis.
———————————
WISH YOU ALL LUCK
EURCAD: Short Trade Explained
EURCAD
- Classic bearish formation
- Our team expects pullback
SUGGESTED TRADE:
Swing Trade
Short EURCAD
Entry - 1.5807
Sl - 1.5889
Tp - 1.5626
Our Risk - 1%
Start protection of your profits from lower levels
Disclosure: I am part of Trade Nation's Influencer program and receive a monthly fee for using their TradingView charts in my analysis.
❤️ Please, support our work with like & comment! ❤️

EUR/CAD SELLERS WILL DOMINATE THE MARKET|SHORT
Hello, Friends!
EUR-CAD uptrend evident from the last 1W green candle makes short trades more risky, but the current set-up targeting 1.562 area still presents a good opportunity for us to sell the pair because the resistance line is nearby and the BB upper band is close which indicates the overbought state of the EUR/CAD pair.
Disclosure: I am part of Trade Nation's Influencer program and receive a monthly fee for using their TradingView charts in my analysis.
✅LIKE AND COMMENT MY IDEAS✅

EURCAD The Target Is DOWN! SELL!
My dear followers,
I analysed this chart on EURCAD and concluded the following:
The market is trading on 1.5780 pivot level.
Bias - Bearish
Technical Indicators: Both Super Trend & Pivot HL indicate a highly probable Bearish continuation.
Target - 1.5647
Safe Stop Loss - 1.5857
About Used Indicators:
A super-trend indicator is plotted on either above or below the closing price to signal a buy or sell. The indicator changes color, based on whether or not you should be buying. If the super-trend indicator moves below the closing price, the indicator turns green, and it signals an entry point or points to buy.
Disclosure: I am part of Trade Nation's Influencer program and receive a monthly fee for using their TradingView charts in my analysis.
———————————
WISH YOU ALL LUCK

EUR-CAD Local Long! Buy!
Hello,Traders!
EUR-CAD has made a retest
Of the horizontal support
Level of 1.5720 and we are
Already seeing a bullish rebound
Which combined with the fact
That the pair is trading in a strong
Uptrend makes us locally
Bullish biased and we will
Be expecting a further
Bullish move up
Buy!
Comment and subscribe to help us grow!
Check out other forecasts below too!
Disclosure: I am part of Trade Nation's Influencer program and receive a monthly fee for using their TradingView charts in my analysis.

EURCAD: Short Signal Explained
EURCAD
- Classic bearish formation
- Our team expects fall
SUGGESTED TRADE:
Swing Trade
Sell EURCAD
Entry Level - 1.5767
Sl - 1.5868
Tp - 1.5567
Our Risk - 1%
Start protection of your profits from lower levels
Disclosure: I am part of Trade Nation's Influencer program and receive a monthly fee for using their TradingView charts in my analysis.
❤️ Please, support our work with like & comment! ❤️

EUR_CAD LOCAL REBOUND COMING|LONG|
✅EUR_CAD is trading in
A strong uptrend and the pair
Made a local correction on Friday
To retest the local horizontal
Support level of 1.5700 so
A bullish continuation is to
Be expected but a small
Lot size use is advised
LONG🚀
✅Like and subscribe to never miss a new idea!✅
Disclosure: I am part of Trade Nation's Influencer program and receive a monthly fee for using their TradingView charts in my analysis.

EURCAD: Short Trading Opportunity
EURCAD
- Classic bearish setup
- Our team expects bearish continuation
SUGGESTED TRADE:
Swing Trade
Short EURCAD
Entry Point - 1.5748
Stop Loss - 1.5828
Take Profit - 1.5595
Our Risk - 1%
Start protection of your profits from lower levels
Disclosure: I am part of Trade Nation's Influencer program and receive a monthly fee for using their TradingView charts in my analysis.
❤️ Please, support our work with like & comment! ❤️

EURCAD A Fall Expected! SELL!
My dear subscribers,
This is my opinion on the EURCAD next move:
The instrument tests an important psychological level 1.5572
Bias - Bearish
Technical Indicators: Supper Trend gives a precise Bearish signal, while Pivot Point HL predicts price changes and potential reversals in the market.
Target - 1.5508
About Used Indicators:
On the subsequent day, trading above the pivot point is thought to indicate ongoing bullish sentiment, while trading below the pivot point indicates bearish sentiment.
Disclosure: I am part of Trade Nation's Influencer program and receive a monthly fee for using their TradingView charts in my analysis.
———————————
WISH YOU ALL LUCK

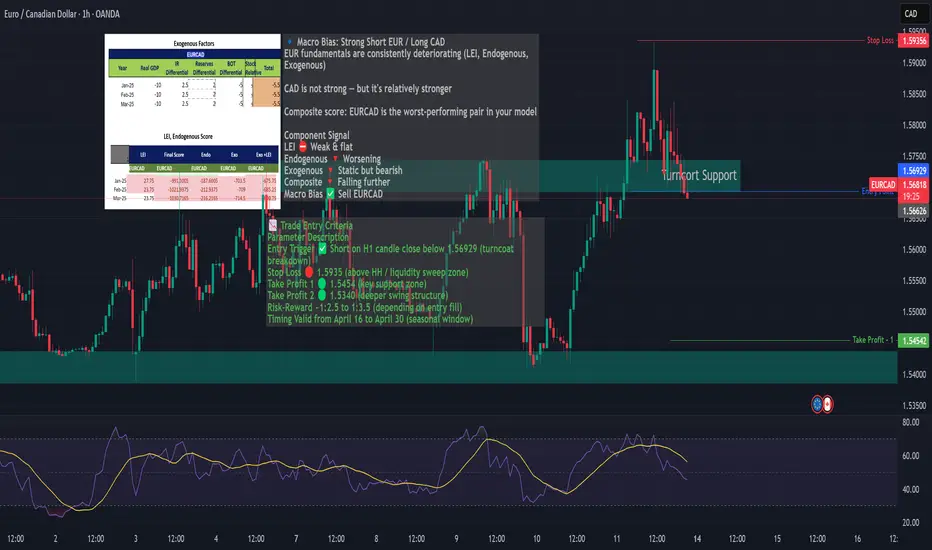
EURCAD Breakdown Watch–Bearish Divergence + Fundamental WeaknessEURCAD rallied into a key turncoat zone (former resistance → support)
Currently consolidating within this zone and showing clear RSI bearish divergence on both 1H and 4H timeframes.
Price is losing momentum while macro and seasonal factors align for a short bias.
🔍 Macro & Seasonality Confluence:
EUR Fundamentals: Worsening LEI, Endogenous & Exogenous scores
CAD Stability: Mildly bearish, but stronger than EUR
Seasonal Bias: EURCAD turns bearish after April 15
EURCAD A Fall Expected! SELL!
My dear subscribers,
EURCAD looks like it will make a good move, and here are the details:
The market is trading on 1.5694 pivot level.
Bias - Bearish
My Stop Loss - 1.5752
Technical Indicators: Both Super Trend & Pivot HL indicate a highly probable Bearish continuation.
Target - 1.5581
About Used Indicators:
The average true range (ATR) plays an important role in 'Supertrend' as the indicator uses ATR to calculate its value. The ATR indicator signals the degree of price volatility.
Disclosure: I am part of Trade Nation's Influencer program and receive a monthly fee for using their TradingView charts in my analysis.
———————————
WISH YOU ALL LUCK

EURCAD Resistance , All eyes on SellingHello Traders
In This Chart EURCAD HOURLY Forex Forecast By FOREX PLANET
today EURCAD analysis 👆
🟢This Chart includes_ (EURCAD market update)
🟢What is The Next Opportunity on EURCAD Market
🟢how to Enter to the Valid Entry With Assurance Profit
This CHART is For Trader's that Want to Improve Their Technical Analysis Skills and Their Trading By Understanding How To Analyze The Market Using Multiple Timeframes and Understanding The Bigger Picture on the Charts

EURCAD Buy signal on 2023 fractal.It's been too long since we last looked on the EURCAD pair (November 29 2024, see chart below) but it delivered nonetheless our 1.500 Target:
Thit time the price is consolidating after a strong February rally and posts a similar pattern to October 2022 - January 2023. The 1D RSI sequences between those fractals are identical and it is not technically unreasonable to expect again the bullish trend to be resumed and target the 1.382 Fibonacci extension at 1.62500.
-------------------------------------------------------------------------------
** Please LIKE 👍, FOLLOW ✅, SHARE 🙌 and COMMENT ✍ if you enjoy this idea! Also share your ideas and charts in the comments section below! This is best way to keep it relevant, support us, keep the content here free and allow the idea to reach as many people as possible. **
-------------------------------------------------------------------------------
💸💸💸💸💸💸
👇 👇 👇 👇 👇 👇

EURCAD: Bearish Continuation & Short Signal
EURCAD
- Classic bearish formation
- Our team expects pullback
SUGGESTED TRADE:
Swing Trade
Short EURUSD
Entry - 1.5599
Sl - 1.5656
Tp - 1.5491
Our Risk - 1%
Start protection of your profits from lower levels
Disclosure: I am part of Trade Nation's Influencer program and receive a monthly fee for using their TradingView charts in my analysis.
❤️ Please, support our work with like & comment! ❤️

EUR/CAD Forex Bank Heist Plan (Day / Swing Trade)🌟Hi! Hola! Ola! Bonjour! Hallo! Marhaba!🌟
Dear Money Makers & Robbers, 🤑💰✈️
Based on 🔥Thief Trading style technical and fundamental analysis🔥, here is our master plan to heist the EUR/CAD "Euro vs Loonie" Forex Bank. Please adhere to the strategy I've outlined in the chart, which emphasizes short entry. Our aim is the high-risk Green Zone. Risky level, oversold market, consolidation, trend reversal, trap at the level where traders and bullish robbers are stronger. 🏆💸Book Profits Be wealthy and safe trade.💪🏆🎉
Entry 📈 : "The heist is on! Wait for the breakout (1.54200) then make your move - Bearish profits await!"
however I advise placing Sell Stop Orders below the breakout MA or Place Sell limit orders within a 15 or 30 minute timeframe. Entry from the most recent or closest low or high level should be in retest. I Highly recommended you to put alert in your chart.
Stop Loss 🛑: Thief SL placed at 1.56000 (swing / Day Trade Basis) Using the 2H period, the recent / swing high or low level.
SL is based on your risk of the trade, lot size and how many multiple orders you have to take.
Target 🎯: 1.51600 (or) Escape Before the Target
🧲Scalpers, take note 👀 : only scalp on the Short side. If you have a lot of money, you can go straight away; if not, you can join swing traders and carry out the robbery plan. Use trailing SL to safeguard your money 💰.
EUR/CAD "Euro vs Loonie" Forex Bank Heist Plan (Scalping / Day Trade) is currently experiencing a bearishness,., driven by several key factors.
📰🗞️Get & Read the Fundamental, Macro, COT Report, On Chain Analysis, Sentimental Outlook, Intermarket Analysis, Future trend targets.. go ahead to check 👉👉👉
⚠️Trading Alert : News Releases and Position Management 📰 🗞️ 🚫🚏
As a reminder, news releases can have a significant impact on market prices and volatility. To minimize potential losses and protect your running positions,
we recommend the following:
Avoid taking new trades during news releases
Use trailing stop-loss orders to protect your running positions and lock in profits
📌Please note that this is a general analysis and not personalized investment advice. It's essential to consider your own risk tolerance and market analysis before making any investment decisions.
💖Supporting our robbery plan 💥Hit the Boost Button💥 will enable us to effortlessly make and steal money 💰💵. Boost the strength of our robbery team. Every day in this market make money with ease by using the Thief Trading Style.🏆💪🤝❤️🎉🚀
I'll see you soon with another heist plan, so stay tuned 🤑🐱👤🤗🤩

EUR/CAD H4 | Potential pullback opportunity?EUR/CAD could fall towards an overlap support and potentially bounce off this level to climb higher.
Buy entry is at 1.5596 which is an overlap support.
Stop loss is at 1.5488 which is a level that lies underneath a swing-low support and the 61.8% Fibonacci retracement.
Take profit is at 1.5737 which is a multi-swing-high resistance that aligns with the 78.6% Fibonacci retracement.
High Risk Investment Warning
Trading Forex/CFDs on margin carries a high level of risk and may not be suitable for all investors. Leverage can work against you.
Stratos Markets Limited (www.fxcm.com):
CFDs are complex instruments and come with a high risk of losing money rapidly due to leverage. 63% of retail investor accounts lose money when trading CFDs with this provider. You should consider whether you understand how CFDs work and whether you can afford to take the high risk of losing your money.
Stratos Europe Ltd (www.fxcm.com):
CFDs are complex instruments and come with a high risk of losing money rapidly due to leverage. 63% of retail investor accounts lose money when trading CFDs with this provider. You should consider whether you understand how CFDs work and whether you can afford to take the high risk of losing your money.
Stratos Trading Pty. Limited (www.fxcm.com):
Trading FX/CFDs carries significant risks. FXCM AU (AFSL 309763), please read the Financial Services Guide, Product Disclosure Statement, Target Market Determination and Terms of Business at www.fxcm.com
Stratos Global LLC (www.fxcm.com):
Losses can exceed deposits.
Please be advised that the information presented on TradingView is provided to FXCM (‘Company’, ‘we’) by a third-party provider (‘TFA Global Pte Ltd’). Please be reminded that you are solely responsible for the trading decisions on your account. There is a very high degree of risk involved in trading. Any information and/or content is intended entirely for research, educational and informational purposes only and does not constitute investment or consultation advice or investment strategy. The information is not tailored to the investment needs of any specific person and therefore does not involve a consideration of any of the investment objectives, financial situation or needs of any viewer that may receive it. Kindly also note that past performance is not a reliable indicator of future results. Actual results may differ materially from those anticipated in forward-looking or past performance statements. We assume no liability as to the accuracy or completeness of any of the information and/or content provided herein and the Company cannot be held responsible for any omission, mistake nor for any loss or damage including without limitation to any loss of profit which may arise from reliance on any information supplied by TFA Global Pte Ltd.
The speaker(s) is neither an employee, agent nor representative of FXCM and is therefore acting independently. The opinions given are their own, constitute general market commentary, and do not constitute the opinion or advice of FXCM or any form of personal or investment advice. FXCM neither endorses nor guarantees offerings of third-party speakers, nor is FXCM responsible for the content, veracity or opinions of third-party speakers, presenters or participants.
