EURCAD/ LONGFX:EURCAD
S/L 1.53433 - T/P1 1.55375 - T/P2 1.55911 - T/P3 1.56659 - T/P4 1.57380 - T/P5 1.57858
Eurcadanalysis
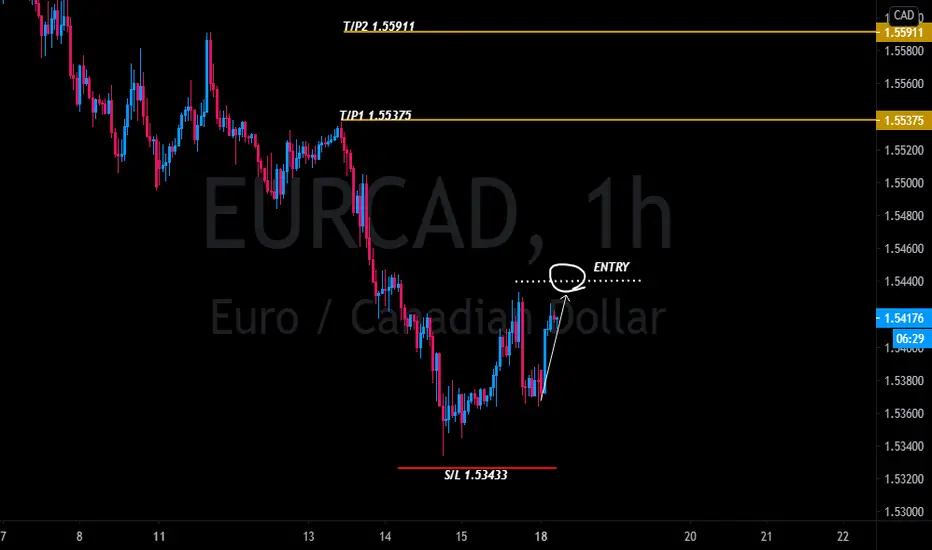
EURCAD, Retesting Support, LongEURCAD, Retesting Support and continue Bullish uptrend! Trade when the Price action Tells!

EURCAD ( LET'S OPEN THE NEXT WEEK WITH EURCAD)looking for buying as long as price has tested the support

Bullish Bat PatternEURCAD BULLISH BAT PATTERN
Market Buy Order Set Up.
Buy Entry: (1.54168)
Take-Profit 1: (1.55573)
Take-Profit 2: (1.56441)
Stop-Loss: (1.53354)
Max Risk-Reward: (2.79)
Smash a Like button and leave a Comment, I appreciate every support. Goodluck.

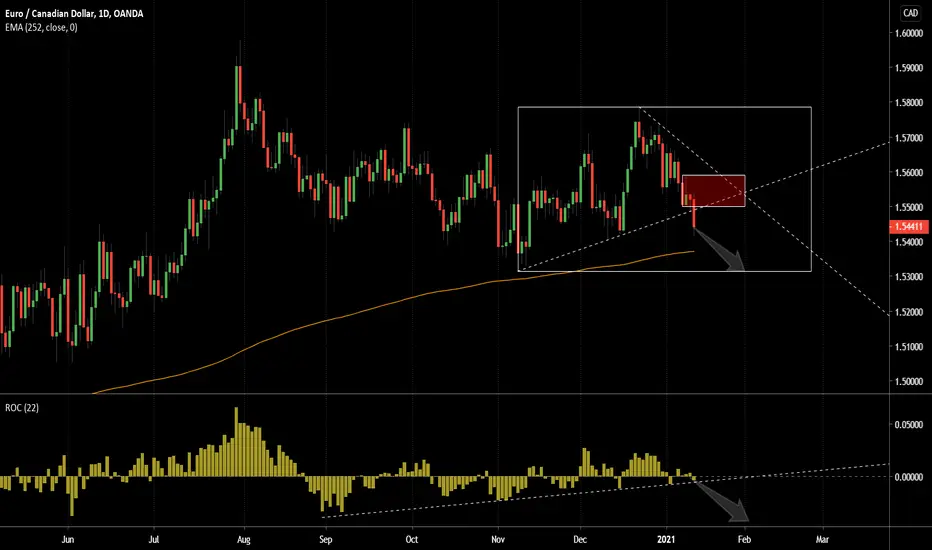
Potential continuation toward the low end of the range #forexOn the break of this trendline eur/cad could continue down to the low end of the range (large rectangle). As long as it remains below the down trendline, I think it will eventually get to 1.5300 and maybe beyond. Rate of change breaking down would also be a sign the lower prices could be on their way
EURCAD: Diagonal pattern is over,
The pattern has finished in the range of 1.5461, the first confirmation for the buy order will be received when, the price crosses the range of 1.5592 . Also by crossing the price from the range of 1.5310, this analysis will be violated. The potential volume of target for the uptrend is too high and around 500 pips.


EUR/CAD could move UP!Hey tradomaniacs,
Euro getting stronger as expected!
Next opportunity I see is that EUR/CAD could retrace back to its current Trendline if we see momentum above the resistance of the support-zone👉
The market, especially stocks and indicies are very choppy and boring to watch, which is why taking trades in this enviroment involves higher risk!
LEAVE A LIKE AND A COMMENT - I appreciate every support! =)
Peace and good trades
Irasor
Wanna see more? Don`t forget to follow me.


EURCAD: Diagonal pattern in the weekly chartEURCAD: Diagonal pattern in the weekly chart, Triangle pattern in the daily chart
( Weekly Chart )
In the weekly chart, the largest waves have a triple structure, so monitoring the charts shows the end of the chart is in a form of 3-wave pattern that starts from the range of 1.2129. According to these explanations, the price is forming an Ending Diagonal pattern in this time frame. In continuation, we will study the daily chart and the details of the movement.
( Daily Chart )
In the daily chart, the price is in the final wave of the Diagonal pattern, of which the B wave is forming the triangle pattern, and the movement is terminating. The uptrend formation and the end of the Triangle pattern can be confirmed by crossing the price from the range of 1.5785.
But the main point can be seen in the 240-minute chart, in this chart at the end of the E wave the Diagonal pattern is being formed. By crossing the price from the range of 1.5600 we can get the early confirmation to enter the completion of the Triangle pattern with targets of 1.6250 to 1.6300.

EURCAD 1H TIMEFRAME ANALYSIS (BUY) The price is trading below the lower RSI line, near the lower Bollinger bands line and near the lower channel line. Therefore we anticipate for a strong bullish power into this level as shown on the chart.

EURCAD BUYING FROM DEMAND ZONEThis pair is still trading inside channel zone and expected a retrace till demand zone and the buy this pair with a small
risk and ahead huge rewards minimum 300+ pips Friends support the the idea and dont forget to push and comments
Follow us for more updates

EURCAD Long AnalysisHey traders, here is the analysis for the EURCAD. NOTE - Please do your own analysis before taking the trade. Let me know if you guys have any questions in the comment section. If you guys like my analysis please hit like. Thanks.

📢EUR/CAD SHORT. Potential intraday setup 🚨Hello traders 👨💻
This pair is looking bearish, if we can get a correction to the highlighted area I will enter a short on a lower timeframe with great R/R. This pair is on the watchlist 👀👀 I hope you like the analysis, if you do please drop a like or leave a comment, I love all the feed back 💯 💙


EURCAD 1H TIMEFRAME ANALYSIS (BUY) From the strategy we use the market is seem to approach a strong level of support and therefore we expect the price to buy at the opening of the market. We expect to buy at 1.55158, SL 1.54657 and our TP is around 1.57654. We target around 250 pips while we risk around 50 pips and we will continue to minimize our risk as the price continues to move in our direction. Disclaimer (Use this information at your own risk).
