Eurcadbuy

EURCAD Weekly Forex Forecast 23rd September To 28th SeptemberMidterm forecast:
While the price is above the support 1.4800, beginning of uptrend is expected.
We make sure when the resistance at 1.5360 breaks.
If the support at 1.4800 is broken, the short-term forecast -beginning of uptrend- will be invalid.
Technical analysis:
The descending flag taking shape suggests we will soon see another leg lower.
There is a divergence in RSI and price between the trough at 1.49165 on 2018-05-30 and the trough at 1.47985 on 2018-08-15, the probability of downtrend continuation is decreased and the probability of beginning of uptrend is increased.
The RSI bounced from the support #1 at 47 and it prevented price from more losses.
Price is above WEMA21, if price drops more, this line can act as dynamic support against more losses.
Relative strength index (RSI) is 52.

EURCAD - DAYTRADE ENTEREDHey folks,
We have now entered EURCAD buy based off a 1H 50 Bounce ( first pullback to the 50 EMA after 13/50 cross):
Price @ 1.52316
SL @1.52116
TP @1.52516
1/1 RR
1% risk on this position
Keep in mind, if price CLOSES BELOW 13 EMA we're going to take a scratch and close the trade!
Confluences:
- 13/50 cross
- 25-50 pip pullback
- Market Baseline (yellow line) above the midline


Inverse Head and Shoulder BREAKOUT!!We closed a daily candle above the inverse HS for confirmation. Make sure risk/reward is 2:1 or higher

EUR/CAD - 200 Long OpportunityEUR/CAD has broken the 50 ema and found support on top of it.
We can expect the move to continue up higher as long as the 50 EMA holds as support.
First TP: 1.5295
Second TP: 1.5345
Third TP: 1.5395

EURCAD 15MIN 1H BUY. 30 AUG 2018I bought this one because I got everything in this v and a struggling test phase also my stops are very weak. let's see what will happen next.
15min ttf


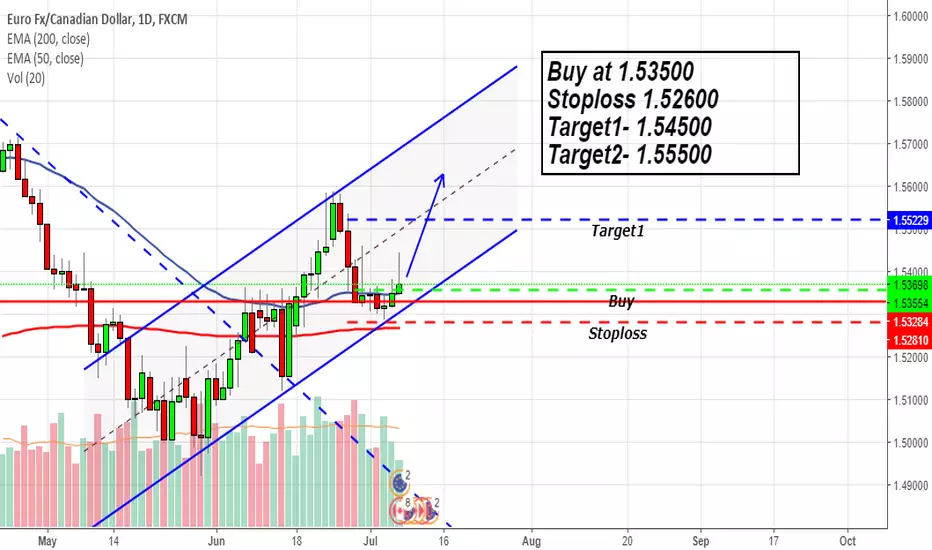
EURCAD Taking support in uptrend ChannelEURCAD is in uptrend since 29th June and now at good buy level. I am expecting to go price near to 1.53000-1.53500 zone for good risk reward ratio.
EURCAD - Channel Surfing UPAll information on Chart
Comment any questions
Don't forget to like and follow

EUR/CAD: Bullish Momentum Pick's UpTechnical Analysis
i) The lows at the end of May kissed the .236 fib level producing a substantially large wick, an indication that the bears are losing momentum.
ii) This was followed by a strong Bullish Pin Bar which printed on the .5 fib level suggesting that the May lows (.236 fib level) had a strong potential to be a reversal for the short term.
iii) We have failed to close above the .618 fib level as of yet, as a result I am slightly hesitant to bull the trigger on the long positions as this movement could be part of retracement which is why I have decided to be a bit more patient, and subsequently would be looking to short instead. Remember never get married to a position, be fluid like water!
iv) Assuming that this latest leg was in fact a reversal and not a retracement I would be looking to take the long positions to the 1.60-1.62 region where I would slowly begin to ease into short positions.
Both Moving Averages show a steady upside growth, while the 50 MA gradient has begun to steepen significantly. Furthermore, the divergence between the MACD and signal has begun to narrow implying we could have a cross over which would indicate a 'buy signal' for all the MACD trades, while the Histogram almost turns positive triggering further 'buy signals' for traders.
Fundamental Analysis
As a result of Donald Trumps trade way where tarrifs of 25 percent on steel and 10 percent on aluminium the aftermath of such decisions has hit Canada and the EU and other nations, alienainting companies like Harley-Davidson Inc. forcing them to shift production due to increased manufacturing costs, estimated at up to $100 million yearly. Evidently Trumps Tarrfis are having a knock on effect already in other countries as they are forced to encourage more protectionist policy inhibiting global trade and having a negative impact on markets.
The Canadian goverment is now taking measures to prevent a flood of steel imports from global producers seeking to avoid the U.S. tariffs, including quotas on certain steel imports to prevent dumping, with tariffs applived above that threshold set to be in force from July 1st. Reluctantly, we saw the Canadian dollar weakened while shares in Stelco Holding Inc. one of the few publicly traded steel producers in Canada jumped as much as 2.5% soared.

EURCAD Buy TradeEURCAD Buy Trade: EURCAD Starting to Build An Up Momentum, Suggest Looking For Buy Set-Ups And Entering. Keep In Mind The Incoming CAD News: You Can Play It Safe Buy Waiting For The News
EURCAD Long PosibilityAnother Trend Continuation Trade EURCAD ! Looking For An Uptrend Continuation! However, trade with caution, this pair has been eratic of late.

EUR/CAD Buy OpportunityIt seems EUR/CAD hovering to it's resistance @1.61243. Also it's breakout's it's current sell positions @ 1.59000. So it's best time to go bullish until price @ 1.61243

EUR/CAD Bullish OpportunityIt seems EUR/CAD breakout's it's nearby support area price @ 1.59647.
From the below analysis, EUR/CAD will go-up with upward channel until price @ 1.60793


Trend Continuation on EURCADHi guys,
this time we're going with the trend and we're not anticipating any kind of reversal. Instead, since we saw a recent break and close above the Previous Resistance Level (pointed out in the chart) we're now looking to ride the trend untill we get to the next reversal point that will come all the way up to 1,5780. So i went on lower timeframes such as the hourly that you see here looking for some kind of simple pattern showing a break to the upward direction, and i've found a nice flag pattern that's recently been broken to the upside.
I'm waiting to see if the order (blue line) will get triggered. IN that case, stops below the low and targets as shown.
If you have any idea/question, feel free to comment below.
Otherwise, see you in the next chart!

EUR/CAD Buy Trade OpportunityThis is the analysis shows EUR/CAD retrace back to their buy positions. So now there is a good opportunity to go long until price @ 1.55395


EURCAD LONGPrevious resistance becomes support and 0.618 fib has been tested on the daily time frame. great opportunity to stay long on EURCAD.


EURCAD Trend Continuation, Strong Impulse in ProgressHi there,
We have completed the regular flat and are now starting the next impulse. My trade would be on the 1H time frame (or even lower) once another flat forms in order to get into the buy (2nd position). First position was at the bottom of the structure.
I am now expecting the next big impulse up, except something changes drastically in the structure.
MisterRay

