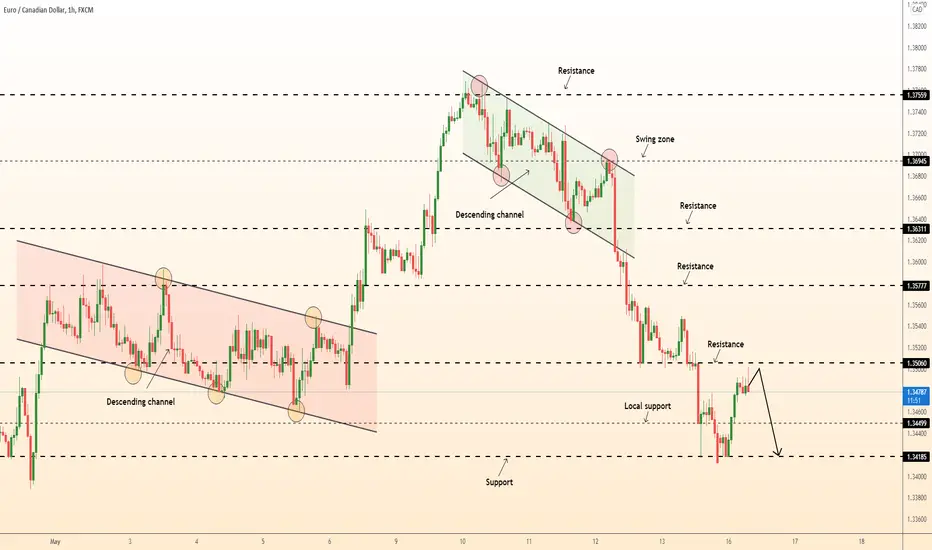
DeGRAM | EURCAD channel EURCAD hit a resistance level, like a wall.
And it's channeling now with price divergence.
-------------------
Share your opinion in the comments and support the idea with like. Thanks for your support!
Eurcadforcast

EURCAD is bouncing up from the support level!EURCAD is bouncing up from the support level.
Looking back at history we see that 1.339 level is a very significant one as buyers defended this zone several times in the past. Yesterday price bottomed at this level once again. We are not sure how strong this level is to hold price from falling, but taking a closer look at the level we see that the pair printed dojis or spinning bottom candles which suggest weaknesses on the sellers side. Strong bullish candles are seen on lower timeframe suggesting that buyers may be kicking in. I would like to see price crossing above the falling trendline to have some conviction to go long on this pair with short term targets at 1.34980 and 1.35648.
If you enjoy reading my ideas please be kind to leave a like.
Trade smart!


Eurcad textbook setup long?Eucad has approached an important resistance on the 4H which it has respected 2 times.
A descending triangle approaches the key level, an impulsive breakout of the traingle and a minor resistance shld confirm longs.

EURCAD A Great Selling Opportunity 🤨👌Trade Proposal:
There is a probability of first tp to the proposed ( 1.340 ) Direction line. So, Traders can set orders based on Price Action and expect to reach short-term goals.
Technical analysis:
EURCAD is in Downtrend and It is Expected to Continue Downtrend.

ECAD TO THE DOWNSIDE!!!As investors await the NFP data in 2 hours time, i'm expecting ECAD to close this week below last week's low and forming a new low below 1.134400.

Long on EURCADWe are aiming at going long on EURCAD and taking advantage of a potential upward tick in the currency pair, with targets as follows:
TP: 1.36182
SL: 1.34899

EURCAD LONG EURCAD bounced from the MAJOR lower support level on the H4 and WEEKLY time frame, . we expecting the pair to retest the key levels listed on the chart.
We taking this trade based on technical analysis and price action.
(1) DO NOT ENTER ANY TRADE BEFORE THE ENTRY LEVEL
(2) USE YOUR STOP LOSS
(3) DO NOT HOLD A LOSS FOR MORE THAN 2 DAYS
Please use proper risk management depending on your account size, Use lot sizes based on these calculations.
Here is a break down of your pip value in ZAR and Dollars
0, 01 = R1,43 / $0,10c
0. 05 = R 7,15 / $ 0.50
0.10 = R 14,3 / $1.00
1 Lot size = R 146,26
How to calculate Margin = (Lot Size * Contract Size)/Leverage, Lets say your broker gives you 1:500, and you open 0,2 size, How much are you exposing ? calculations : (0.2 * 10 000) / 500 = $4 (R58) also (1 Lot * 100 000) / 500 = $200 (R2 960)
So, each time I open (1 Lot size, am exposing R2960 (Down payment)
Remember, These are long term trades, It is advisable to have enough margin to handle the fluctuation of the markets.
Please like and share for more useful content:

DeGRAM | EURCAD downtrendEURCAD has made lower lows. It is clearly in a downtrend.
Recently, the price retraced to previous support, which became a resistance.
An ideal entry would be to short after a lower low and a lower close candle.
-------------------
Share your opinion in the comments and support the idea with like. Thanks for your support!
EURCAD Will Go Up!EUR-CAD was trading in a narrowing bullish wedge
And now we are seeing a bullish breakout at last
Which confirms my bullish bias on the pair
And I will be expecting the price to go further up
Towards the target level above AT 1.40962

EURCAD FINAL TARGET SMASHED AFTER 7 MONTHS OF SWING02 August 2021 original position was taken, target smashed.
This is masterclass trading and i can not elaborate much, i just want to share and say thanks for supporting me.
stay forever STUCKINPROFIT

EURCAD top-down analysisHello traders, this is the full breakdown of this pair. We will take this trade if all the conditions are satisfied as discussed in the analysis. Smash the like button if you find value in this analysis and drop a comment if you have any questions or let me know which pair to cover in my next analysis.

DeGRAM | EURCAD beautiful channelEURCAD is channeling downwards over 2 months now.
Notice every time when price makes shallow extensions down or up price tends return to previous levels.
We expected price to test higher levels.
-------------------
Share your opinion in the comments and support the idea with Like. Thanks for your support!

EURCAD Potential Long !!EUR-CAD is trading in a local falling narrowing wedge
The horizontal support level at 1.36450 . was retested
So if we see a bullish breakout
The pair will rise to resistance areas at 1.42004

EURCAD top-down analysisHello traders, this is the full breakdown of this pair. We will take this trade if all the conditions are satisfied as discussed in the analysis. Smash the like button if you find value in this analysis and drop a comment if you have any questions or let me know which pair to cover in my next analysis.


EURCAD LONG - Buy Entry - H4 ChartEURCAD LONG - Buy Entry - H4 Chart
Buy @ Market
Symbol: EURCAD
Timeframe: H4
Type: BUY
Entry Price: Buy @ Market
Major Resistance @ 1.40673
Major Resistance @ 1.42670

EURCAD Daily UpdatePull from Daily Demand 1.39000. We are expecting that it will go to the Supply Level 1.43937. Then we can re-sell from the Daily Supply 1.43937 using Confirmation in Low TF, We expect for sell because this Supply Level 1.43937 removes the Demand Level 1.42100. so we can say that the Supply Level 1.43937. is Strong. We can Buy EURCAD in low TF till the Supply Level 1.43937 from a Valid Demand.

EURCAD Weekly OutlookIn Weekly TF market is still expected to Bearish, We can sell long from Weekly Supply 1.44271 to Weekly Demand Level 1.32512 .The reason of bearish in market is that market break the Demands Level 1.43633 and the Demand level is retested and this Demand level 1.39067 is Weak, so we will use confirmation to buy from this current Demand 1.39067 to Weekly Supply level 1.44271. Than we can expect to sell from Weekly Supply

EURCAD Will Go Up!EUR-CAD is trading in a falling channel
And the husband re-tests Channel support level and horizontal support at 1.392
I think it's followed by a bounce from existing areas
By the bullish correction is possible
So we will be waiting for the reversal signs
To be able to enter a long trade BUY

EURCAD BUY OPPORTUNITY!I think It is a very good buy opportunity with a very small risk.
TP 1: 1.40229
TP 2: 1.40507
TP 3: 1.40776

EURCAD might rise and here is whyPrice was in a strong bullish momentum in January and beginning of February 2022. Price got rejected at the December 2021 high and began to consolidate in a bullish flag formation. Just at the start of this week we saw price breaking out of the flag pattern. I expect price to rise with the possibility of reaching 1.461.
Traders, if you enjoy this idea please do show your support by hitting that like button.
If you have different opinion, feel free to share it in the comment section below.

EURCAD There is a potential bearish bat pattern that is taking shape on this pair. Its is definitely for now in a bearish mode.
