EUR/CAD Technical Analysis.Hello traders, EUR/CAD is trading at 1.4850. The Pair is trading in ascending resistance and support wedges from some time and the price just touched support level. As the price has touched support level it will give a small pull back and then it can come down to break the support level. If the price breaks the support level then its target price will be at 1.4721.
Follow proper risk management strategy to avoid unnecessary losses and to increase profitability, don't risk more than 2% of your capital on each trade.
Do follow us for future Forex trend analysis and Ideas.
Thank you,
Rishikesh Lilawat
Eurcadidea

EURCAD long trade ideaPlan: resistance level breakout --> wait for the price to bounce off from support level --> wait for the rejection candle pattern to form e.g. bullish engulfing, pinbar, etc --> BUY
**Disclaimer** the content on this analysis is subject to change at any time without notice and is provided for the sole purpose of assisting traders to make independent investment decisions.
Traders!! if you like my ideas and do take the same trade as I do, please write it in a comment so we can manage the trade together.
_____________________________________________________________________________________________________________________
Thank you for your support ;)
GWBFX

EURCAD short trade ideaPlan: wait for the price to bounce off from resistance level --> wait for the rejection candle pattern to form e.g. bearish engulfing, pinbar, etc --> SELL
**Disclaimer** the content on this analysis is subject to change at any time without notice, and is provided for the sole purpose of assisting traders to make independent investment decisions.
Traders!! if you like my ideas and do take the same trade as I do, please write it in a comment so we can manage the trade together.
_____________________________________________________________________________________________________________________
Thank you for your support ;)
GWBFX

EUR/CAD +100 Pips From Last Analysis This is an educational + analytic content that will teach why and how to enter a trade
Make sure you watch the price action closely in each analysis as this is a very important part of our method
Disclaimer : this analysis can change at anytime without notice and it is only for the purpose of assisting traders to make independent investments decisions

EUR/CAD Multi-Timeframe analysis (03/02)Hi Traders
EUR/CAD Multi-Timeframe analysis (03/02)
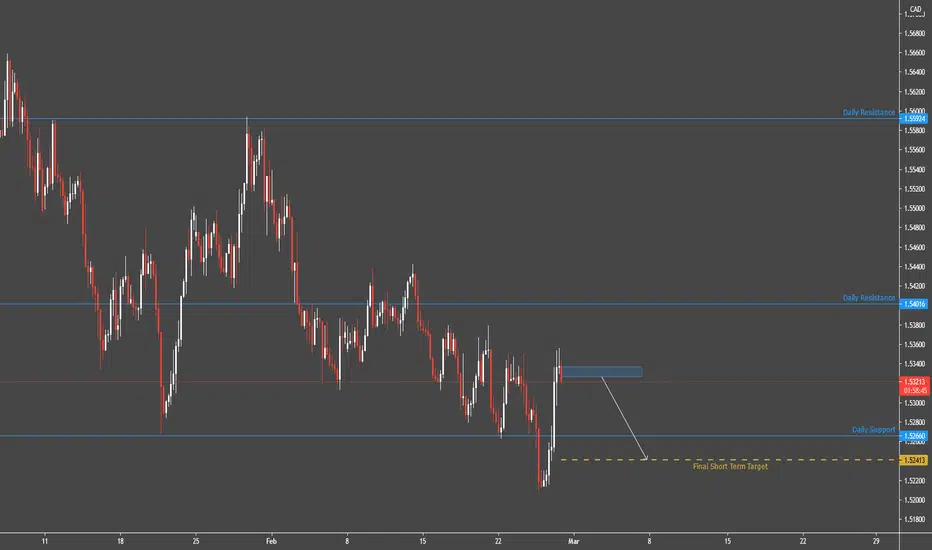
H1 Chart (Bearish)
Target 2 at 1.52525 has been reached. We closed the remaining 50% of our position and now we are looking for the next opportunity to enter the market.
Support & Resistance
1.53327 1.53548
1.53030 1.53833
1.52898 1.53965
H4 Chart (Strong UP)
The market is approaching the support at 1.52821 . We are waiting to see reversal signals in order to reinstate LONG positions. Next important support is the 1.52619 level.
Support & Resistance
1.52821 1.53124
1.52619 1.53498
1.52092 1.53833
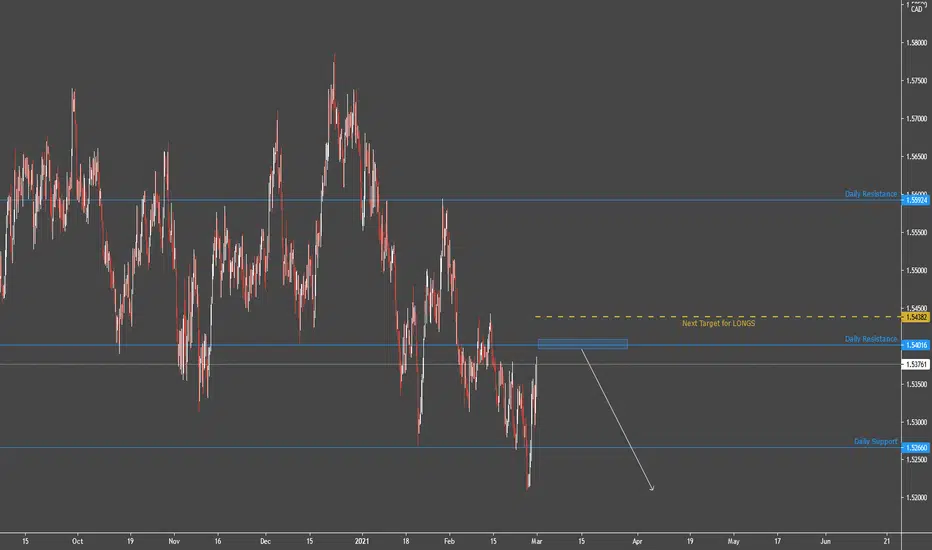
Daily Chart (Strong Down)
The market is approaching the resistance at 1.54016 . We are waiting to see reversal signals in order to reinstate SHORT positions. Next important resistance is the 1.55924 level.
Support & Resistance
1.52666 1.54016
1.52092 1.55924
1.51065 1.57096
Weekly Chart (Neutral)
The market is dominated by uncertainty. The occasionally prevailing trend lasts for a limited time and changes its direction too frequently. As long as the market remains unstable, we stay aside, waiting for the market to get back on track.
Support & Resistance
1.52666 1.59912
1.50518 1.62060
1.47707 1.64871

EURCAD BUY SETUP 1:3 RREURCAD wait to test key level and BUY when have bullish candle on that support.

EUR/CAD Multi-Timeframe analysis (Update)Hi Traders
EUR/CAD Multi-Timeframe analysis (Update)
H1 CHART ( Bullish )
A medium probability, entry signal to go LONG was given at 1.53623 after the market found support at 1.53317 . Only the downward break of 1.53317 would cancel the bullish scenario.
Support & Resistances
1.53328 1.53548
1.53030 1.53735
1.52898 1.53975
H4 CHART ( Neutral )
Conflicting technical signals are indicating towards an unstable market, cautioning us to remain neutral and wait for a stronger trend to develop.
Support & Resistances
1.53124 1.53498
1.52619 1.53782
1.52092 1.54414
DAILY CHART ( Strong Down )
Waiting for a retracement higher towards the 1.52666 resistance level in order to reinstate SHORT positions. Next important resistance is the 1.54016 level.
Support & Resistances
1.52660 1.52666
1.50744 1.54016
1.47486 1.55924
WEEKLY CHART ( NEUTRAL )
The market is dominated by uncertainty. The occasionally prevailing trend lasts for a limited time and changes its direction too frequently. As long as the market remains unstable, we stay aside, waiting for the market to get back on track.
Support & Resistances
1.52666 1.59912
1.50518 1.62060
1.47707 1.64871
EUR/CAD Multi-Timeframe analysisHi Traders
EUR/CAD Multi-Timeframe analysis
H1 CHART ( Strong Up )
The market is approaching the support at 1.53258 . We are waiting to see reversal signals in order to reinstate LONG positions. Next important support is the 1.53039 level.
Support & Resistances
1.53258 1.53486
1.53039 1.53548
1.52678 1.53719
H4 CHART ( BEARISH )
Conflicting technical signals are indicating towards an unstable market, cautioning us to remain neutral and wait for a stronger trend to develop.
Support & Resistances
1.53124 1.53498
1.52619 1.53782
1.52092 1.54414
DAILY CHART ( NEUTRAL )
Waiting for a retracement higher towards the 1.52666 resistance level in order to reinstate SHORT positions. Next important resistance is the 1.54016 level.
Support & Resistances
1.52660 1.52666
1.50744 1.54016
1.47486 1.55924
WEEKLY CHART ( NEUTRAL )
The market is dominated by uncertainty. The occasionally prevailing trend lasts for a limited time and changes its direction too frequently. As long as the market remains unstable, we stay aside, waiting for the market to get back on track.
Support & Resistances
1.52666 1.59912
1.50518 1.62060
1.47707 1.64871
EUR/CAD Technical Analysis.Hello traders, EUR/CAD is trading at 1.5262. The price is trading in downward resistance and support channel and can rebound back from its support level. As the price has already touched its support level, it can rebound back to resistance level. If the price breaks 1.5265 price level then it can touch the resistance level at 1.5297.
Follow proper risk management strategy to avoid unnecessary losses and to increase profitability, don't risk more than 2% of your capital on each trade.
Do follow us for future Forex trend analysis and Ideas.
Thank you,
Rishikesh Lilawat

EUR/CAD Multi-Timeframe analysisHi Traders
EUR/CAD Multi-Timeframe analysis
H1 CHART ( BEARISH )
Waiting for a retracement higher towards the 1.53175 resistance level in order to reinstate SHORT positions. Next important resistance is the 1.53780 level.
Support & Resistances
1.52790 1.53175
1.52213 1.53780
1.51227 1.54766
H4 CHART ( BEARISH )
A medium high probability, entry signal to go SHORT was given at 1.53151 after the market found resistance at 1.53804 . Only the upward break of 1.53804 would cancel the bearish scenario.
Support & Resistances
1.53120 1.53782
1.52821 1.54414
1.52255 1.54980
DAILY CHART ( NEUTRAL )
The market is dominated by uncertainty. The occasionally prevailing trend lasts for a limited time and changes its direction too frequently. As long as the market remains unstable, we stay aside, waiting for the market to get back on track.
Support & Resistances
1.52666 1.54016
1.50744 1.55924
1.47486 1.57096
WEEKLY CHART ( NEUTRAL )
The market is dominated by uncertainty. The occasionally prevailing trend lasts for a limited time and changes its direction too frequently. As long as the market remains unstable, we stay aside, waiting for the market to get back on track.
Support & Resistances
1.52666 1.59912
1.50518 1.62060
1.47707 1.64871

EURCAD ANALYSISEURCAD ANALYSIS
falling wedge
breakout
pullback
demand zone
confirmation buy
Please consider to put a like to my idea for supporting me & subscribe for more ideas.
Idea is not the financial advice!

Bullish Alt Bat PatternEURCAD BULLISH ALT BAT PATTERN
Market Buy Order Set Up.
Buy Entry: (1.53716)
Min Take-Profit: (1.54208)
Max Take-Profit: (1.54868)
Stop-Loss: (1.52620)
Max Risk-Reward: (1.05)
Smash a Like button and leave a Comment, I appreciate every support. Goodluck.

EURCAD long trade ideaPlan: resistance level breakout --> wait for the price to bounce off from support level --> wait for the rejection candle pattern to form e.g. bullish engulfing, pinbar, etc --> BUY
**Disclaimer** the content on this analysis is subject to change at any time without notice, and is provided for the sole purpose of assisting traders to make independent investment decisions.
Traders!! if you like my ideas and do take the same trade as I do, please write it in a comment so we can manage the trade together.
_____________________________________________________________________________________________________________________
Thank you for your support ;)
GWBFX

Bullish Alt Bat PatternEURCAD BULLISH ALT BAT PATTERN
Market Buy Order Set Up.
Buy Entry: (1.53958)
Min Take-Profit: (1.54682)
Max Take-Profit: (1.55167)
Stop-Loss: (1.53385)
Max Risk-Reward: (2.11)
Smash a Like button and leave a Comment, I appreciate every support. Goodluck.

EURCAD short trade ideaPlan: wait for the price to bounce off from resistance level --> wait for the rejection candle pattern to form e.g. bearish engulfing, pinbar, etc --> SELL
**Disclaimer** the content on this analysis is subject to change at any time without notice, and is provided for the sole purpose of assisting traders to make independent investment decisions.
Traders!! if you like my ideas and do take the same trade as I do, please write it in a comment so we can manage the trade together.
_____________________________________________________________________________________________________________________
Thank you for your support ;)
GWBFX

Bullish Shark PatternEURCAD BULLISH SHARK PATTERN
Market Buy Order Set Up.
Buy Entry: (1.52978)
Max Take-Profit: (1.53792)
Stop-Loss: (1.52379)
Max Risk-Reward: (1.36)
Smash a Like button and leave a Comment, I appreciate every support. Goodluck.

EURCAD short trade ideaPlan: wait for the price to bounce off from trendline or resistance level --> wait for the rejection candle pattern to form e.g. bearish engulfing, pinbar, etc --> SELL
**Disclaimer** the content on this analysis is subject to change at any time without notice, and is provided for the sole purpose of assisting traders to make independent investment decisions.
Traders!! if you like my ideas and do take the same trade as I do, please write it in the comment so we can manage the trade together.
_____________________________________________________________________________________________________________________
Thank you for your support ;)
GWBFX

EURCAD, Retesting Support, LongEURCAD, Retesting Support and continue Bullish uptrend! Trade when the Price action Tells!

EURCAD ( LET'S OPEN THE NEXT WEEK WITH EURCAD)looking for buying as long as price has tested the support

EURCAD - Price going to drop on DAILY H4?This trading idea is based on Daily & H4 timeframe. Possible to gain profit within the GREEN Zone for Short.
Disclaimer: If you choose to follow this trading idea you do so at your own risk after giving thorough and reasonable thought and consideration to your actions. All trading is high risk and one of the most difficult activities you will ever consider. Don’t trade with money you can’t afford to lose.

EURCAD: Diagonal pattern is over,
The pattern has finished in the range of 1.5461, the first confirmation for the buy order will be received when, the price crosses the range of 1.5592 . Also by crossing the price from the range of 1.5310, this analysis will be violated. The potential volume of target for the uptrend is too high and around 500 pips.

EURCAD: Diagonal pattern in the weekly chartEURCAD: Diagonal pattern in the weekly chart, Triangle pattern in the daily chart
( Weekly Chart )
In the weekly chart, the largest waves have a triple structure, so monitoring the charts shows the end of the chart is in a form of 3-wave pattern that starts from the range of 1.2129. According to these explanations, the price is forming an Ending Diagonal pattern in this time frame. In continuation, we will study the daily chart and the details of the movement.
( Daily Chart )
In the daily chart, the price is in the final wave of the Diagonal pattern, of which the B wave is forming the triangle pattern, and the movement is terminating. The uptrend formation and the end of the Triangle pattern can be confirmed by crossing the price from the range of 1.5785.
But the main point can be seen in the 240-minute chart, in this chart at the end of the E wave the Diagonal pattern is being formed. By crossing the price from the range of 1.5600 we can get the early confirmation to enter the completion of the Triangle pattern with targets of 1.6250 to 1.6300.

EURCAD I WISH EVERYONE COULD EAT THE PIPS WITH ME From the Daily time frame perspective EURCAD is ready to go LONG
Don't forget to like and follow us
