"EUR/CAD Price Pirate Mode: Long Entries Loading!"🔥🚨 "EUR/CAD BANK HEIST: The Ultimate Bullish Loot Grab! (Thief Trading Style) 🚨🔥
🌟 Greetings, Market Pirates & Profit Raiders! 🌟
(Hola! Oi! Bonjour! Hallo! Marhaba!)
The EUR/CAD "Euro vs Loonie" vault is WIDE OPEN—time to execute the Thief Trading Heist Plan! 🏦💰 Based on 🔥 high-probability technicals & stealthy fundamental analysis 🔥, here’s how we SWIPE THE LOOT before the bears catch on!
🎯 TRADE SETUP (Scalping/Day Heist)
📈 Entry (Bullish Raid):
"The vault door is cracked—enter anywhere!"
Pro Thief Move: Use buy limit orders near swing lows (15M/30M) for sneaky pullback entries.
Advanced Raid Tactics: Layer entries (DCA-style) for maximum loot efficiency.
🛑 Stop Loss (Escape Route):
Swing Low (4H) = 1.58800 (Adjust based on your risk tolerance & lot size!)
Thieves’ Golden Rule: "No heist is worth a jail sentence!" 🚔💨
🎯 Take Profit (Escape Before the Cops Arrive!):
Primary Target: 1.62300 (or exit early if resistance gets too hot!)
⚠️ Danger Zone: High-voltage resistance = Bear Trap Territory! ⚡🐻
💡 WHY THIS HEIST WILL WORK:
✅ Bullish Momentum Intact (Price structure favors buyers)
✅ Weak CAD Fundamentals (Loonie under pressure)
✅ Smart Money Algos Likely Pushing Higher (COT data hints at institutional bias)
📰 NEWS ALERT (Avoid the Market Police!)
🚨 Upcoming High-Impact Events?
Avoid new trades during news spikes!
Trailing stops = Your getaway car! 🚗💨
💥 BOOST THIS HEIST! (Let’s Get RICH Together!)
🔥 Hit the 👍 LIKE & 🚀 BOOST button to strengthen our robbery squad!
💬 Comment your entry & TP—let’s track the loot!
🔔 Follow for DAILY HEIST PLANS!
⚠️ DISCLAIMER (Stay Out of Jail!):
This is NOT financial advice—just a pirate’s treasure map! 🗺️
Manage risk like a pro thief—don’t blow your capital!
🚀 Ready to RAID? Let’s STEAL those pips! 🏴☠️💸
Eurcadlong

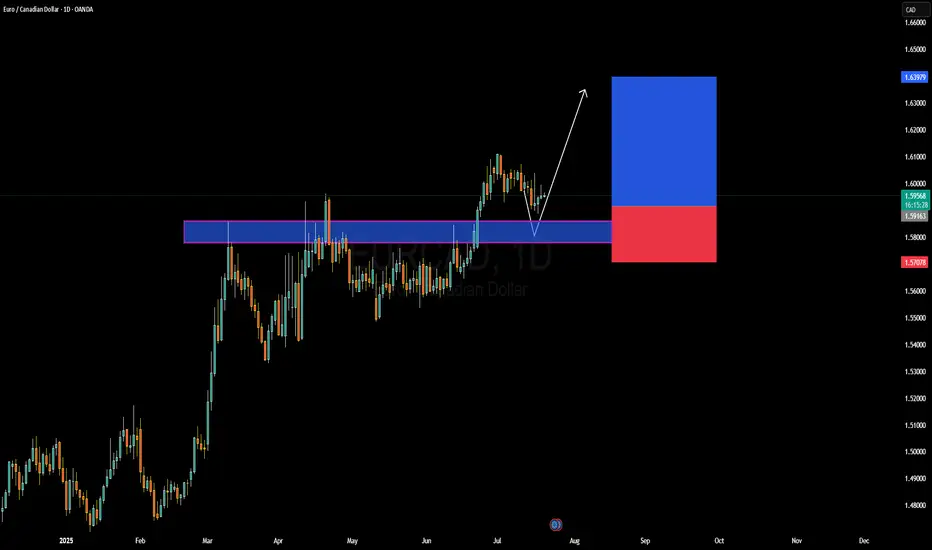
EURCAD Forming Bullish ContinuationEURCAD has recently respected a key demand zone and is now beginning to show early signs of bullish continuation. After a clean breakout above the 1.5900 resistance level earlier this month, price retested this structure and held strongly, creating a textbook bullish rejection wick. This price behavior suggests the pair is gearing up for another impulsive leg to the upside. I'm watching for follow-through momentum targeting the 1.6390–1.6400 zone in the coming weeks, aligning with the risk-to-reward setup visible on the chart.
From a fundamental perspective, the euro remains relatively supported following recent ECB comments signaling a more patient stance on future rate cuts. While inflation in the Eurozone has shown some signs of easing, policymakers remain cautious, especially with energy prices fluctuating again. On the other side, the Canadian dollar has been under pressure due to weaker-than-expected domestic growth and the Bank of Canada’s more dovish tone. Crude oil, which typically supports CAD, has been consolidating with no strong bullish drive lately, limiting CAD’s upside potential.
Technically, the current structure favors bullish continuation. The clean rejection from the previous resistance-turned-support, combined with bullish price action forming a higher low, reinforces the bullish setup. As long as the 1.5900 zone holds, this remains a high-probability long trade setup with potential to deliver strong profits in alignment with the trend.
Watch for daily closures above 1.6000 to confirm the next leg higher. Momentum indicators are flattening, and with liquidity sweeping both sides recently, it’s primed for a move. EURCAD remains on my radar for a swing buy opportunity, with the setup offering excellent technical confluence and favorable fundamental backing.
EURCAD – Two Key Levels, One Solid PlanOn this pair, we have two important levels:
🟡 The first level might act as a trap (stop hunting).
So don’t rush to buy — wait for confirmation.
🟢 The second level offers a safer buy opportunity.
As always, our plan stays firm —
we don’t tell the market what to do, we follow it.
🔻 If a clean break and valid pullback occurs on the first level,
a short trade toward the lower level is possible.
⚠️ This pullback short scenario is only valid until price reaches the lower level.
If price hits the lower level and starts moving up,
any short position becomes much riskier.
Discipline > Prediction.

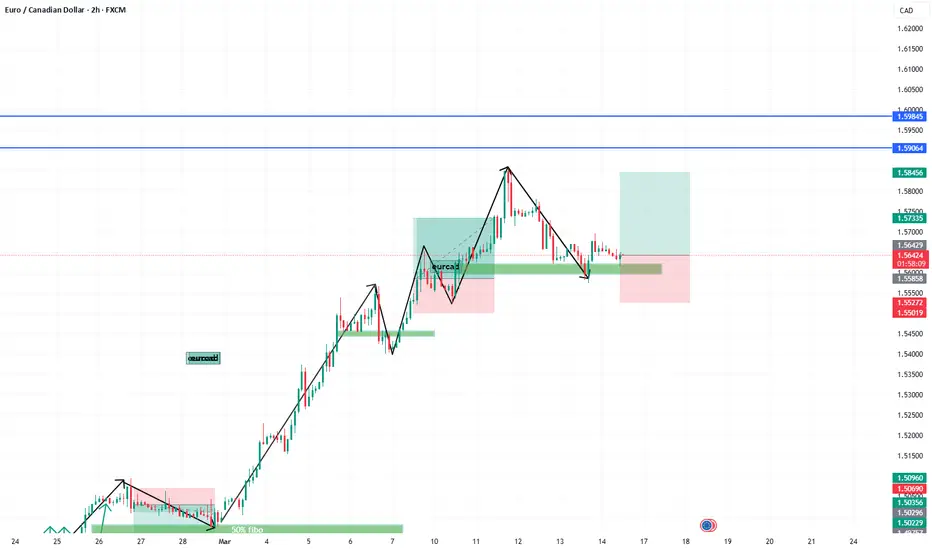
EURCAD LONGBy utilizing Fibonacci retracement levels, historical patterns, , we can formulate a hypothesis that the market might follow a similar trajectory if bullish sentiment prevails.

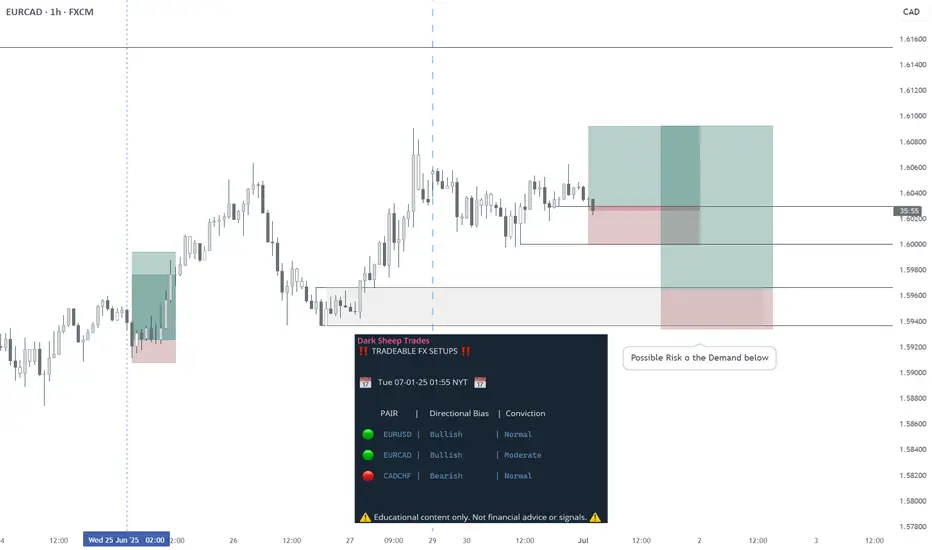
EURCAD - LONG - Statistically-backed FX shortlistEURCAD - LONG
Daily Outlook: Statistically-backed FX shortlist
@darksheeptrades
EUR/CAD Raid Alert: Last Chance to Loot This Bullish Breakout!🏴☠️ EUR/CAD LOOT ALERT: Can We Steal 100 Pips Before the Trap Springs? (Thief Trading Blueprint)
🌟 Hola! Bonjour! Ciao! Hallo! Marhaba! 🌟
Attention Forex Bandits & Loonie Raiders! 💶🦫💰
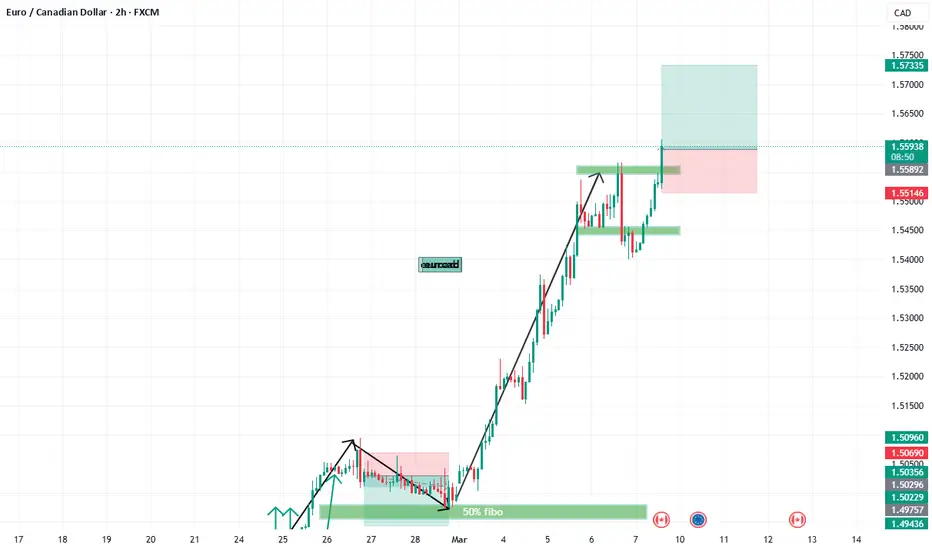
🔥 Thief Trading Intel: We're targeting EUR/CAD for a MA breakout heist! Long entry only - eyeing that 1.57200 breakout level. High-risk MA Zone ahead: overbought, consolidating, perfect for our ambush.
"Take your pips and vanish - this steal's on the house!" 💨💵
🚪 ENTRY: The Trap is Set!
📈 "Wait for MA breakout at 1.57200 - then STRIKE!"
Option 1: Buy Stop above MA (breakout confirmation)
Option 2: Buy Limit at swing levels (15-30 min TF)
📌 Pro Thief Move: SET THOSE ALERTS!
🛑 STOP LOSS: Escape Plan
🔊 "Listen up, rookies!" 🗣️
Breakout trades? NO SL until after confirmation!
Rebels: Place wherever... but sleep with one eye open! 👁️
📍 Smart Crew SL: Nearest swing low (1H TF)
🎯 TARGET: Loot & Scoot!
🎯 1.58200 (100 pips of pure profit!)
⚡ SCALPERS' QUICK HIT
👀 Long only!
Deep pockets? Raid now
Light wallet? Join swing heist
Trailing SL = Your Getaway Car! 🚗💨
📢 WHY THIS HEIST?
"Euro vs Loonie" showing strength! Watch for:
COT data & Macro trends
Intermarket analysis
Sentiment shifts
🔗 Full dossier? Bio0 links below! 👉🏻☝🏻👉🏻☝🏻
⚠️ WARNING: News = Police Raid! 📰🚨
CAD news moves fast! Protect your stash:
❌ No new trades during news
🔒 Trailing stops = Handcuff-proof profits
💖 SUPPORT THE CREW!
💥 SMASH THAT BOOST BUTTON! 💥
More boosts = bigger future scores!
Stronger crew = more pips for all!
Next currency heist coming soon... 💶🔫

EURCAD Analysis & The Blueprint for a Winning Trading Strategy📍 You’ve got to have a roadmap — a solid trading plan is absolutely essential 🧭.
In this video, I break down my personal trading plan and walk you through exactly how I approach the markets 🎯. I’m currently looking at EURCAD and there’s a lot happening on this chart 📉📊.
First things first: price action is clearly overextended 📈. The question is — do you really want to be buying at a premium? That’s where risk increases significantly ⚠️.
My approach is simple yet effective: I look for signs of reversal or a pullback into equilibrium 🌀 — then I wait for price to break structure before I act 📐.
Having a system in place that alerts you when key conditions are met is critical 🔔. That’s how you build consistency and gain a real edge in the market 🧠⚔️.
In this video, I’ll show you my strategy, how I plan a trade, what I’m looking for, and why patience is key 🧘♂️.
🛑 Don’t chase price. Let the setup come to you. Let the chart reveal its hand 🃏.
Not financial advice — always do your own research. 📚

Will EURCAD rise from a strong Support LevelHello Traders
In This Chart EURCAD HOURLY Forex Forecast By FOREX PLANET
today Gold analysis 👆
🟢This Chart includes_ (EURCAD market update)
🟢What is The Next Opportunity on EURCAD Market
🟢how to Enter to the Valid Entry With Assurance Profit
This CHART is For Trader's that Want to Improve Their Technical Analysis Skills and Their Trading By Understanding How To Analyze The Market Using Multiple Timeframes and Understanding The Bigger Picture on the Charts

EUR/CAD LongMacro fundamentals favor EUR strength: Strong Q1 GDP, sticky inflation, and no urgency for ECB rate cuts.
CAD is weakening: Oil prices are down ~15% for the month, BoC is leaning dovish, and trade risks remain elevated.
Technical structure is bullish: EUR/CAD broke above multi-year resistance at 1.5500. Price is now pulling back into that zone, which is likely to act as support (classic break-and-retest setup).
Monthly and weekly candles both support a bullish continuation, and this entry gives you a clean structure with tight risk and high reward potential.
EUR/CAD Swing Long Trade Setup
Entry: 1.5520 (buy limit)
Stop Loss: 1.5375 (below weekly structure and invalidation point)
Take Profit 1: 1.5800
Take Profit 2: 1.6000

EURCAD BUY/LONGBy utilizing Fibonacci retracement levels, historical patterns, , we can formulate a hypothesis that the market might follow a similar trajectory if bullish sentiment prevails.

EURCAD Buy setupOn EURCAD we are bullish for our next setup. Currently we are waiting for price to push till our areas of interest, where we will be looking to take long positions on this particular pair. Follow for more updates.

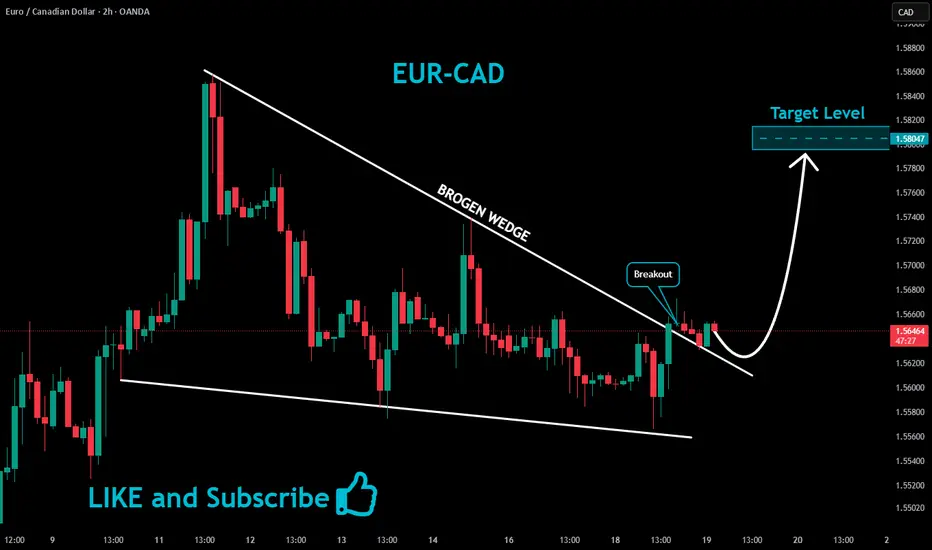
EURCAD Bullish Breakout!
HI,Traders !
EURCAD was trading in a
Narrowing wedge pattern
But now we are seeing a
Bullish breakout so we
Will be expecting a
Further bullish move up !
Comment and subscribe to help us grow !
EURCAD BUY ENTRYeurcad buy strong signal OANDA:EURCAD
reason is 1day uptrend so 4hr retracement key level touch and retracement

EURCAD BUY/LONGBy utilizing Fibonacci retracement levels, historical patterns, , we can formulate a hypothesis that the market might follow a similar trajectory if bullish sentiment prevails.
EURCAD BUY!So far Euro is in strong uptrend and presents a good buying oppurtunity against weak canadian dollar.....
Buy when 4hr candle closes above horizental line....
Please like and share your ideas...
(IMP: TODAY IS USI CPI NEWS)

EURCAD chart shows a Bullish Flag PatternThis EURCAD chart shows a **Bullish Flag Pattern**, as indicated on the chart.
**Key Observations:**
- **Bullish Flag Pattern**: This is a continuation pattern that typically signals a potential upward breakout after consolidation.
- **Resistance Zone**: Around **1.56200 - 1.56400**.
- **Support Zone**: Around **1.55600 - 1.55700**.
- **Moving Averages**: Price is trading above the moving averages, indicating bullish momentum.
- **Volume Analysis**: Increased volume on the breakout suggests strong buying pressure.
### **Trading Plan:**
- **Entry**: If price retraces to support and shows bullish confirmation, a buy trade can be placed near **1.55700 - 1.55800**.
- **Stop Loss (SL)**: Below **1.55400** to minimize risk.
- **Take Profit (TP)**: Around **1.57000 - 1.57500** in case of a breakout.

EURCAD Daily Trade Setup – Targeting Buy-Side Liquidity! 🔹 Daily FVG Mitigation: Price is currently in a Fair Value Gap (FVG) on the daily timeframe, indicating potential institutional interest.
🔹 Change of Character (ChoCH) on Daily: A bullish shift in structure suggests that smart money may be accumulating positions for an upward move.
🔹 Liquidity Target: The next expected move is towards Buy-Side Liquidity, where stop-loss clusters and pending orders reside.
📊 Trade Plan:
✅ Entry Confirmation: Lower timeframe (H4/M15) Break of Structure (BOS) + Order Block (OB) Retest
✅ Stop Loss: Below the last swing low or OB for proper risk management
✅ Take Profit: Buy-side liquidity level / Key resistance zones
✅ Risk-to-Reward Ratio: Minimum 1:3 to maximize potential gains
🔍 Key Considerations:
📈 Volume Confirmation: Institutional volume alignment (POC, HVN) for strong confirmation
⏳ London & NY Sessions: Best execution timings for high-probability moves
📅 Upcoming News Events: Watch for high-impact events that may influence EUR or CAD
⚠️ Risk Disclaimer: This is for educational purposes only, not financial advice. Manage your risk accordingly!
📊 What’s your bias on EURCAD? Comment below! 👇💬
#EURCAD #SmartMoneyConcepts #SMC #ICT #ForexTrading #LiquidityHunt #OrderBlocks #FairValueGap #ForexAnalysis 🚀📉

EUR/CAD Buy @ Support ZoneThe EUR/CAD pair on the M30 timeframe presents a Potential Buying Opportunity due to a recent Formation of a AB=CD Pattern. This suggests a shift in momentum towards the upside and a higher likelihood of further advances in the coming hours.
Possible Long Trade:
Entry: Consider Entering A Long Position around Trendline Of The Pattern.
Target Levels:
1st Resistance – 1.5128
2nd Resistance – 1.5185
🎁 Please hit the like button and
🎁 Leave a comment to support for My Post !
Your likes and comments are incredibly motivating and will encourage me to share more analysis with you.
Best Regards, KABHI_TA_TRADING
Thank you.

Buy EUR/CAD High Impact NewsThe EUR/CAD pair on the M15 timeframe presents a Potential Buying Opportunity due to a recent Formation of a Breakout Pattern. This suggests a shift in momentum towards the upside and a higher likelihood of further advances in the coming hours.
Possible Long Trade:
Entry: Consider Entering A Long Position around Trendline Of The Pattern.
Target Levels:
1st Resistance – 1.5086
2nd Resistance – 1.5124
🎁 Please hit the like button and
🎁 Leave a comment to support for My Post !
Your likes and comments are incredibly motivating and will encourage me to share more analysis with you.
Best Regards, KABHI_TA_TRADING
Thank you.

EURCAD is in a Bullish Pattern After Testing SupportHello Traders
In This Chart GOLD HOURLY Forex Forecast By FOREX PLANET
today Gold analysis 👆
🟢This Chart includes_ (GOLD market update)
🟢What is The Next Opportunity on GOLD Market
🟢how to Enter to the Valid Entry With Assurance Profit
This CHART is For Trader's that Want to Improve Their Technical Analysis Skills and Their Trading By Understanding How To Analyze The Market Using Multiple Timeframes and Understanding The Bigger Picture on the Charts

EUR/CAD Breakout – Trend Reversal or Bull Trap?OANDA:EURCAD Technical Analysis – February 26, 2025
Hello traders, this is Fuinvest, and today we’ll break down the EUR/CAD pair on the 4-hour timeframe, using a combination of Price Action and key indicators. Let’s get started!
1. Trend & Market Structure
Looking at the chart, EUR/CAD has made a strong breakout past its previous resistance levels and is currently trading around 1.5045. Earlier, price cleared all three key EMAs:
34 EMA (gray) – 1.4916
89 EMA (yellow) – 1.4893
200 EMA (red) – 1.4890
💡 Key Observations:
After consolidating around 1.4850 – 1.4900, price exploded upward with high momentum and strong volume.
The 34 EMA has crossed above the 89 EMA, signaling potential bullish continuation.
A decisive break above the 200 EMA could indicate a trend shift from bearish to bullish.
2. Key Support & Resistance Levels
📍 Support Zones:
1.4916 – 1.4930 (34 & 89 EMA support zone) → A key area to watch if price pulls back.
1.4890 (200 EMA support) → If price retests and holds, the bullish trend remains intact.
📍 Resistance Zones:
1.5050 – 1.5070 → Current price region; a key test for bulls.
1.5100 – 1.5150 → If this breaks, expect further upside movement.
3. Price Action & Key Insights
Strong breakout above the 200 EMA with high volume → Bulls are in control.
Bullish Marubozu candle indicates strong buying pressure.
Increased trading volume during the breakout → Likely institutional interest.
💡 What this means:
If price stays above the 34 & 89 EMA, expect continued bullish momentum.
If price rejects 1.5050 and forms a reversal pattern, we may see a short-term pullback.
4. Suggested Trading Strategies
✅ Trend-Following Buy Setup (Higher Probability)
🔹 Entry: Look for a pullback to 1.4916 – 1.4930 with a bullish confirmation.
🔹 Stop Loss: Below 1.4890 (under 200 EMA).
🔹 Target 1: 1.5050 – 1.5070.
🔹 Target 2: 1.5100 – 1.5150.
📌 Confirmation Needed: Bullish candlestick formation or price action indicating strong buyer interest.
❌ Short-Term Countertrend Sell Setup (Riskier Play)
🔹 Entry: If price struggles at 1.5050 – 1.5070 and forms a bearish reversal pattern.
🔹 Stop Loss: Above 1.5080 to avoid stop hunts.
🔹 Target: 1.4930 (89 EMA, dynamic support).
📌 Caution: This is a countertrend trade and carries higher risk. Execute only if clear bearish signals emerge.
5. Conclusion & Action Plan
🔹 The bullish breakout above the 200 EMA suggests a potential trend shift.
🔹 If price holds above 1.4930 – 1.4950, expect continuation toward 1.5100 – 1.5150.
🔹 A pullback to the 34 or 89 EMA could offer a strong buying opportunity.
🔹 If price fails at 1.5050, watch for possible bearish rejection signals.
💡 Final Advice: Don’t trade on emotions! Always have a clear risk management plan and wait for market confirmation before entering a trade.
📢 Follow Fuinvest for Daily Market Analysis!
If you found this analysis helpful, FOLLOW Fuinvest to receive daily technical insights and market updates. Stay ahead of the game and never miss a trading opportunity! 🚀
🔥 Trade safe and stay profitable! 🔥

EURCAD Aggressive Trade with Potential for Huge GainsI'll keep this short and to the point -
Technical Outlook:
Price recently hit a ceiling which has historically served as resistance (1.51750) , however we have been in an uptrend since late 2022. In Nov 2024 we saw bulls rally at strong levels of demand and continued to drive price upwards, creating a demand feed which price reacted off more recently (as shown on the chart).
Once price reached the ceiling level, it took a nose dive UNTIL we saw it decelerate at the latest demand feed, which could potentially have a trove of resting orders ready to be filled.
Trading Considerations:
I will be keeping an eye on the 15m chart during London and NY sessions for bullish momentum to take hold. As it stands right now, a break above 1.49050 would be early signs to get involved. This can always change as new structure is formed on the LTF's but we are deep in discount territory. Watch for liquidity build up and volume to understand which LTF demand levels could hold during high volume sessions.
Final Notes:
As added confluence, this pair is currently oversold on the RSI.
While navigating the LTF's make sure to adapt to changing conditions.
Again, this is another trade which could potentially turn into a swing position (provided demand holds, we could see an upward move that finally breaks the ceiling).
While the Euro continues to weaken against the USD, the Loonie should be able hold its own during this ongoing trade war (based on the fact that they've not just rolled over and do have some fight in them).
We get to witness these scary times unfold - and it makes trading that much more exciting!
Happy hunting predators!
Apex out!
OANDA:EURCAD FX:EURUSD OANDA:USDCAD
