EURCAD (Daily): LONG OPPORTUNITY Following the ASCENDING CHANNELHi traders and welcome to my channel, if you enjoy my FREE Technical Analysis , support the idea with a big LIK E👍 and don't forget to SUBSCRIBE my channel, you won't miss anything!
TECHNICAL ANALYSIS:
Since the end of July the price has been following a descending channel lasted until the beginning of November, the price then bounced on the main weekly trendline support and started now a new great uptrend.
The price's just reached a daily support area and the channel's dynamic support, the price action around this area will be helpful to understand and confirm the next uptrend!
CONCLUSION:
The new ascending channel seems to be confirmed and it's perfectly working, rejecting the price in the right moment.
Once I'll get a clear confirmation about a new uptrend, I'll definitely plan a long position!
Stay tuned for updates!
What's your opinion? Share your idea writing a comment!
Trade Safe and Responsibly
Gianni
Eurcadlong

#EURCAD Multi time frame Analysis Hey traders, here is the analysis for the EURCAD. NOTE - Please do your own analysis before taking the trade. Let me know if you guys have any questions in the comment section. If you guys like my analysis please hit like. Thanks.

EURCAD, 4hr tf, second chance to buy if you missed itHello my friends,
Previously i shared about a buy position for EURCAD on Sunday.
It was working out great and i managed to book some profit from it before it retrace down again.
Right now price once again retracing and i am gonna buy it again.
For those who missed it, this might be your second chance to buy it.
In my opinion we could see EURCAD breakout of this channel.
Our target this time will be the 1.618 fibonacci expansion which is our wave-3 target.
Buy limit EURCAD 1.5610
Stop loss 1.5560
Take profit 1.5770 (3.2R)
RR Ratio 1 : 3.2
Use only 1-2% risk
Good luck

EURCAD to see some upside For more than a week, EURCAD has been moving in a descending channel and respecting the trendiness very well. EC had broken some very significant resistance around 1.55336 and 1.55432 on December 17th that it looks like it is revisiting as this market steadily moves to the downside. On the daily, EURCAD has been moving in an ascending channel and is about to reach one of the trend lines. As it approaches this part of the daily ascending channel, the bottom of the descending channel, and a zone that was previously resistance and now may be respected as new support, I believe there will be great buying pressure here and the market will be pushed up. Signs of the Canadian dollar weakening should also push this pair up as the Euro will get stronger against the Canadian dollar. I'll be looking to go long around 1.55432 and will target right before the previous high.

EURCAD - SWING - 05. JANU. 2021Welcome to our weekly trade setup ( EURCAD )!
-
1 HOUR
Very bullish market structure and closure above main sr level.
4 HOUR
Overall good long entries, price action very bullish.
DAILY
Looks like a turnaround!
-
FOREX SWING
BUY EURCAD
ENTRY LEVEL @ 1.56350
SL @ 1.55760
TP @ 1.57180
Max Risk: 0.5% - 1%!
(Remember to add a few pips to all levels - different Brokers!)
Leave us a comment or like to keep our content for free and alive.
Have a great week everyone!
ALAN


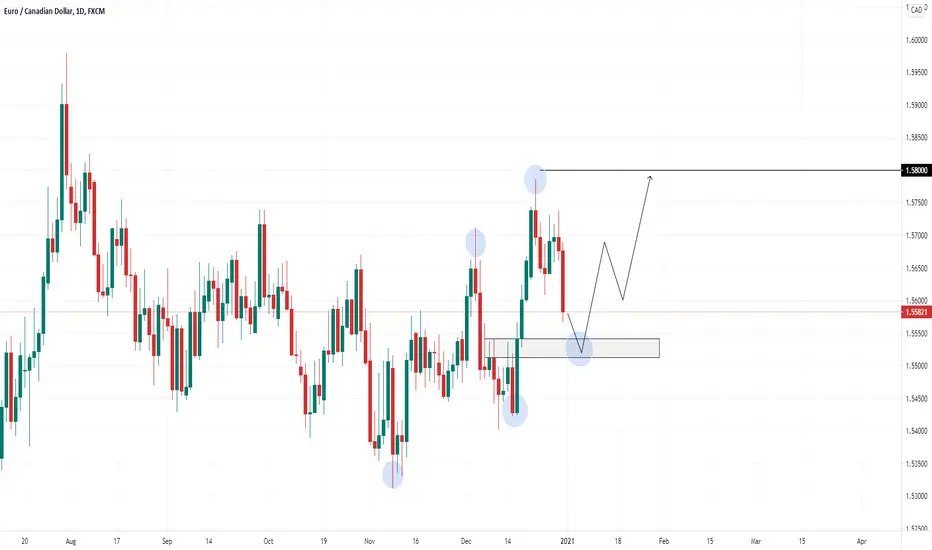
EURCAD LONG - POTENTIAL HIGHER DAILY LOW AND A PUSH HIGHEREURCAD has recently made a new high and is pulling back into previous daily resistance which is now turned daily support. If EURCAD can provide some bullish price action in this area, we could see another bullish swing for the pair giving us new swing high and potentially reach 1.58000
Like if you agree and if you have any questions, just drop a comment :)
EURCAD, 4hr tf, buy end of wave-iv at EMA-200Hello everyone,
We're going to start the first week of 2021 soon.
I am going to share all my plan for this first week to you all and hopefully it will be useful to all fellow traders here.
My first trading plan is EURCAD pairs.
As you can see price currently in an ABC correction inside a downward chanel.
There is an area of confluence support at 1.5570-80 level which will attract buyers in my opinion.
EMA-200 as a strong dynamic support + 61.8% fibonacci retracement + horizontal support level + downward channel support.
It will be no wonder if price shoot up from this area after touching it for a brief moment.
I am preparing 2 trading plan for EURCAD which has the same entry and SL but different take profits.
For conservative traders, you could take profit at the top of downward channel.
Aggresive traders could set take profit slightly below our next horizontal resistance at 1.5820.
BUY EURCAD 1.5570/80
Stop loss 1.5530
Take profit 1 at 1.5710 (3.5R)
Take profit 2 at 1.5820 (6.25R)
Use only 1-2% risk
Good luck

EURCAD I WISH EVERYONE COULD EAT THE PIPS WITH ME From the Daily time frame perspective EURCAD is ready to go LONG
Don't forget to like and follow us


EURCAD - SWING - 28. DECE. 2020Welcome to our weekly trade setup ( EURCAD )!
-
1 HOUR
Very bullish market open.
4 HOUR
Expecting more upside in this pair after a small pullback.
DAILY
Price turned back towards main sr level, good long entries!
-
FOREX SWING
BUY EURCAD
ENTRY LEVEL @ 1.56760
SL @ 1.56180
TP @ 1.57650
Max Risk: 0.5% - 1%!
(Remember to add a few pips to all levels - different Brokers!)
Leave us a comment or like to keep our content for free and alive.
Have a great week everyone!
ALAN

EURCAD - BUY- 28. DEC. 2020Daily Market Trade Ideas Based On Technical Analyzes 📊
⚙️ NEW SETUP EURCAD
📈 BUY price 1.57117
✔️ TAKE PROFIT price 1.57603
🛑 STOP LOSS price 1.56918
⬇️ Leave comment in comment section bellow
👍 Hit the LIKE to support content

EUR/CAD BUY IDEAHey tradomaniacs,
welcome to a new free trading-setup.
EUR/CAD: Daytrade-Preparation
Notice: This is meant to be a preparation for you. As Always we will have to wait for a confirmation!
Market-Buy: 1,56660
Stop-Loss: 1,56170
Point Of Risk-Reduction: 1,57070
Take-Profit: 1,57750
Stop-Loss: 49 pips
Risk: 0,5% - 1%
Risk-Reward: 2,21
LEAVE A LIKE AND A COMMENT - I appreciate every support! =)
Peace and good trades
Irasor
Wanna see more? Don`t forget to follow me.

EURCAD Long Trade BreakdownHey traders, here is the analysis for the EURCAD. NOTE - Please do your own analysis before taking the trade. Let me know if you guys have any questions in the comment section. If you guys like my analysis please hit like. Thanks.


EURCAD is facing bullish pressure, potential for a further rise!Price is facing bullish pressure from our first support at 1.54953, which is in line with our 100% Fibonacci extension and horizontal swing low support. It could potentially bounce from first support and rise further to our first resistance at 1.55366, in line with our 61.8% Fibonacci extension and horizontal swing high resistance. It is also worth noting that the Ichimoku cloud is also showing bullish pressure in line with our analysis, and the Stochastic indicator has also just bounced from the ascending trendline as well.
Trading CFDs on margin carries high risk.
Losses can exceed the initial investment so please ensure you fully understand the risks.

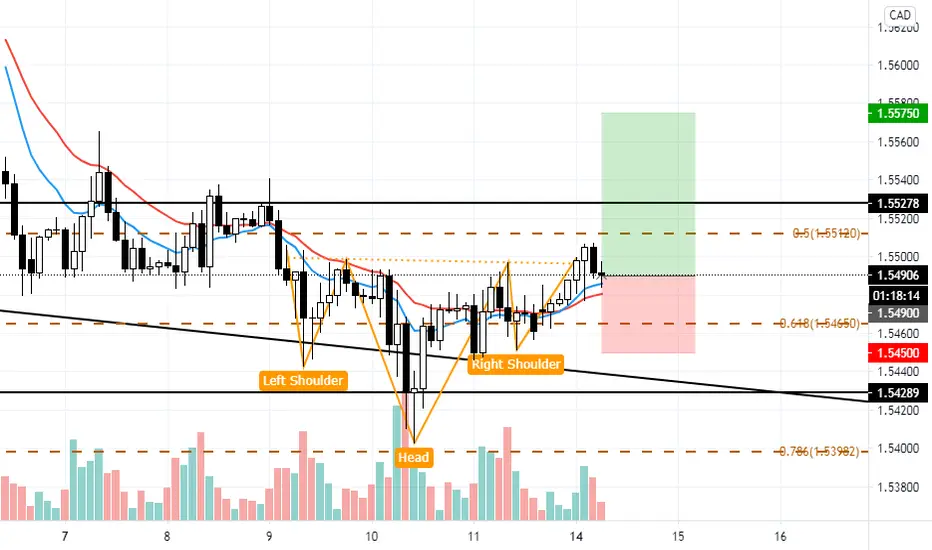
EURCAD, 2hr tf, inverted HnS pattern to materializedHello my friends,
For today i saw an inverted HnS pattern on EURCAD pair.
This pattern occurs on 2hr tf so it might be a bit small in range but worth to try.
We will keep it simple with only price action, you can see price broken above the neckline with a solid candle close above.
The candle looks like a bullish pinbar so i think this is a confirmation candle as well.
Buy EURCAD 1.5490
Stop loss 1.5450
Take profit 1.5570 (2R)
RR Ratio 1 : 2
Use only 1-2% risk
Good luck
$EURCAD Long off 200MA (Daily)$EURCAD
Entry: 1.54675
TP: 1.55050 (37.5 pips)
SL: 1.54325 (35 pips)
Daily timeframe. Entered this trade at the end of the day on Friday (12/11). This is basically a scalp as far as I'm concerned and hoping the take-profit level will be hit Monday or Tuesday. The risk to reward ratio is not ideal, but I'm liking a few things with this trade. Shooting star close to the day on Friday, preceded by a long wick below the 200 MA. Looking for a rebound here to at least the 30EMA and the bottom of the Ichimoku cloud. Stop loss level was set a comfortable distance below 200MA and LOD on Friday.
I have a feeling that there's room for a move upward to 1.559, but I don't want to commit myself to that until a daily close above 1.55240. Risking 2% of my account, as always.
-Zedro

EURCAD long trade ideaPlan: resistance level breakout --> wait for the price to bounce off from support level --> wait for the rejection candle pattern to form e.g. bullish engulfing, pinbar, etc --> BUY
**Disclaimer** the content on this analysis is subject to change at any time without notice, and is provided for the sole purpose of assisting traders to make independent investment decisions.
Traders!! if you like my ideas and do take the same trade as I do, please write it in a comment so we can manage the trade together.
_____________________________________________________________________________________________________________________
Thank you for your support ;)
GWBFX
