CADJPY Will Go Down!
HI,Traders !
CAD-JPY made a bearish
Breakout of the rising support
And is now consolidating
Below the line so we are
Bearish biased and we will
Be expecting a further
Bearish continuation !
Comment and subscribe to help us grow !
Eurcadsell

SHORT ON EUR/CADEUR/CAD has given us a nice CHOC (change of character) to the downside followed by a nice retest to supply.
I expect price to push up a little more into supply before dropping to the next support/demand level.
Looking to Catch 300-400 pips over the next few days.

EURCAD – Two Key Levels, One Solid PlanOn this pair, we have two important levels:
🟡 The first level might act as a trap (stop hunting).
So don’t rush to buy — wait for confirmation.
🟢 The second level offers a safer buy opportunity.
As always, our plan stays firm —
we don’t tell the market what to do, we follow it.
🔻 If a clean break and valid pullback occurs on the first level,
a short trade toward the lower level is possible.
⚠️ This pullback short scenario is only valid until price reaches the lower level.
If price hits the lower level and starts moving up,
any short position becomes much riskier.
Discipline > Prediction.

EURCAD Breakdown and Retest , All Eyes on SellingHello Traders
In This Chart EURCAD HOURLY Forex Forecast By FOREX PLANET
today EURCAD analysis 👆
🟢This Chart includes_ (EURCAD market update)
🟢What is The Next Opportunity on EURCAD Market
🟢how to Enter to the Valid Entry With Assurance Profit
This CHART is For Trader's that Want to Improve Their Technical Analysis Skills and Their Trading By Understanding How To Analyze The Market Using Multiple Timeframes and Understanding The Bigger Picture on the Charts

EURCAD Will Go Down!
HI,Traders !
EUR-CAD made a bearish
Breakout of the rising support
And is now consolidating
Below the line so we are
Bearish biased and we will
Be expecting a further
Bearish continuation !
Comment and subscribe to help us grow !

EURCAD - Overextended and Ready to Reverse?The EURCAD pair is showing clear signs of exhaustion in its bullish trend on the monthly chart, with an overextended price that has already liquidated a significant high. Futures market analysis confirms the accumulation of short positions, suggesting a potential bearish movement driven by institutional players. On the daily chart, the price has shifted to a clear downtrend.
Technical Analysis:
🔹 Monthly Chart:
The price has reached overextended levels, signaling a possible reversal.
A key high has been liquidated, indicating potential demand exhaustion.
🔹 Futures Market Data:
Short positions are accumulating, showing that major market participants are positioning for a bearish move.
Commercial market conditions reflect a weakening bullish sentiment.
🔹 Daily Chart:
Structural change confirms a bearish trend.
Possible selling opportunities on pullbacks to recent resistance levels.

EUR/CAD Best Place To Sell Very Clear , Ready For 250 Pips ?Here is my opinion on EUR/CAD , I See that the price will touch 1.59500 and then go down very hard cuz it`s a very good res area and forced the prices to go down very hard last time and prove that it`s a good res , so i will sell this pair when the price touch this area and give us a good bearish price action for confirmation .

EURCAD SELL.SHORTBy utilizing levels, historical patterns, , we can formulate a hypothesis that the market might follow a similar trajectory if bearish sentiment prevails.

EURCAD SELL/SHORTBy utilizing levels, historical patterns, , we can formulate a hypothesis that the market might follow a similar trajectory if bearish sentiment prevails.

EUR/CAD Trying To Breakout Strong Support , Be Ready For Sell !Here is my opinion about EUR/CAD , The price at very strong support and can`t close below it , so if we have a clear closure below it we can enter a sell trade with the retest and targeting 150 pips at least . just wait for the breakout and for bearish Price Action and then we can go down hard with it ! if we have not a closure below so this idea should be canceled .

EURCAD at 2009 Highs – Is a Massive 1,000 Pip Sell-Off Imminent?It's been a while since my last idea! (Too busy traveling lately 😅)
Today, we're zeroing in on a high-probability short setup on EURCAD. This pair has surged strongly since the start of the year, fueled by all the Trump-related market chaos.
Once we smashed through 1.52—last year's key resistance (a level where we previously banked over 600 pips on a massive drop)—the market has been steaming towards the next major SELL zone between 1.58 and 1.615. This area has been rock-solid resistance since 2009, causing significant sell-offs each time we've tested it. Can history repeat itself? Let’s dive into the charts.
Weekly Chart:
After the initial spike into our key zone in early March, we saw an immediate 600-pip rejection, but buyers quickly regrouped and drove the pair to fresh highs near 1.60. Crucially, we're now seeing a lack of follow-through on recent highs, which is a classic sign of buyer exhaustion. Even more telling, this week's candle is a spinning top—a textbook reversal signal.
Daily Chart:
Zooming into the daily timeframe, price action is becoming increasingly choppy with multiple rejection candles at the highs—clear signs that sellers are starting to step in. Additionally, MACD divergence is glaringly obvious, reinforcing the bearish setup.
4-Hour Chart:
At the 4-hour level, the market is now trapped in a tight sideways range between 1.57 (floor) and just above 1.58 (ceiling). The MACD continues to signal divergence—another strong indication that the bullish momentum is losing steam and a reversal is likely imminent.
How I'm Trading It:
Given all these signals, I'm using my TRFX indicator to build a long-term short position, targeting sell signals on the 8-hour and daily charts. The daily chart alone has been flashing multiple sell signals already (see below):
One last thing: Don’t be surprised by a quick fake-out spike toward the upper bound at 1.615—it’s very common in setups like these. Any sharp spike up should get quickly rejected, giving us another great selling opportunity.
Targets:
First Target: Last year's major resistance at 1.52—expect a reaction and possibly a bounce here.
Second Target: Longer term, I'm eyeing a deeper move toward the major support level around 1.43, offering a huge profit potential if the reversal fully plays out.
That's my game plan—let me know your thoughts below! 😊

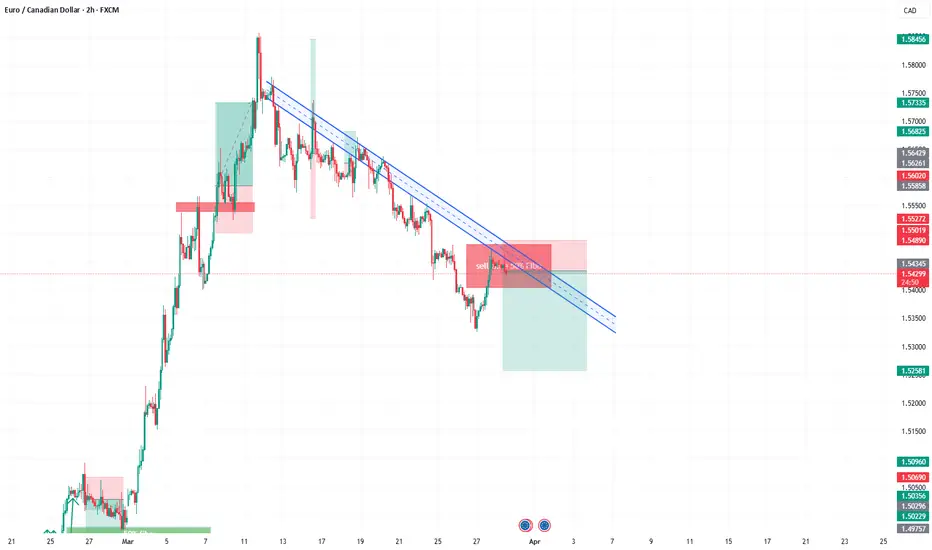
EUR/CAD Forex Bank Heist Plan (Day / Swing Trade)🌟Hi! Hola! Ola! Bonjour! Hallo! Marhaba!🌟
Dear Money Makers & Robbers, 🤑💰✈️
Based on 🔥Thief Trading style technical and fundamental analysis🔥, here is our master plan to heist the EUR/CAD "Euro vs Loonie" Forex Bank. Please adhere to the strategy I've outlined in the chart, which emphasizes short entry. Our aim is the high-risk Green Zone. Risky level, oversold market, consolidation, trend reversal, trap at the level where traders and bullish robbers are stronger. 🏆💸Book Profits Be wealthy and safe trade.💪🏆🎉
Entry 📈 : "The heist is on! Wait for the breakout (1.54200) then make your move - Bearish profits await!"
however I advise placing Sell Stop Orders below the breakout MA or Place Sell limit orders within a 15 or 30 minute timeframe. Entry from the most recent or closest low or high level should be in retest. I Highly recommended you to put alert in your chart.
Stop Loss 🛑: Thief SL placed at 1.56000 (swing / Day Trade Basis) Using the 2H period, the recent / swing high or low level.
SL is based on your risk of the trade, lot size and how many multiple orders you have to take.
Target 🎯: 1.51600 (or) Escape Before the Target
🧲Scalpers, take note 👀 : only scalp on the Short side. If you have a lot of money, you can go straight away; if not, you can join swing traders and carry out the robbery plan. Use trailing SL to safeguard your money 💰.
EUR/CAD "Euro vs Loonie" Forex Bank Heist Plan (Scalping / Day Trade) is currently experiencing a bearishness,., driven by several key factors.
📰🗞️Get & Read the Fundamental, Macro, COT Report, On Chain Analysis, Sentimental Outlook, Intermarket Analysis, Future trend targets.. go ahead to check 👉👉👉
⚠️Trading Alert : News Releases and Position Management 📰 🗞️ 🚫🚏
As a reminder, news releases can have a significant impact on market prices and volatility. To minimize potential losses and protect your running positions,
we recommend the following:
Avoid taking new trades during news releases
Use trailing stop-loss orders to protect your running positions and lock in profits
📌Please note that this is a general analysis and not personalized investment advice. It's essential to consider your own risk tolerance and market analysis before making any investment decisions.
💖Supporting our robbery plan 💥Hit the Boost Button💥 will enable us to effortlessly make and steal money 💰💵. Boost the strength of our robbery team. Every day in this market make money with ease by using the Thief Trading Style.🏆💪🤝❤️🎉🚀
I'll see you soon with another heist plan, so stay tuned 🤑🐱👤🤗🤩

EURCAD SELL/SHORTBy utilizing Fibonacci retracement levels, historical patterns, , we can formulate a hypothesis that the market might follow a similar trajectory if bearish sentiment prevails.
EURCAD at Key Resistance Zone - Potential Drop to 1.50180OANDA:EURCAD has reached a significant resistance zone, marked by prior price rejections, suggesting strong selling interest. This area has previously acted as a key supply zone, increasing the likelihood of a bearish reversal if sellers regain control.
If the price confirms resistance within this zone through bearish price action (e.g., wicks or rejection candles), we could see a move toward 1.50180, which represents a logical target based on recent structure.
However, if the price breaks and holds above this resistance area, the bearish outlook may be invalidated, potentially opening the door for further upside.
Just my take on support and resistance zones—not financial advice. Always confirm your setups and trade with solid risk management.
Best of luck!

EURCAD - Looking To Sell Pullbacks In The Short TermH1 - Bearish trend pattern
Currently it looks like a pullback is happening
Until the strong resistance zone holds I expect the price to move lower further after pullbacks.

EURCAD Resistance , All eyes on SellingHello Traders
In This Chart EURCAD HOURLY Forex Forecast By FOREX PLANET
today EURCAD analysis 👆
🟢This Chart includes_ (EURCAD market update)
🟢What is The Next Opportunity on EURCAD Market
🟢how to Enter to the Valid Entry With Assurance Profit
This CHART is For Trader's that Want to Improve Their Technical Analysis Skills and Their Trading By Understanding How To Analyze The Market Using Multiple Timeframes and Understanding The Bigger Picture on the Charts

EURCAD - Sell Setup at Clear Resistance ZoneOANDA:EURCAD is approaching a significant resistance zone. This zone has consistently acted as a key area of interest where sellers regained control, leading to reversals. If the price confirms rejection through bearish price action, such as wicks signaling rejection, I anticipate a move downward toward the 1.49600 level.
However, if the price successfully breaks and holds above the zone, this would invalidate the bearish outlook and could open the door for further upside.
Proper risk management is essential, given the possibility of price breaking higher.
This is not financial advice but rather how I approach support/resistance zones. Always wait for confirmation, like a rejection candle or volume spike before jumping in. And let me know what you think of this setup in the comments!

EURCAD Short From Resistance!
HI,Traders !
EUR-CAD keeps growing
And the pair is locally
Oversold so after it hits
A horizontal resistance
Of 1.51446 from where
We will be expecting a
Local bearish correction !
Comment and subscribe to help us grow !

EUR/CAD AnalysisI think EUR/CAD will go down from the 30-minute Oder Block.
You guys can short it from here by managing your risk.

EURCAD - Look for a short !!Hello traders!
‼️ This is my perspective on EURCAD.
Technical analysis: Here we are in a bearish market structure from 4H timeframe perspective, so I look for a short. Price almost filled the imbalance and formed hidden divergence for sell.
On H1 we have regular divergence in waves, short after BOS
Like, comment and subscribe to be in touch with my content!

EURCAD IdeaEURCAD has formed:
- on H4 timeframe: has formed a descending channel in red and now its retesting it on or the third touch so we're searching for a short (sell) trade on a lower timeframe
- on M30 timeframe as you all can see it formed an ascending trendline in blue with more than 3 touches so we can consider it as a valid trendline so we're waiting for a M3o candle to close below the last touch so we enter a short (sell) trade
Follow us for more idea and analysis

EURCAD - Short active !!Hello traders!
‼️ This is my perspective on EURCAD.
Technical analysis: Here we are in a bearish market structure from 4H timeframe perspective, so I look for a short. I expect bearish price action after price rejected from bearish OB + institutional big figure 1.49000.
Like, comment and subscribe to be in touch with my content!

#EURCAD 1DAYEURCAD (1D Timeframe) Analysis
Market Structure:
Support Trendline Breakdown: The price has broken below a key ascending trendline support, indicating potential weakness and bearish pressure.
Forecast:
Wait for Retest, Then Sell: A retest of the broken trendline as new resistance could provide confirmation for a selling opportunity.
Key Levels to Watch:
Entry Zone: Look for price rejection at the retest of the trendline or near resistance areas before entering a sell position.
Risk Management:
Stop Loss: Placed above the retest zone or recent swing high to limit risk.
Take Profit Zones: Target nearby support levels or Fibonacci extensions for potential downside moves.
Market Sentiment:
Bearish Bias: The breakdown suggests sellers are gaining control, but waiting for a retest offers a safer entry point to confirm the trend reversal.
