EUR/CAD Raid Alert: Last Chance to Loot This Bullish Breakout!🏴☠️ EUR/CAD LOOT ALERT: Can We Steal 100 Pips Before the Trap Springs? (Thief Trading Blueprint)
🌟 Hola! Bonjour! Ciao! Hallo! Marhaba! 🌟
Attention Forex Bandits & Loonie Raiders! 💶🦫💰
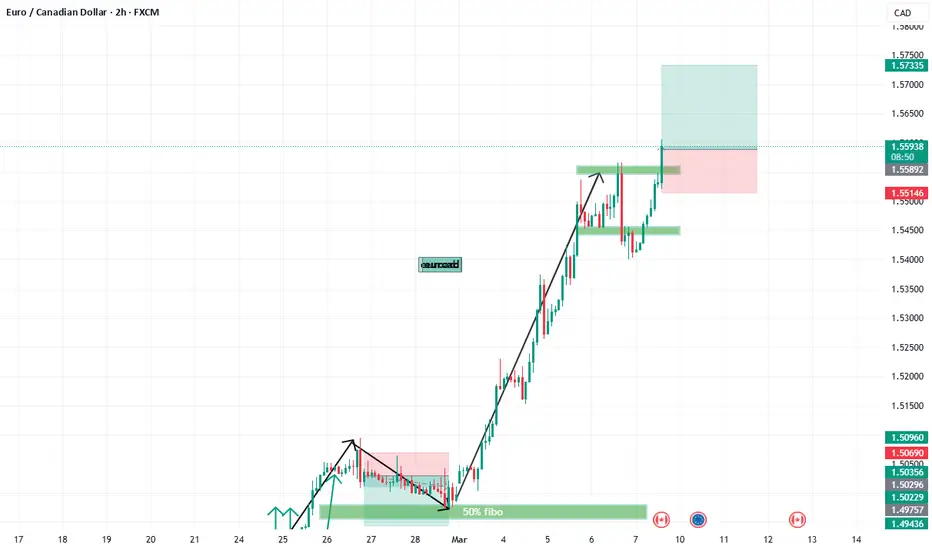
🔥 Thief Trading Intel: We're targeting EUR/CAD for a MA breakout heist! Long entry only - eyeing that 1.57200 breakout level. High-risk MA Zone ahead: overbought, consolidating, perfect for our ambush.
"Take your pips and vanish - this steal's on the house!" 💨💵
🚪 ENTRY: The Trap is Set!
📈 "Wait for MA breakout at 1.57200 - then STRIKE!"
Option 1: Buy Stop above MA (breakout confirmation)
Option 2: Buy Limit at swing levels (15-30 min TF)
📌 Pro Thief Move: SET THOSE ALERTS!
🛑 STOP LOSS: Escape Plan
🔊 "Listen up, rookies!" 🗣️
Breakout trades? NO SL until after confirmation!
Rebels: Place wherever... but sleep with one eye open! 👁️
📍 Smart Crew SL: Nearest swing low (1H TF)
🎯 TARGET: Loot & Scoot!
🎯 1.58200 (100 pips of pure profit!)
⚡ SCALPERS' QUICK HIT
👀 Long only!
Deep pockets? Raid now
Light wallet? Join swing heist
Trailing SL = Your Getaway Car! 🚗💨
📢 WHY THIS HEIST?
"Euro vs Loonie" showing strength! Watch for:
COT data & Macro trends
Intermarket analysis
Sentiment shifts
🔗 Full dossier? Bio0 links below! 👉🏻☝🏻👉🏻☝🏻
⚠️ WARNING: News = Police Raid! 📰🚨
CAD news moves fast! Protect your stash:
❌ No new trades during news
🔒 Trailing stops = Handcuff-proof profits
💖 SUPPORT THE CREW!
💥 SMASH THAT BOOST BUTTON! 💥
More boosts = bigger future scores!
Stronger crew = more pips for all!
Next currency heist coming soon... 💶🔫
Eurcadsignals

EURCAD Buy signal on 2023 fractal.It's been too long since we last looked on the EURCAD pair (November 29 2024, see chart below) but it delivered nonetheless our 1.500 Target:
Thit time the price is consolidating after a strong February rally and posts a similar pattern to October 2022 - January 2023. The 1D RSI sequences between those fractals are identical and it is not technically unreasonable to expect again the bullish trend to be resumed and target the 1.382 Fibonacci extension at 1.62500.
-------------------------------------------------------------------------------
** Please LIKE 👍, FOLLOW ✅, SHARE 🙌 and COMMENT ✍ if you enjoy this idea! Also share your ideas and charts in the comments section below! This is best way to keep it relevant, support us, keep the content here free and allow the idea to reach as many people as possible. **
-------------------------------------------------------------------------------
💸💸💸💸💸💸
👇 👇 👇 👇 👇 👇

EUR/CAD Forex Bank Heist Plan (Day / Swing Trade)🌟Hi! Hola! Ola! Bonjour! Hallo! Marhaba!🌟
Dear Money Makers & Robbers, 🤑💰✈️
Based on 🔥Thief Trading style technical and fundamental analysis🔥, here is our master plan to heist the EUR/CAD "Euro vs Loonie" Forex Bank. Please adhere to the strategy I've outlined in the chart, which emphasizes short entry. Our aim is the high-risk Green Zone. Risky level, oversold market, consolidation, trend reversal, trap at the level where traders and bullish robbers are stronger. 🏆💸Book Profits Be wealthy and safe trade.💪🏆🎉
Entry 📈 : "The heist is on! Wait for the breakout (1.54200) then make your move - Bearish profits await!"
however I advise placing Sell Stop Orders below the breakout MA or Place Sell limit orders within a 15 or 30 minute timeframe. Entry from the most recent or closest low or high level should be in retest. I Highly recommended you to put alert in your chart.
Stop Loss 🛑: Thief SL placed at 1.56000 (swing / Day Trade Basis) Using the 2H period, the recent / swing high or low level.
SL is based on your risk of the trade, lot size and how many multiple orders you have to take.
Target 🎯: 1.51600 (or) Escape Before the Target
🧲Scalpers, take note 👀 : only scalp on the Short side. If you have a lot of money, you can go straight away; if not, you can join swing traders and carry out the robbery plan. Use trailing SL to safeguard your money 💰.
EUR/CAD "Euro vs Loonie" Forex Bank Heist Plan (Scalping / Day Trade) is currently experiencing a bearishness,., driven by several key factors.
📰🗞️Get & Read the Fundamental, Macro, COT Report, On Chain Analysis, Sentimental Outlook, Intermarket Analysis, Future trend targets.. go ahead to check 👉👉👉
⚠️Trading Alert : News Releases and Position Management 📰 🗞️ 🚫🚏
As a reminder, news releases can have a significant impact on market prices and volatility. To minimize potential losses and protect your running positions,
we recommend the following:
Avoid taking new trades during news releases
Use trailing stop-loss orders to protect your running positions and lock in profits
📌Please note that this is a general analysis and not personalized investment advice. It's essential to consider your own risk tolerance and market analysis before making any investment decisions.
💖Supporting our robbery plan 💥Hit the Boost Button💥 will enable us to effortlessly make and steal money 💰💵. Boost the strength of our robbery team. Every day in this market make money with ease by using the Thief Trading Style.🏆💪🤝❤️🎉🚀
I'll see you soon with another heist plan, so stay tuned 🤑🐱👤🤗🤩

EURCAD Strong medium-term buy opportunity.The EURCAD pair gave us an excellent sell signal last time (September 12, see chart below) that easily hit our 1.46550 Target:
This time we have a confirmed bottom just a week ago on the 0.786 Channel Fibonacci level, similar to the June 08 2023 bottom, both accompanied by a 1D MACD Bullish Cross.
As a result, we turn bullish on this pair targeting 1.5000, which is just below the 0.236 Channel Fib, similar to the July 18 2023 High.
-------------------------------------------------------------------------------
** Please LIKE 👍, FOLLOW ✅, SHARE 🙌 and COMMENT ✍ if you enjoy this idea! Also share your ideas and charts in the comments section below! This is best way to keep it relevant, support us, keep the content here free and allow the idea to reach as many people as possible. **
-------------------------------------------------------------------------------
💸💸💸💸💸💸
👇 👇 👇 👇 👇 👇

EURCAD: Very Bearish Pattern 🇪🇺🇨🇦
EURCAD formed a cute head & shoulders pattern on a key daily horizontal resistance.
A bearish breakout of its horizontal neckline is a strong bearish signal
that signifies the strength of the sellers.
With a high probability, the pair will continue falling and reach
at least 1.47665 level.
❤️Please, support my work with like, thank you!❤️

EurCad could rise 200+ pipsSince late August 2022, EUR/CAD has been in a bullish trend, gaining approximately 1,000 pips. However, after reaching a local high in early August 2024, the pair began trading within a range, encountering clear resistance around the 1.5150–1.5200 zone.
Last Thursday, the pair rebounded from range support, forming a strong bullish engulfing candle on the daily chart, which suggests a promising outlook for continued upward movement. I am looking to buy on dips in EUR/CAD with a target around 1.5200, while the trade setup will be negated if the price falls below last week’s low.
A confirmed bullish signal would be a daily close above 1.5000.

EURCAD SELL TF D1 TP = 1.4616On the D1 chart the trend started on Aug. 22. (linear regression channel).
There is a high probability of profit taking. Possible take profit level is 1.4616
This level, which I have outlined above, is certainly not a “finish” level. But it is the level that has the “highest percentage of hits on target.”
Using a trailing stop is also a good idea!
Please leave your feedback, your opinion. I am very interested in it. Thank you!
Good luck!
Regards, WeBelievelnTrading

EURCAD Sell continuation signalThe EURCAD pair is trading on the 1D MA50 (blue trend-line) within the 10-month Channel Up. The previous time we had a peak rejection like this, the pair declined by at least -3.88%. The similarities even between the 1D RSI fractals are obvious. Our Target is 1.46550.
-------------------------------------------------------------------------------
** Please LIKE 👍, FOLLOW ✅, SHARE 🙌 and COMMENT ✍ if you enjoy this idea! Also share your ideas and charts in the comments section below! This is best way to keep it relevant, support us, keep the content here free and allow the idea to reach as many people as possible. **
-------------------------------------------------------------------------------
💸💸💸💸💸💸
👇 👇 👇 👇 👇 👇

EURCAD Testing the 1D MA50. Sell opportunity.The EURCAD pair eventually formed the new Lower High on the 17-month Channel Down as presented on our last analysis (May 27, see chart below) and got rejected:
The rejection extended to as low as the 1D MA200 (orange trend-line) and a short-term rebound has brought the price back to a 1D MA50 (blue trend-line) rejection.
Both previous Bearish Legs declined at least by -3.85%. We expect this 1D MA50 rejection to lead the price to at least Support 1, with our Target being 1.45000 (just above it).
On a side-note, check the high degree of symmetry between the 1D RSI sequences of the Channel's Legs.
-------------------------------------------------------------------------------
** Please LIKE 👍, FOLLOW ✅, SHARE 🙌 and COMMENT ✍ if you enjoy this idea! Also share your ideas and charts in the comments section below! This is best way to keep it relevant, support us, keep the content here free and allow the idea to reach as many people as possible. **
-------------------------------------------------------------------------------
💸💸💸💸💸💸
👇 👇 👇 👇 👇 👇

EURCAD Short-term buy signal.The EURCAD pair has been trading within a Channel Down for the past 15 months and right now is on a Bullish Leg towards its top. The 1D RSI is approaching the overbought barrier of 70.00 and we believe it will give a sell signal after it breaks above, just like November 21 2023 and July 14 2023.
Until then, we will stay bullish, targeting the top of the 15-month Channel Down at 1.49750.
-------------------------------------------------------------------------------
** Please LIKE 👍, FOLLOW ✅, SHARE 🙌 and COMMENT ✍ if you enjoy this idea! Also share your ideas and charts in the comments section below! This is best way to keep it relevant, support us, keep the content here free and allow the idea to reach as many people as possible. **
-------------------------------------------------------------------------------
💸💸💸💸💸💸
👇 👇 👇 👇 👇 👇

EURCAD Medium-term Sell SignalThe EURCAD pair has been trading within a 12-month Channel Down and is currently reversing after a Double Top rejection on Resistance 1 (1.47825). Following the 1D MACD Bearish Cross, this has the potential to initiate Phase 2 of the Bearish Leg that started on the November 21 2023 Lower High.
Technically this should be at least a -4.47% Bearish Wave, similar to the rejection that started on August 30 2023. As a result our Target is 1.41600 (Support 2).
-------------------------------------------------------------------------------
** Please LIKE 👍, FOLLOW ✅, SHARE 🙌 and COMMENT ✍ if you enjoy this idea! Also share your ideas and charts in the comments section below! This is best way to keep it relevant, support us, keep the content here free and allow the idea to reach as many people as possible. **
-------------------------------------------------------------------------------
💸💸💸💸💸💸
👇 👇 👇 👇 👇 👇

EURCAD I Potential intraday short opportunity Welcome back! Let me know your thoughts in the comments!
** EURCAD Analysis - Listen to video!
We recommend that you keep this pair on your watchlist and enter when the entry criteria of your strategy is met.
Please support this idea with a LIKE and COMMENT if you find it useful and Click "Follow" on our profile if you'd like these trade ideas delivered straight to your email in the future.
Thanks for your continued support!

EURCAD Sell signal on a confirmed break-out.The EURCAD pair broke below the 1D MA200 (orange trend-line) again after getting rejected on the 1D MA50 (blue trend-line), which establishes it as a Resistance. The long-term pattern is a Channel Down (blue) since the February 10 Low and the current (dotted) Channel Down is the Bearish Leg towards a new Lower Low.
We are taking this bearish break-out signal for the 2nd phase of the Leg and will target Support 1 at 1.43300. The downtrend can extend as low as 1.42180 and -5.50% from the High (as on the June 08 Low) but best settle for an established Support. If the 1D MACD completes a Bullish Cross before the 1.43300 target is achieved, we will close the short regardless, as all MACD Bullish Crosses below the 0.00 mark in 2023 have initiated very strong rallies.
-------------------------------------------------------------------------------
** Please LIKE 👍, FOLLOW ✅, SHARE 🙌 and COMMENT ✍ if you enjoy this idea! Also share your ideas and charts in the comments section below! This is best way to keep it relevant, support us, keep the content here free and allow the idea to reach as many people as possible. **
-------------------------------------------------------------------------------
💸💸💸💸💸💸
👇 👇 👇 👇 👇 👇

EURCAD: 21/11/2023:🔴Sell opportunity🔴You can see all the details on the charts.
Please pay attention: we need LTF confirmation for entry.
If you have questions, feel free to ask.
💡Wait for the update!
🗓21/11/2023
🔎 DYOR
💌It is my honor to share your comments with me💌

EURCAD: 10/11/2023:🟢Buy opportunity🟢You can see all the important zones and scenario on the chart.
If you have a question feel free to ask.
Please pay attention we need LTF confirmation to execute the buy position.
💡Wait for the update!
🗓10/11/2023
🔎 DYOR
💌It is my honor to share your comments with me💌

EURCAD Rally most likely coming to an end.The EURCAD pair has been rising since the September 28 bottom on the bullish leg of the 9-month Channel Down, turning both the 1D MA200 (orange trend-line) and the 1D MA50 (blue trend-line) into Supports. The uptrend hit the Internal Lower Highs trend-line last week, got rejected but was supported on the 1D MA200 and is testing it yet again today.
As the 1D RSI is making a Double Top rejection under the 2023 Resistance Zone, we may have the first medium-term sell signal emerging and a 1D MACD Bearish Cross will confirm it. In that case, sell and target the 1D MA50 at 1.4500. Those who wish to take some more risk, can extend selling to 1.4400 (-2.43% decline, in line with past pull-backs).
If however the pair closes a 1D candle above Resistance 1, we will take the loss on the sell position and open a buy instead, targeting Resistance 2 at 1.51000.
-------------------------------------------------------------------------------
** Please LIKE 👍, FOLLOW ✅, SHARE 🙌 and COMMENT ✍ if you enjoy this idea! Also share your ideas and charts in the comments section below! This is best way to keep it relevant, support us, keep the content here free and allow the idea to reach as many people as possible. **
-------------------------------------------------------------------------------
💸💸💸💸💸💸
👇 👇 👇 👇 👇 👇

EURCAD At a tipping point. Trade according to this Support Zone.The EURCAD pair has been decreasing since the August 30 High that formed the 1.48250 Resistance (1). Being below both the 1D MA50 (blue trend-line) and the 1D MA200 (orange trend-line), the long-term outlook looks bearish, considering also the fact that we may have completed a huge Head and Shoulders pattern since December.
However, the price is decelerating the downtrend as it approaches the 1.42850 - 1.42400 Support Zone (1 & 2), so as long as it holds, we will be bullish short-term targeting the Symmetrical Resistance Zone at 1.46000. If the price breaks below Support 2 (1.42400) we will instead sell and target 1.40250, which would be a -5.50% decline from the August 30 High. Both targets are respectively on the top (Lower Highs trend-line) and bottom (Lower Lows trend-line) of a potential Channel Down pattern that might emerge if the Head and Shoulders prevail.
Note that the 1D RSI is currently oversold, which currently favors the bullish case.
-------------------------------------------------------------------------------
** Please LIKE 👍, FOLLOW ✅, SHARE 🙌 and COMMENT ✍ if you enjoy this idea! Also share your ideas and charts in the comments section below! **
-------------------------------------------------------------------------------
💸💸💸💸💸💸
👇 👇 👇 👇 👇 👇

EURCAD Secondary bullish wave ahead.The EURCAD pair is consolidating on the 1D time-frame above both the 1D MA50 (blue trend-line) and 1D MA200 (orange trend-line). This analysis is basically an update on July's pull-back buy idea (see chart below):
The price is now entering the secondary bullish wave of this sequence, continuing to mirror the February - April fractal. However, we do have to lower our final target to 1.50190, which is the 1.236 Fibonacci extension, as the current sequence appears to be shorter than the one of February - April.
-------------------------------------------------------------------------------
** Please LIKE 👍, FOLLOW ✅, SHARE 🙌 and COMMENT ✍ if you enjoy this idea! Also share your ideas and charts in the comments section below! **
-------------------------------------------------------------------------------
💸💸💸💸💸💸
👇 👇 👇 👇 👇 👇

EUR CAD SHORT Risk 0.5%
TP1 = 1:2 RR
Disclaimer:
The contents in this Idea are intended for information purpose only and do not constitute investment recommendation or advice. Nor are they used to promote any specific products or services. They serve as an integral part of a case study to demonstrate fundamental concepts in risk management under given market scenarios. A full version of the disclaimer is available in our profile description.

EURCAD above the 1D MA50, aiming at 1.49250 by end of the month.The EURCAD pair has established trading above the 1D MA50 in the past 3 days and today should attempt to re-test it as a Support. Technically, this is the start of a bullish leg similar to Feb 15- Apr 25 towards the yearly High. Even though the last confirmation will be when the 1D RSI breaks above its Lower Highs trend-line, we are going already long on EURCAD to take advantage of the low price and target the 0.786 Fibonacci retracement level (1.49250) initially and the 1.51150 High in extension.
-------------------------------------------------------------------------------
** Please LIKE 👍, FOLLOW ✅, SHARE 🙌 and COMMENT ✍ if you enjoy this idea! Also share your ideas and charts in the comments section below! **
-------------------------------------------------------------------------------
💸💸💸💸💸💸
👇 👇 👇 👇 👇 👇


EURCAD Buy TF H4. TP = 1.4701On the 4-hour chart, the trend started on May 18 (linear regression channel).
There is a high probability of profit. A possible take profit level is 1.4701
But do not forget about the SL = 1.4511
Using a trailing stop is also a good idea!
Good luck!
Regards, WeBelieveInTrading
