EURCHF: Is That a Bearish Pattern?! 🇪🇺🇨🇭
After a test of a key horizontal resistance,
EURCHF dropped and violated a support line of a rising wedge pattern.
To me, it is a strong intraday bearish signal.
I think that the price may drop now to 0.9675
❤️Please, support my work with like, thank you!❤️
EURCHF

EURCHF Will Go Higher! Long!
Here is our detailed technical review for EURCHF.
Time Frame: 8h
Current Trend: Bullish
Sentiment: Oversold (based on 7-period RSI)
Forecast: Bullish
The market is testing a major horizontal structure 0.968.
Taking into consideration the structure & trend analysis, I believe that the market will reach 0.975 level soon.
P.S
The term oversold refers to a condition where an asset has traded lower in price and has the potential for a price bounce.
Overbought refers to market scenarios where the instrument is traded considerably higher than its fair value. Overvaluation is caused by market sentiments when there is positive news.
Like and subscribe and comment my ideas if you enjoy them!

EUR/CHF Harmonic Pattern Analysis: Anticipating Bearish Reversal___________________ Technical Analysis of EUR/CHF __________________________
Harmonic Pattern Analysis:
EUR/CHF has recently formed an XABCD harmonic pattern, indicating a potential reversal in the current trend. This pattern has manifested itself alongside the key resistance area, suggesting a significant level where bearish pressure may intensify.
Entry Strategy:
Considering the formation of the harmonic pattern and the positioning of the price at the key resistance area, it is advisable to initiate a short position near 0.98010. This entry point aligns with the anticipated bearish move from point D of the harmonic pattern.
Risk Management:
To effectively manage risk, a stop-loss order should be placed near 0.98370. This level is strategically chosen to mitigate potential losses in case of adverse price movements beyond our anticipated entry point.
Profit Targets:
Profit-taking objectives are set as follows:
- TP-1: 0.97650
- TP-2: 0.97295
- TP-3: 0.96918
These profit targets are based on technical analysis and aim to capitalize on potential downward price movements in EUR/CHF.
Conclusion:
In conclusion, the technical analysis of EUR/CHF suggests a bearish outlook, with the formation of a harmonic pattern and price action near a key resistance area. By adhering to the outlined entry, risk management, and profit-taking strategies, traders can position themselves to potentially capitalize on the anticipated bearish move in the currency pair.

EURCHF - 4hrs ( Sell Trade Target Range 180 PIP ) Pair Name : EUR/CHF
🗨Time Frame : 4hrs Chart / Close
➕Scale Type : Large Scale
------
🗒 spreading knowledge among us and to clarify the most important points of entry, exit and entry with more than 5 reasons
We seek to spread understanding rather than make money
✔️ Key Technical / Direction ( Short )
Type : Mid Term Swing
———————————
Bearish Break
0.96900
Reasons
- Major Turn level / W
- Channel Break
- visible Hvn
- Day + week Low Break
- Fibo Golden
- Choch Break
Bullish Reversal
0.95000 Area
Reasons
- Major Turn level
- Visible Range lvn
- Major Channel upper Band
- inner Channel Middle Line
- Quarter's Area
- Fibo Golden
- Choch Zone

Potential bearish reversalPrice is rising towards a resistance level which is an overlap resistance that aligns with the 38.2% Fibonacci retracement and could reverse from this level to our take profit.
Entry:0.97417
Why we like it:
There is an overlap resistance level which aligns with the 38.2% Fibonacci retracement.
Stop loss: 0.97917
Why we like it:
There is an overlap resistance level
Take profit: 0.96789
Why we like it:
There is a pullback support level
Please be advised that the information presented on TradingView is provided to Vantage (‘Vantage Global Limited’, ‘we’) by a third-party provider (‘Everest Fortune Group’). Please be reminded that you are solely responsible for the trading decisions on your account. There is a very high degree of risk involved in trading. Any information and/or content is intended entirely for research, educational and informational purposes only and does not constitute investment or consultation advice or investment strategy. The information is not tailored to the investment needs of any specific person and therefore does not involve a consideration of any of the investment objectives, financial situation or needs of any viewer that may receive it. Kindly also note that past performance is not a reliable indicator of future results. Actual results may differ materially from those anticipated in forward-looking or past performance statements. We assume no liability as to the accuracy or completeness of any of the information and/or content provided herein and the Company cannot be held responsible for any omission, mistake nor for any loss or damage including without limitation to any loss of profit which may arise from reliance on any information supplied by Everest Fortune Group.

EUR-CHF Will Grow! Buy!
Hello,Traders!
EUR-CHF has retested the
Strong horizontal support
Level of 0.9681 from where
We are already seeing a
Bullish rebound and
As we are bullish biased
We will be expecting
A further move up
Buy!
Like, comment and subscribe to help us grow!
Check out other forecasts below too!

EurChf LongI am going long on EurChf as it is bouncing off a support zone and has broken the resistance trend line on 1HR. My setup will be invalid if it breaks the previous support zone

EUR/CHF BUYERS WILL DOMINATE THE MARKET|LONG
Hello,Friends!
The BB lower band is nearby so EUR-CHF is in the oversold territory. Thus, despite the downtrend on the 1W timeframe I think that we will see a bullish reaction from the support line below and a move up towards the target at around 0.983.
✅LIKE AND COMMENT MY IDEAS✅

✅EUR_CHF TIME TO BUY|LONG🚀
✅EUR_CHF fell down sharply
But a strong support level was hit at 0.9680
Thus as a rebound is already happening
A move up towards the target shall follow at 0.9749
LONG🚀
✅Like and subscribe to never miss a new idea!✅

EURCHF Sell IdeaOANDA:EURCHF is showing weakness in its recent bullish rally. It has broken the last Higher Low of uptrend along with violation of strong ascending trendline. It may retrace towards fib 50-75% levels before continuing it's down trend, that's where we can look for short opportunities

#EURCHF is about to correct----------------EURCHF SHORT----------------
Although it seems like EURCHF currency pair had their first impulse leg to the upside on weekly timeframe I expect a correction from current zone on the daily timeframe. One more push to the upside it possible and after that we might see at least a pullback or a complex correction before it continues to the north. I consider entering market at these levels with a short trade but rather building a short position.
This is not financial advise by any means, do your own research and analysis before enter market!

EUR-CHF Swing Long! Buy!
Hello,Traders!
EUR-CHF went down and
Retested a weekly horizontal
Support level around 0.9679
And already made a rebound
So as the pair is trading in an
Uptrend I believe that we will
See a further move up
Buy!
Like, comment and subscribe to help us grow!
Check out other forecasts below too!

EURCHF Breakout and Potential retraceHey Traders, in today's trading session we are monitoring EURCHF for a buying opportunity around 0.96700 zone, EURCHF was trading in a downtrend and successfully managed to break it out. Currently is in a correction phase in which it is approaching the retrace area at 0.96700 support and resistance area.
Trade safe, Joe.

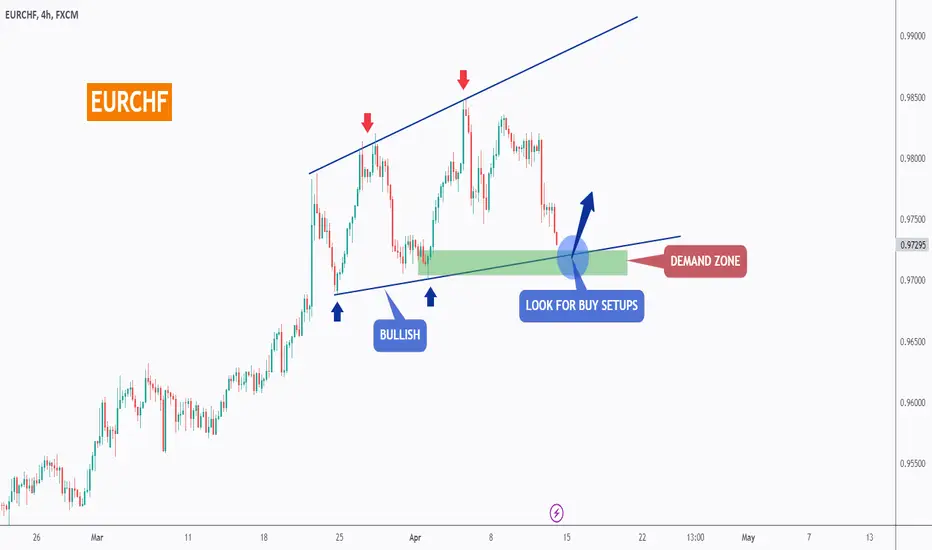
EURCHF - Wait For It ⏱Hello TradingView Family / Fellow Traders. This is Richard, also known as theSignalyst.
📈 EURCHF has been overall bullish , trading within the flat wedge pattern in blue.
Currently, EURCHF is in a correction phase, approaching the lower bound of the wedge.
Moreover, it is retesting a strong demand zone $0.972.
🏹 Thus, the highlighted blue circle is a strong area to look for buy setups as it is the intersection of the green demand zone and lower blue trendline.
📚 As per my trading style:
As #EURCHF approaches the blue circle zone, I will be looking for bullish reversal setups (like a double bottom pattern, trendline break , and so on...)
📚 Always follow your trading plan regarding entry, risk management, and trade management.
Good luck!
All Strategies Are Good; If Managed Properly!
~Rich
EURCHF Technical Analysis and Trade IdeaIn the video, we analyze the EURCHF currency pair. Our assessment identifies a potential buying opportunity. We’ll deconstruct the current price trend, meticulously evaluate recent price movements, take market dynamics into account, and identify a potential entry point based on favorable technical analysis. However, it’s essential to emphasize the importance of robust risk management practices. Please remember that this video is purely educational and should not be interpreted as financial advice.

EUR-CHF Bearish Breakout! Sell!
Hello,Traders!
EUR-CHF was trading along
The rising support line but
Now we are seeing a
Bearish breakout and the
Breakout is confirmed so
I think that we will see
A further move down
Sell!
Like, comment and subscribe to help us grow!
Check out other forecasts below too!

EURCHF: Bulls Will Push Higher
Our strategy, polished by years of trial and error has helped us identify what seems to be a great trading opportunity and we are here to share it with you as the time is ripe for us to buy EURCHF.
❤️ Please, support our work with like & comment! ❤️

EUR & CHF - The bad and the uglyWhat better way to start the new year than with a EURCHF long?
I am open to suggestions.
EUR view:
➡️ Inflation in the eurozone will rise slightly in early 2023 and climb towards the 3% mark🟢
➡️ In addition, however, it will fall more sharply in the following months than the ECB currently expects, forcing the ECB to cut interest rates earlier than planned🟢
➡️ My expectation here is March (at the earliest) or April 2024🟢
The CHF view explains why I still see the EURCHF strengthening in the short term:
➡️ The SNB will soon follow the ECB and also very likely make a 1st rate cut in the 1st half of 2024🟢
➡️ Although Swiss inflation will also briefly move back towards the 2% mark at the beginning of 2024, driven by rent increases and higher electricity prices, it will then also stabilise below the 2% mark again🟢
➡️ As soon as it returns from its skiing holiday in the Swiss Alps, the SNB will not be happy about the excessively high level of the CHF and will either tolerate a (slightly) weaker franc or even aim for it itself🟢
Conclusion:
The EURCHF therefore has room for a 200 - 300 pip upward move and will very likely tackle this in the new year, giving me a good start to the new year!:)

EUR/CHF Technical Analysis: Entry Opportunity IdentifiedAssumptions:
- EUR/CHF is observed to be adhering to a robust trendline channel, indicating a clear directional bias in the market.
- Entry is suggested at the prevailing price of 0.97560.
- Stop Loss is recommended to be placed near 0.96960 to mitigate potential downside risk.
- Take Profit levels are set at TP-1: 0.98150 and TP-2: 0.98760.
Analysis:
EUR/CHF has demonstrated resilience within its established trendline channel, affirming a bullish trajectory. The current price presents an opportune entry point, aligning with the upward momentum witnessed in recent sessions. A well-placed Stop Loss near 0.96960 provides a safeguard against adverse market movements while allowing for potential upside exploration.
Trade Recommendation:
Based on the technical analysis and assumptions outlined, a long position is advisable for EUR/CHF at the current price level of 0.97560. Traders are encouraged to exercise disciplined risk management practices by adhering to the suggested Stop Loss and Take Profit levels. TP-1 at 0.98150 and TP-2 at 0.98760 offer strategic exit points to capitalize on anticipated bullish movements.
Disclaimer:
This analysis is for informational purposes only and should not be construed as financial advice. Traders are urged to conduct their own thorough analysis and consider market dynamics before executing any trades. Past performance is not indicative of future results.

EURCHF: Channel Down top. Sell.EURCHF is approaching the top of the multi year Channel Down pattern with 1D on bullish technicals (RSI = 66.643, MACD = 0.006, ADX = 55.830) but with a weekly chart almost overbought. The 1D RSI has already posted its first LL which suggest an underlying Bearish Divergence. We turn bearish on this pair targeting the 0.5 Fibonacci (TP = 0.9600) like the previous corrective wave did.
See how our prior idea has worked out:
## If you like our free content follow our profile to get more daily ideas. ##
## Comments and likes are greatly appreciated. ##


EURCHF Is Going Up! Buy!
Take a look at our analysis for EURCHF.
Time Frame: 4h
Current Trend: Bullish
Sentiment: Oversold (based on 7-period RSI)
Forecast: Bullish
The market is trading around a solid horizontal structure 0.977.
The above observations make me that the market will inevitably achieve 0.981 level.
P.S
Overbought describes a period of time where there has been a significant and consistent upward move in price over a period of time without much pullback.
Like and subscribe and comment my ideas if you enjoy them!

EURCHF:🟢Is it bullish...?!🟢(Details on caption)This is a beautiful price action.
We can see a clear market maker-buy model here.
Smart money reversal and distribution phase one is already done, now we should wait to intermediate low form and then buy.
Now, I can see the steel side liquidity formed above and inside the FVG which is a high-probability scenario for buy.
If the price continues to create a higher high and higher low, we should wait for the price to grab the liquidity below the low and then look for a buying opportunity in a lower time frame.
💡Wait for the update!
🗓️08/04/2024
🔎 DYOR
💌It is my honor to share your comments with me💌
