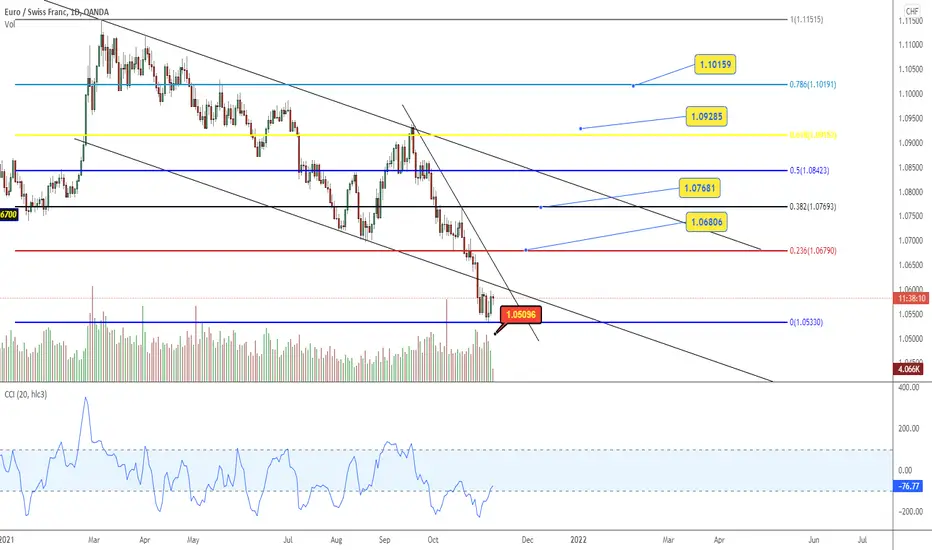
Great Opportunity +450 PIPS with 70PIPS Risk Only on EUR CHFAccording to Price Action Mixed With Fibo retracement
Corrective Wave to 78% Fibo Level
TP and SL
Eurchfanalysis
EURCHFBullish structure detected
Sl should be under the 1.05000 level
or depends on your risk management

eurchfEURCHF - Long
Why are we entering?
- Expecting EUR strength and CHF weakness = EURCHF LONG
- Approaching local double bottom
- If we dont bounce from here, watch bigger double bottom at 1.05
What is our confirmation?
- Bounce off the structure level (either one)
Entry
No Safe Entry.
Risk Entry: Bounce off either double bottom
Once entered, where will our Stoploss be?
- below the whichever structure level price bounces from
Where do we take profits?
First TP: 1.07
Second TP: 1.093
Third TP: 1.3

EURCHF INTRA-DAY BUYS Sorry for the background noise I was recording this with a baby in one hand lol, I don't usually cover exotic pairs but just wanted to give an example of my trading style and hopefully give you guys a new perspective or idea when looking for trades. Make sure risk is always capped to a comfortable amount and you trade according to your plan, have a good week guys!!

eurchfWhy are we entering?
- Approaching major structure level
- Anticipating EUR strength and possible CHF weakness = EURCHF LONG
What is our confirmation?
- Bounce off the structure level
- 2H trendline hack (2H EMA is respecting price - will be using that for confirmation)
= WFB break
Entry
SAFE Entry: Bounce off structure and then WFB
Risk Entry 1: break of WFB without the bounce
Once entered, where will our Stoploss be?
- below the major structure level
Where do we take profits?
First TP: 1.07
Second TP: 1.093
Third TP: 1.3


EURCHF shortThe trend at the higher time interval is down.
I have marked the zone and the price. I got a signal from the chart and opened positions

EURCHF BuyThis is my idea on EURCHF pair.
What do you guys think?
Trading rules:
TP1 partial close 30%
TP2 partial close 30% + moving SL to ENTRY point
TP3 letting run without risking lose.


EURCHF top-down analysisHello traders, this is the full breakdown of this pair. We will take this trade if all the conditions are satisfied as discussed in the analysis. Smash the like button if you find value in this analysis and drop a comment if you have any questions or let me know which pair to cover in my next analysis.

EURCHF Bullish Indicators:
1) Support zone 1.06807
2) Hammer candlestick on daily
Bearish Indicators:
1) Resistance zone 1.08602 Fib level 38.20%
2) Upward descending trendline
3) Downward trend
Plan A: After forming hammer on daily its looks like the pair will move upward from here and can test the upward trendline and the resistance zone of 1.08602.
Plan B: On the downside if the the pair broke the support zone of 1.06807 the pair can move further downside towards support zone of 1.06000.

EURCHF H1 TIMEFRAME ANALYSIS (Buy)We consider buying this EURCHF pair because of a strong support below. We know what we are doing and we do what the market is doing. This is more than an institutional analysis. Invest wisely. Thank you for following me on tradingview.

FOREX WEEKLY ANALYSIS : EURCHFFX:EURCHF
wait until price reaches the line and make higher high. then look for long signals in multiple time frames

TRADING SETUP FOR EURCHFAfter breakout of the triangle, I expect the price to retest the bottom line and from there I'll look to go short as shown on the chart.
What is your opinion on EURCHF?


EURCHF AnalysisPrice has bounced off a support zone that has proven to push the price up every time the price reaches the zone. This coming week, I will only be looking for opportunities to go long as shown.
*Disclaimer*
This is not financial advice. Forex trading is a risky business. Trade at your own risk.
#TradeLikeMagnatrio

EURCHF trading Ideajust same as other EURXXX pairs , EURCHF has also the strong chances of walking in long distance which is supporting technically long buy for next week. Now lets see, What happens!

EURCHF consolidating in a falling channel. Sell opportunity.Hello traders how are you ? Hope all are good.
So here is my simple H4 analysis of EURCHF.
We have two channels one is the D1 timeframe channel. And the second one is H1 and H4 channel which is being created to test the support of the D1 channel. Price is still consolidating in a small channel to hit its target of the major support. Hope you all understands what i am saying.
Have a good day traders.
Peace out.

EurChf can be a good swing buy tradeEurChf has changed its long term trend from bearish to bullish in May 2020 and the pair has risen 600 pips from that low to March 2021 high and this is a lot for this quiet pair.
From that top, a correction has started and the pair fell 400 pips.
At this moment EurChf is trading near a very strong support zone and a reversal is very probable.
I'm looking to buy


EURCHF ANALYSISEURCHF is near a strong support and psychological level at 1.07. Since November 2020 this level has not been broken so it’s a really good buying zone. We will be looking for buy entries if this support holds, last test it was a buy rally until 1.09200 so a good chance for a long term trade. If a candle manages to close below this support we need to look for sell entries if the support is really broken, wait for a retest for a confirmation and enter on a sell.

