Bullish bounce off overlap support?EUR/GBP is reacting off the support level which is an overlap support that lines up with the 23.6% Fibonacci retracement and could rise from this level to our take profit.
Entry: 0.8515
Why we like it:
There is an overlap support level that aligns with the 23.6% Fibonacci retracement.
Stop loss: 0.8482
Why we like it:
There is a pullback support level that is slightly below the 38.2% Fibonacci retracement.
Take profit: 0.8575
Why we like it:
There is a pullback resistance level.
Enjoying your TradingView experience? Review us!
Please be advised that the information presented on TradingView is provided to Vantage (‘Vantage Global Limited’, ‘we’) by a third-party provider (‘Everest Fortune Group’). Please be reminded that you are solely responsible for the trading decisions on your account. There is a very high degree of risk involved in trading. Any information and/or content is intended entirely for research, educational and informational purposes only and does not constitute investment or consultation advice or investment strategy. The information is not tailored to the investment needs of any specific person and therefore does not involve a consideration of any of the investment objectives, financial situation or needs of any viewer that may receive it. Kindly also note that past performance is not a reliable indicator of future results. Actual results may differ materially from those anticipated in forward-looking or past performance statements. We assume no liability as to the accuracy or completeness of any of the information and/or content provided herein and the Company cannot be held responsible for any omission, mistake nor for any loss or damage including without limitation to any loss of profit which may arise from reliance on any information supplied by Everest Fortune Group.
EURGBP

EURGBP: Bullish Continuation is Highly Probable! Here is Why:
It is essential that we apply multitimeframe technical analysis and there is no better example of why that is the case than the current EURGBP chart which, if analyzed properly, clearly points in the upward direction.
Disclosure: I am part of Trade Nation's Influencer program and receive a monthly fee for using their TradingView charts in my analysis.
❤️ Please, support our work with like & comment! ❤️

Buying the Top Was the TrapEURGBP has just broken structure on the 1H chart and is showing strong momentum to the downside. After taking out a key low, price is now sitting in a vulnerable spot, with a potential push even lower on the table .
A fair value gap sits just above, and price might return there before continuing its move down. If that happens, it could set up a clean lower high and another leg into the previous low.
This setup looks promising, but as always, wait for a shift in character on the lower timeframe before making any decisions . If that shift doesn't happen, price could still run deeper before any reaction.

EURGBP INTRADAY Bullish breakout supported at 0.8510Trend Overview:
EURGBP remains in a bullish trend, characterised by higher highs and higher lows. The recent intraday price action is forming a continuation consolidation pattern, suggesting a potential pause before a renewed move higher.
Key Technical Levels:
Support: 0.8510 (primary pivot), followed by 0.8490 and 0.8470
Resistance: 0.8570 (initial), then 0.8590 and 0.8620
Technical Outlook:
A pullback to the 0.8510 level, which aligns with the previous consolidation zone, could act as a platform for renewed buying interest. A confirmed bounce from this support may trigger a continuation toward the next resistance levels at 0.8570, 0.8590, and ultimately 0.8620.
Conversely, a daily close below 0.8510 would suggest weakening bullish momentum. This scenario would shift the bias to bearish in the short term, potentially targeting 0.8490 and 0.8470 as downside levels.
Conclusion:
WTI Crude Oil maintains a bullish structure while trading above the 0.8510 support. A bounce from this level would validate the consolidation as a continuation pattern, with upside potential toward the 08570 area. A breakdown below 0.8510, however, would invalidate this view and suggest deeper corrective risk.
This communication is for informational purposes only and should not be viewed as any form of recommendation as to a particular course of action or as investment advice. It is not intended as an offer or solicitation for the purchase or sale of any financial instrument or as an official confirmation of any transaction. Opinions, estimates and assumptions expressed herein are made as of the date of this communication and are subject to change without notice. This communication has been prepared based upon information, including market prices, data and other information, believed to be reliable; however, Trade Nation does not warrant its completeness or accuracy. All market prices and market data contained in or attached to this communication are indicative and subject to change without notice

EUR-GBP Growth Ahead! Buy!
Hello,Traders!
EUR-GBP keeps growing
And the pair is already
Making a bullish rebound
From the horizontal support
Level of 0.8540 so we are
Bullish biased and we will
Be expecting a further
Bullish continuation
Buy!
Comment and subscribe to help us grow!
Check out other forecasts below too!
Disclosure: I am part of Trade Nation's Influencer program and receive a monthly fee for using their TradingView charts in my analysis.

EUR_GBP WILL KEEP GROWI|LONG|
✅EUR_GBP broke the key horizontal level of 0.8540
Which is now a support then went down
To retest it and we are now seeing
A bullish reaction so I think that
The pair will go even higher up
LONG🚀
✅Like and subscribe to never miss a new idea!✅
Disclosure: I am part of Trade Nation's Influencer program and receive a monthly fee for using their TradingView charts in my analysis.

EURGBP: Bearish Forecast & Outlook
The charts are full of distraction, disturbance and are a graveyard of fear and greed which shall not cloud our judgement on the current state of affairs in the EURGBP pair price action which suggests a high likelihood of a coming move down.
Disclosure: I am part of Trade Nation's Influencer program and receive a monthly fee for using their TradingView charts in my analysis.
❤️ Please, support our work with like & comment! ❤️
EUR/GBP BEARS ARE STRONG HERE|SHORT
Hello, Friends!
Bearish trend on EUR/GBP, defined by the red colour of the last week candle combined with the fact the pair is overbought based on the BB upper band proximity, makes me expect a bearish rebound from the resistance line above and a retest of the local target below at 0.846.
Disclosure: I am part of Trade Nation's Influencer program and receive a monthly fee for using their TradingView charts in my analysis.
✅LIKE AND COMMENT MY IDEAS✅

EURGBP uptrend pause supported at 0.8510Trend Overview:
EURGBP remains in a bullish trend, characterised by higher highs and higher lows. The recent intraday price action is forming a continuation consolidation pattern, suggesting a potential pause before a renewed move higher.
Key Technical Levels:
Support: 0.8510 (primary pivot), followed by 0.8490 and 0.8470
Resistance: 0.8570 (initial), then 0.8590 and 0.8620
Technical Outlook:
A pullback to the 0.8510 level, which aligns with the previous consolidation zone, could act as a platform for renewed buying interest. A confirmed bounce from this support may trigger a continuation toward the next resistance levels at 0.8570, 0.8590, and ultimately 0.8620.
Conversely, a daily close below 0.8510 would suggest weakening bullish momentum. This scenario would shift the bias to bearish in the short term, potentially targeting 0.8490 and 0.8470 as downside levels.
Conclusion:
WTI Crude Oil maintains a bullish structure while trading above the 0.8510 support. A bounce from this level would validate the consolidation as a continuation pattern, with upside potential toward the 08570 area. A breakdown below 0.8510, however, would invalidate this view and suggest deeper corrective risk.
This communication is for informational purposes only and should not be viewed as any form of recommendation as to a particular course of action or as investment advice. It is not intended as an offer or solicitation for the purchase or sale of any financial instrument or as an official confirmation of any transaction. Opinions, estimates and assumptions expressed herein are made as of the date of this communication and are subject to change without notice. This communication has been prepared based upon information, including market prices, data and other information, believed to be reliable; however, Trade Nation does not warrant its completeness or accuracy. All market prices and market data contained in or attached to this communication are indicative and subject to change without notice

EURGBP INTRADAY trend reversal breakout?Trend Overview:
EURGBP remains in a bullish trend, characterised by higher highs and higher lows. The recent intraday price action is forming a continuation consolidation pattern, suggesting a potential pause before a renewed move higher.
Key Technical Levels:
Support: 0.8490 (primary pivot), followed by 0.8470 and 0.8450
Resistance: 0.8550 (initial), then 0.8570 and 0.8590
Technical Outlook:
A pullback to the 0.8490 level, which aligns with the previous consolidation zone, could act as a platform for renewed buying interest. A confirmed bounce from this support may trigger a continuation toward the next resistance levels at 0.8550, 0.8570, and ultimately 0.8590.
Conversely, a daily close below 0.8490 would suggest weakening bullish momentum. This scenario would shift the bias to bearish in the short term, potentially targeting 0.8470 and 0.8450 as downside levels.
Conclusion:
WTI Crude Oil maintains a bullish structure while trading above the 0.8490 support. A bounce from this level would validate the consolidation as a continuation pattern, with upside potential toward the 08550 area. A breakdown below 0.8490, however, would invalidate this view and suggest deeper corrective risk.
This communication is for informational purposes only and should not be viewed as any form of recommendation as to a particular course of action or as investment advice. It is not intended as an offer or solicitation for the purchase or sale of any financial instrument or as an official confirmation of any transaction. Opinions, estimates and assumptions expressed herein are made as of the date of this communication and are subject to change without notice. This communication has been prepared based upon information, including market prices, data and other information, believed to be reliable; however, Trade Nation does not warrant its completeness or accuracy. All market prices and market data contained in or attached to this communication are indicative and subject to change without notice.

EURGBP LONG FORECAST Q2 W25 D16 Y25EURGBP LONG FORECAST Q2 W25 D16 Y25
Professional Risk Managers👋
Welcome back to another FRGNT chart update📈
Diving into some Forex setups using predominantly higher time frame order blocks alongside confirmation breaks of structure.
Let’s see what price action is telling us today! 👀
💡Here are some trade confluences📝
✅Weekly Order block rejection
✅15' Order block to be confirmed
✅4H Order block identification
✅HTF 50 EMA support
🔑 Remember, to participate in trading comes always with a degree of risk, therefore as professional risk managers it remains vital that we stick to our risk management plan as well as our trading strategies.
📈The rest, we leave to the balance of probabilities.
💡Fail to plan. Plan to fail.
🏆It has always been that simple.
❤️Good luck with your trading journey, I shall see you at the very top.
🎯Trade consistent, FRGNT X

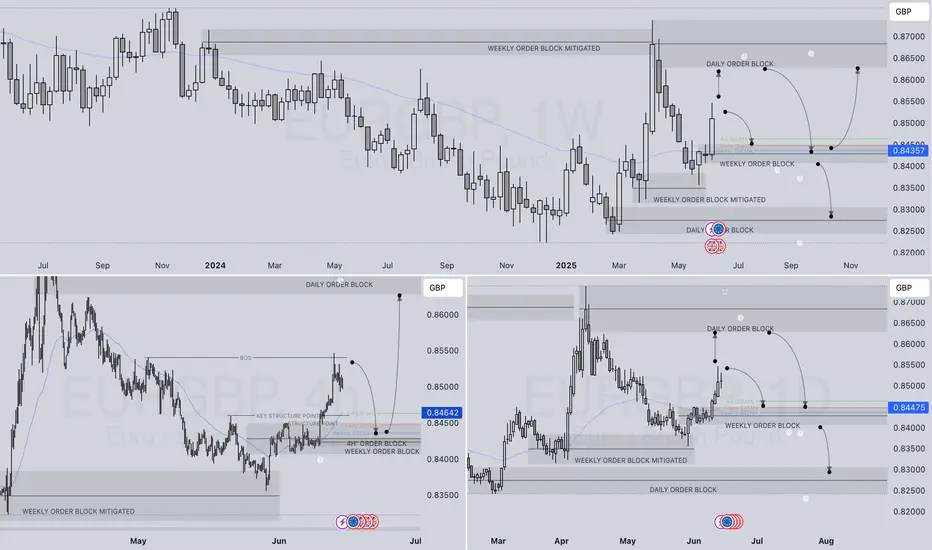
EURGBP WEEKLY HTF FORECAST Q2 W25 Y25EURGBP WEEKLY HTF FORECAST Q2 W25 Y25
Professional Risk Managers👋
Welcome back to another FRGNT chart update📈
Diving into some Forex setups using predominantly higher time frame order blocks alongside confirmation breaks of structure.
🔑 Remember, to participate in trading comes always with a degree of risk, therefore as professional risk managers it remains vital that we stick to our risk management plan as well as our trading strategies.
📈The rest, we leave to the balance of probabilities.
💡Fail to plan. Plan to fail.
🏆It has always been that simple.
❤️Good luck with your trading journey, I shall see you at the very top.
🎯Trade consistent, FRGNT X
EUR/GBP 4H Bullish Breakout Trade Setup – Demand Zone to 0.85250📉 Trendline Break
🔵 A key trendline was broken 🔽 (bearish ➡️ bullish shift).
✂️ This break signals potential upside movement as sellers lose control.
🟦 Demand Zone (BUY Area)
📍 Zone: 0.83967 – 0.84249
🛒 Buyers expected here!
🟢 Price may pull back here before heading up.
🟡 This is marked as the ENTRY POINT zone.
🔴 Stop Loss Zone
📍 Level: 0.83977
❌ Place stop loss just below the demand zone.
🛡️ Protects against downside breakout risk.
🟧 Resistance Zone
📍 Around: 0.84500 – 0.84600
⚠️ Price may face resistance temporarily before continuing the upward move.
📏 Testing this area confirms strength.
🟩 Target Zone
🎯 Target Point: 0.85250
💸 If the trade plays out, this is where profit is expected.
🚀 Bullish target above the resistance zone.
✅ Trade Setup Summary
🧩 Details
🟦 Entry 0.84240 (inside demand zone)
🔴 Stop Loss 0.83977 (below demand zone)
🟩 Target 0.85250 (above resistance)
📈 R/R Ratio ~1:4 (great risk/reward!)
🔍 Final Outlook:
🟠 Watch for: Pullback to entry zone
🟢 Then look for: Bullish candlestick confirmation
🚀 Goal: Ride it up to 0.85250 with strong momentum

EUR/GBP 8H Buy Setup (Free Trade)📍 EUR/GBP 8H Buy Setup
Price just tapped into a clear demand zone at the 71% Fibonacci retracement — textbook wave (4) retrace in a bullish Elliott sequence. This is also our Point of Interest (POI) to catch the next leg higher into wave (5), targeting buy-side liquidity.
🟢 Confluences:
Demand zone respected
71% Fib retracement
Ichimoku Kumo twist → bullish confirmation
Structure break + strong impulsive wave (3)
🔔 Buying from here offers a clean R:R back to the highs. Let’s ride this final wave!

EURGBP INTRADAY corrective pullback The EUR/GBP currency pair is showing a bullish bias, supported by a sustained rising trend and a recent bullish breakout above a prior consolidation zone. Price action has breached the upper boundary of the consolidation range, indicating renewed upside momentum.
Key Technical Levels:
Support:
0.8450 – Former resistance, now acting as immediate support.
0.8425 – Secondary support in case of a deeper pullback.
0.8400 – Major support and psychological round number.
Resistance:
0.8540 – Initial upside target.
0.8560 – Intermediate resistance.
0.8575 – Long-term resistance level.
A corrective pullback toward the 0.8450 support followed by a bullish rebound could reinforce the current trend and open the path toward 0.8540 and higher. However, a daily close below 0.8450 would invalidate the bullish scenario and signal further downside toward 0.8425 and potentially 0.8400.
Conclusion:
The near-term outlook for EUR/GBP remains bullish as long as the pair holds above 0.8450. A successful retest of this level would confirm breakout strength and support continuation toward 0.8540–0.8575. Conversely, a break below 0.8450 would shift the bias to neutral to bearish, suggesting further downside correction.
This communication is for informational purposes only and should not be viewed as any form of recommendation as to a particular course of action or as investment advice. It is not intended as an offer or solicitation for the purchase or sale of any financial instrument or as an official confirmation of any transaction. Opinions, estimates and assumptions expressed herein are made as of the date of this communication and are subject to change without notice. This communication has been prepared based upon information, including market prices, data and other information, believed to be reliable; however, Trade Nation does not warrant its completeness or accuracy. All market prices and market data contained in or attached to this communication are indicative and subject to change without notice.
Eurgbp Buy price is currently bullish on 4hr timeframe. its trading around the 4hr demand zone and there are also lower timeframe demands zones within the 4hr demand zone add stregnth to it. there are multiple pois above current pirce action which may fuel the buy bias. im wating for price to break a 5min supply zone thats near a 4hr poi in order to enter the trade.

EURUSD, GBPUSD & EURGBP analysisHere's my outlook on the 3 pairs mentioned in the title. Looking for more upside momentum after we have some sort of pullback into the premium discount prices.
Once we get some15min bearish internal orderflow on the lower Time Frames I will look to enter short term sell positions before looking to take longer term buys on the way back up.
Again, if I can be of any assistance please do let me know and I will be happy to help where I can.

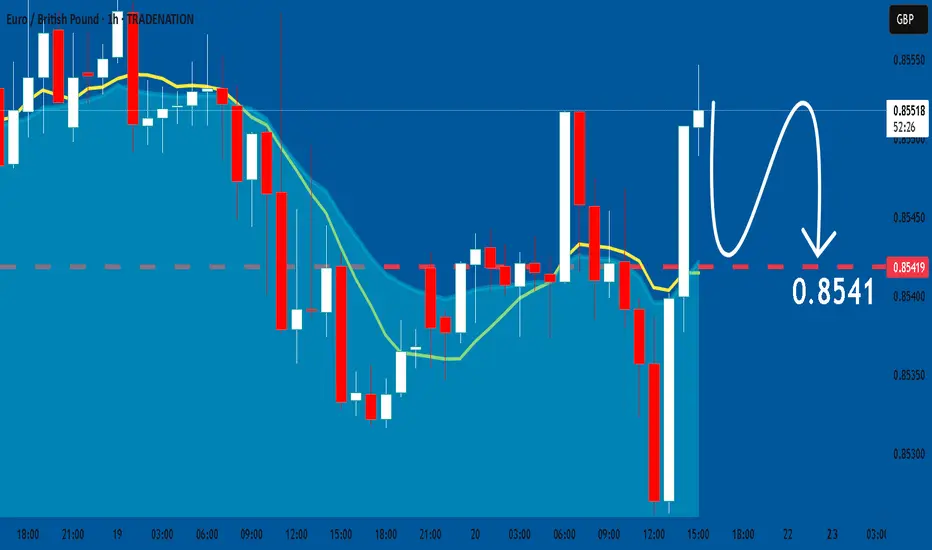
EURGBP: Overbought Market & Pullback🇪🇺🇬🇧
EURGBP nicely respected a key daily horizontal resistance.
After a liquidity grab above that, the price formed
a strong bearish imbalance candle on an hourly time frame.
I think that the pair will retrace to 0.85
❤️Please, support my work with like, thank you!❤️
I am part of Trade Nation's Influencer program and receive a monthly fee for using their TradingView charts in my analysis.

EURGBP INTRADAY trend reversal breakout The EUR/GBP currency pair is showing a bullish bias, supported by a sustained rising trend and a recent bullish breakout above a prior consolidation zone. Price action has breached the upper boundary of the consolidation range, indicating renewed upside momentum.
Key Technical Levels:
Support:
0.8450 – Former resistance, now acting as immediate support.
0.8425 – Secondary support in case of a deeper pullback.
0.8400 – Major support and psychological round number.
Resistance:
0.8540 – Initial upside target.
0.8560 – Intermediate resistance.
0.8575 – Long-term resistance level.
A corrective pullback toward the 0.8450 support followed by a bullish rebound could reinforce the current trend and open the path toward 0.8540 and higher. However, a daily close below 0.8450 would invalidate the bullish scenario and signal further downside toward 0.8425 and potentially 0.8400.
Conclusion:
The near-term outlook for EUR/GBP remains bullish as long as the pair holds above 0.8450. A successful retest of this level would confirm breakout strength and support continuation toward 0.8540–0.8575. Conversely, a break below 0.8450 would shift the bias to neutral to bearish, suggesting further downside correction.
This communication is for informational purposes only and should not be viewed as any form of recommendation as to a particular course of action or as investment advice. It is not intended as an offer or solicitation for the purchase or sale of any financial instrument or as an official confirmation of any transaction. Opinions, estimates and assumptions expressed herein are made as of the date of this communication and are subject to change without notice. This communication has been prepared based upon information, including market prices, data and other information, believed to be reliable; however, Trade Nation does not warrant its completeness or accuracy. All market prices and market data contained in or attached to this communication are indicative and subject to change without notice.

Inverse H&S Breakout! EURGBP Eyes Resistance Zone Amid Eurozone EURGBP ( OANDA:EURGBP ) is moving between two Support zone(0.83870 GBP-0.83500 GBP) and Resistance zone(0.8511 GBP-0.8470 GBP) .
In terms of Classic Technical Analysis , EURGBP has managed to break the Neckline of the Inverse Head and Shoulders Pattern .
I expect EURGBP to rise to at least 0.84911 GBP and attack the Resistance zone(0.8511 GBP- 0.8470 GBP) .
-----------------------------------------------------------
EURGBP Fundamental Analysis:
1. Eurozone (EUR) Overview :
The Eurozone economy has shown moderate recovery signs after pandemic disruptions.
Inflation remains a concern, but the European Central Bank (ECB) is expected to maintain or even tighten monetary policy gradually to combat inflation.
Economic data such as GDP growth and industrial production are mixed but generally indicate slow growth.
Political stability in the Eurozone is relatively steady compared to the UK.
The ECB’s forward guidance leans towards cautious optimism, supporting EUR strength over time.
2. United Kingdom (GBP) Overview :
The UK economy faces several challenges, including slower growth prospects compared to the Eurozone.
Inflation has been high but the Bank of England (BoE) has been raising interest rates aggressively to control it.
Political uncertainties related to Brexit aftermath, trade deals, and fiscal policies have created some volatility.
Consumer confidence and retail sales have shown signs of weakness in recent months.
Overall, the BoE’s hawkish stance is strong, but economic fundamentals are less robust compared to the Eurozone.
3. Comparative Factors Favoring EUR Long :
The Eurozone's relatively better economic stability and growth prospects support EUR strength.
UK economic challenges and political uncertainties weaken GBP.
ECB’s more gradual tightening approach may prevent shocks, making EUR attractive.
Brexit-related trade issues continue to pose risks for GBP.
4. Risks to Consider :
Unexpected ECB dovish moves could weaken EUR.
Positive UK economic surprises or faster-than-expected BoE tightening might strengthen GBP.
External shocks like geopolitical tensions can affect risk sentiment, impacting both currencies.
-----------------------------------------------------------
Note: Stop Loss(SL)= 0.84221 GBP
Euro/British Pound Analyze (EURGBP), 4-hour time frame.
Be sure to follow the updated ideas.
Do not forget to put a Stop loss for your positions (For every position you want to open).
Please follow your strategy; this is just my idea, and I will gladly see your ideas in this post.
Please do not forget the ✅' like '✅ button 🙏😊 & Share it with your friends; thanks, and Trade safe.

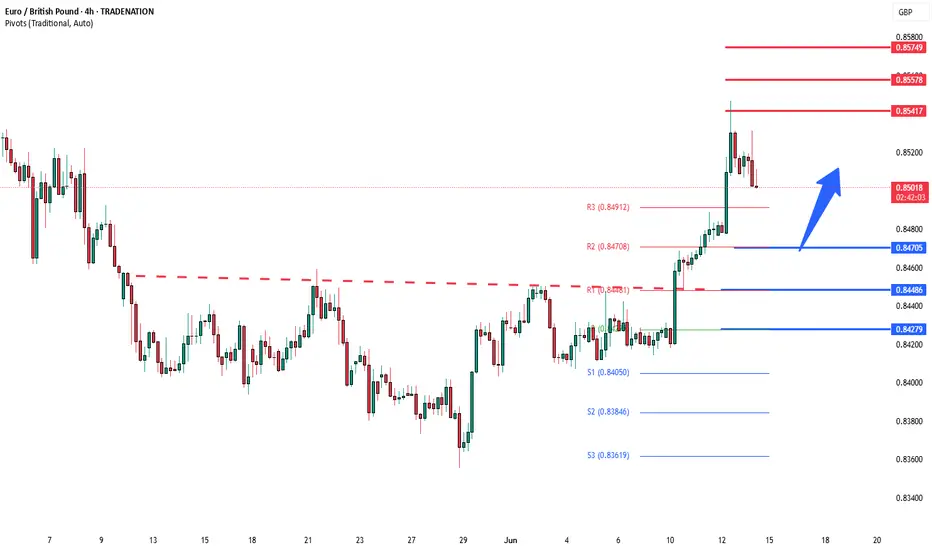
Bullish rise?EUR/GBP has reacted off the pivot and could rise to the 1st resistance.
Pivot: 0.8451
1st Support: 0.8402
1st Resistance: 0.8539
Risk Warning:
Trading Forex and CFDs carries a high level of risk to your capital and you should only trade with money you can afford to lose. Trading Forex and CFDs may not be suitable for all investors, so please ensure that you fully understand the risks involved and seek independent advice if necessary.
Disclaimer:
The above opinions given constitute general market commentary, and do not constitute the opinion or advice of IC Markets or any form of personal or investment advice.
Any opinions, news, research, analyses, prices, other information, or links to third-party sites contained on this website are provided on an "as-is" basis, are intended only to be informative, is not an advice nor a recommendation, nor research, or a record of our trading prices, or an offer of, or solicitation for a transaction in any financial instrument and thus should not be treated as such. The information provided does not involve any specific investment objectives, financial situation and needs of any specific person who may receive it. Please be aware, that past performance is not a reliable indicator of future performance and/or results. Past Performance or Forward-looking scenarios based upon the reasonable beliefs of the third-party provider are not a guarantee of future performance. Actual results may differ materially from those anticipated in forward-looking or past performance statements. IC Markets makes no representation or warranty and assumes no liability as to the accuracy or completeness of the information provided, nor any loss arising from any investment based on a recommendation, forecast or any information supplied by any third-party.

EURGBP Potential Bullish Reversal OpportunityEURGBP price action seems to exhibit signs of a potential Bullish Reversal on the shorter timeframes if the price action forms (and sustains) a credible Higher High with multiple confluences from key Fibonacci and Support levels.
Trade Plan :
Entry @ 0.8459
Stop Loss @ 0.8375
TP 0.9 - 1 @ 0.8534 - 0.8540

EURGBP: Bearish Continuation & Short Signal
EURGBP
- Classic bearish formation
- Our team expects fall
SUGGESTED TRADE:
Swing Trade
Sell EURGBP
Entry Level - 0.8455
Sl - 0.8471
Tp - 0.8425
Our Risk - 1%
Start protection of your profits from lower levels
Disclosure: I am part of Trade Nation's Influencer program and receive a monthly fee for using their TradingView charts in my analysis.
❤️ Please, support our work with like & comment! ❤️
