Bulls Could "Wedge" Their Way Into Higher Prices On EGOANDA:EURGBP has made some impressive moves up since the Low from May 29th and Price just fell short of the Highs of April 11th before falling into a very familiar Bullish Pattern, the Falling Wedge!
The Falling Wedge is typically a Bullish Pattern where we expect Price to give us a Bullish Break of the Falling Resistance and Successful Retest of the Break before Price heads Higher!
Wedge Patterns can play both Reversal and Continuation Patterns dependent upon the location they form and surrounding Major Support/Resistance or Highs/Lows. In this case, we will be looking for a Continuation with Price being in an Uptrend before pausing slightly for a Consolidation Phase to form the "Triangle" of the Pattern.
*It is important to note that both the Falling Resistance and Falling Support have only been tested twice where three tests of both Trendlines should point to a strong equilibrium from both Bears and Bulls, validating the legs of the Triangle and strengthening the Consolidation Bias. ( So we could see Price test the Falling Resistance one last time before falling down to the Falling Support for a 3rd test! )
Lastly, when it comes to a Wedge Pattern, we should suspect that once Price makes a 3rd Test of the Falling Support and Retraces to the 50% Fibonacci Level @ .85887, this will signal the End of the Consolidation Phase!
- And this will be the time to enter!
**Once the Pattern is Confirmed and Breakout is Validated, based on the "Flagpole" or Rally prior to Price falling into the Consolidation Phase we can anticipate Price to potentially rise to the most recent High on April 11th of .87374 and give the next Previous High on November 16th 2023 of .87657 a try!
Fundamentally, news is light this week for both currencies in the pair with GDP m/m releasing for GBP on Friday, July 11th with a Forecast of .1%, a .4% increase from June's -.3%
Also, CPI y/y for GBP will be released the following week on Wednesday, July 16th.
EURGBP

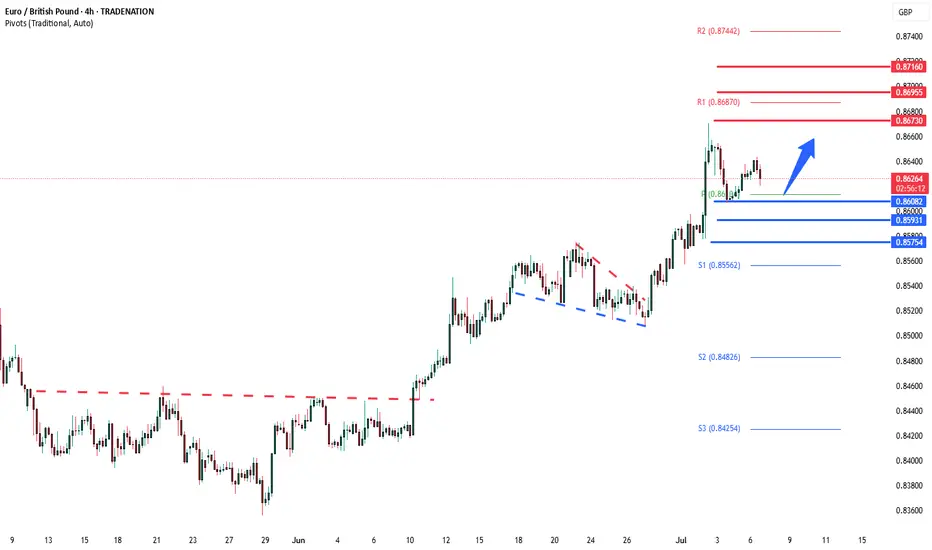
EURGBP uptrend support retest at 0.8600The EURGBP remains in a bullish trend, with recent price action showing signs of a corrective pullback within the broader uptrend.
Support Zone: 0.8600 – a key level from previous consolidation. Price is currently testing or approaching this level.
A bullish rebound from 0.8600 would confirm ongoing upside momentum, with potential targets at:
0.8670 – initial resistance
0.8700 – psychological and structural level
0.8720 – extended resistance on the longer-term chart
Bearish Scenario:
A confirmed break and daily close below 0.8600 would weaken the bullish outlook and suggest deeper downside risk toward:
0.8590 – minor support
0.8570 – stronger support and potential demand zone
Outlook:
Bullish bias remains intact while the EURGBP holds above 0.8600. A sustained break below this level could shift momentum to the downside in the short term.
This communication is for informational purposes only and should not be viewed as any form of recommendation as to a particular course of action or as investment advice. It is not intended as an offer or solicitation for the purchase or sale of any financial instrument or as an official confirmation of any transaction. Opinions, estimates and assumptions expressed herein are made as of the date of this communication and are subject to change without notice. This communication has been prepared based upon information, including market prices, data and other information, believed to be reliable; however, Trade Nation does not warrant its completeness or accuracy. All market prices and market data contained in or attached to this communication are indicative and subject to change without notice.
Market Analysis: EUR/GBP Accelerates HigherMarket Analysis: EUR/GBP Accelerates Higher
EUR/GBP is rising and might climb above the 0.8670 resistance.
Important Takeaways for EUR/GBP Analysis Today
- EUR/GBP is gaining pace and trading above the 0.8600 zone.
- There was a break above a contracting triangle with resistance at 0.8630 on the hourly chart at FXOpen.
EUR/GBP Technical Analysis
On the hourly chart of EUR/GBP at FXOpen, the pair started a decent increase from the 0.8500 zone. The Euro traded above the 0.8580 resistance level to enter a positive zone against the British Pound.
The pair settled above the 50-hour simple moving average and 0.8620. It traded as high as 0.8670 before a downside correction. There was a move below the 23.6% Fib retracement level of the upward move from the 0.8507 swing low to the 0.8670 high.
However, the pair is stable above the 0.8600 support zone. The next major support is near the 50% Fib retracement level of the upward move from the 0.8507 swing low to the 0.8670 high at 0.8590.
A downside break below 0.8590 might call for more downsides. In the stated case, the pair could drop toward the 0.8545 support level. Any more losses might call for an extended drop toward the 0.8505 pivot zone.
The EUR/GBP chart suggests that the pair is facing resistance near the 0.8635 zone. A close above the 0.8635 level might accelerate gains. In the stated case, the bulls may perhaps aim for a test of 0.8670. Any more gains might send the pair toward the 0.8700 level.
This article represents the opinion of the Companies operating under the FXOpen brand only. It is not to be construed as an offer, solicitation, or recommendation with respect to products and services provided by the Companies operating under the FXOpen brand, nor is it to be considered financial advice.

EURGBP LONG Market still in strong bullish momentum and a third touch on bullish trendline. Price printed a strong bullish confirmation. Expecting price to reach at least 0.86699 resistance level.

EUR-GBP Will Grow! Buy!
Hello,Traders!
EUR-GBP keeps trading in
A strong uptrend and the
Pair made a retest and a
Rebound from the horizontal
Support level around 0.8621
So we are bullish biased and
We will be expecting a
Further bullish move up
Buy!
Comment and subscribe to help us grow!
Check out other forecasts below too!
Disclosure: I am part of Trade Nation's Influencer program and receive a monthly fee for using their TradingView charts in my analysis.

EUR/GBP BEST PLACE TO SELL FROM|SHORT
Hello, Friends!
The BB upper band is nearby so EUR-GBP is in the overbought territory. Thus, despite the uptrend on the 1W timeframe I think that we will see a bearish reaction from the resistance line above and a move down towards the target at around 0.856.
Disclosure: I am part of Trade Nation's Influencer program and receive a monthly fee for using their TradingView charts in my analysis.
✅LIKE AND COMMENT MY IDEAS✅

EURGBP 8H Analysis : Breakdown + Smart Money Structure + Target🧠 Phase 1: Arc Formation – Accumulation by Smart Money
The arc (May to June) reflects an accumulation base where price made higher lows with consolidative wicks and slow momentum, ideal conditions for institutional orders to build long positions.
Liquidity is swept below swing lows, stopping out early longs — this is classic smart money accumulation.
Volume compression during the arc followed by expansion on breakout confirms smart interest.
🔑 Psychology: Retail was likely selling here due to lower highs, while smart money was accumulating quietly at the bottom of the arc.
🚀 Phase 2: Breakout & Rally to Previous Highs
Price cleanly breaks above the arc’s neckline and previous resistance (labeled as Previous Target).
Momentum accelerates rapidly toward the reversal zone, likely due to stop hunts and FOMO buyers entering after confirmation.
Structure shifts bullish, creating strong impulsive candles — but these are often final exit points for smart money.
📌 Key Sign: Breakout aligns perfectly with market inefficiencies being filled, often a sign of a short-term top formation brewing.
🔄 Phase 3 : Reversal Zone – Distribution Phase
Inside the Reversal Zone (0.8650–0.8680), price shows exhaustion with multiple upper wicks and slowing bullish momentum.
Distribution signs: choppy movement, lower highs, and eventual breakdown.
Retail is often caught entering longs here on confirmation, while institutions offload their positions.
🧠 MMC Insight: This is where Mind Market Curve transitions from bullish impulse to corrective leg down — phase of deception.
📉 Phase 4: Structure Breakdown & Bearish Market Behavior
Price breaks through short-term higher low structure — confirmation of bearish intent.
The formation of lower highs and lower lows marks the beginning of a bearish trend shift.
Market is now targeting Major Support (0.8500–0.8520 zone), which is currently being tested.
🧭 If price breaks below 0.8500 with volume and aggression, next level is likely near 0.8430–0.8450.
⚖️ Current Price Location: Major Support Test
We’re at a critical decision point.
If support holds → expect a bounce to 0.8600–0.8620.
If it breaks → expect continuation to next liquidity pool below 0.8450.
This zone is where buyers and sellers will battle. Wait for:
Bullish confirmation (reversal pattern / engulfing candle) to go long.
Bearish breakout (close below zone + retest) to go short.
🔁 Summary of Scenarios
Scenario Conditions Target
✅ Bullish Bounce Rejection at support with bullish engulfing/pin bar 0.8600–0.8620
❌ Bearish Break Close below 0.8500 + retest as resistance 0.8430–0.8450
🔖 Educational Takeaway
This chart teaches how to:
Identify accumulation via arc and understand smart money behavior.
Recognize false confirmation zones (where retail enters late).
Understand structure shift as a trend reversal signal.
Execute trades based on reaction zones, not emotions.
If you follow MMC (Mind Market Curve), this is a textbook transition from:
Accumulation →
Expansion →
Distribution →
Breakdown

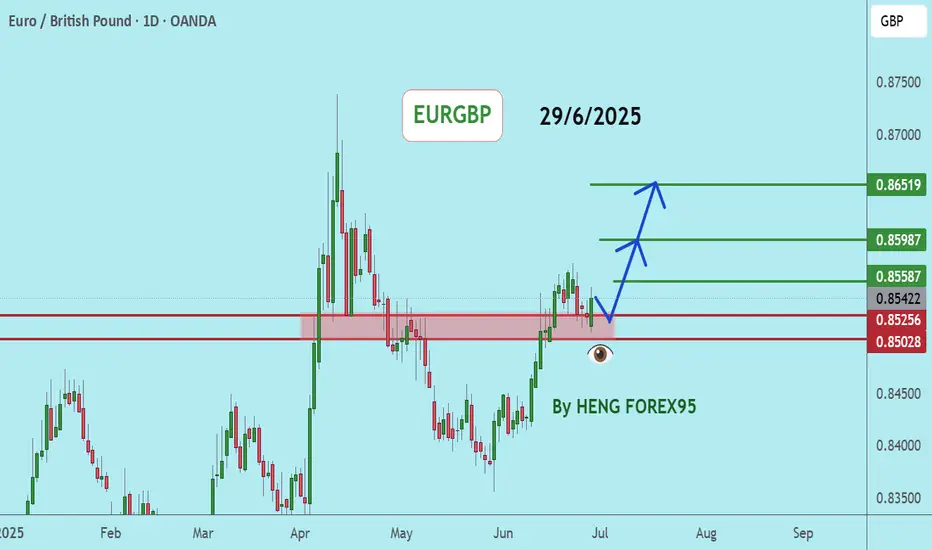
EURGBP - Expecting Bullish Continuation In The Short TermH4 - We have a clean bullish trend with the price creating a series of higher highs, higher lows structure.
This strong bullish momentum is followed by a pullback.
No opposite signs.
Until the two Fibonacci support zones hold I expect the price to move higher further.
If you enjoy this idea, don’t forget to LIKE 👍, FOLLOW ✅, SHARE 🙌, and COMMENT ✍! Drop your thoughts and charts below to keep the discussion going. Your support helps keep this content free and reach more people! 🚀
--------------------------------------------------------------------------------------------------------------------

EURGBP corrective pullback support at 0.8600The EURGBP remains in a bullish trend, with recent price action showing signs of a corrective pullback within the broader uptrend.
Support Zone: 0.8600 – a key level from previous consolidation. Price is currently testing or approaching this level.
A bullish rebound from 0.8600 would confirm ongoing upside momentum, with potential targets at:
0.8670 – initial resistance
0.8700 – psychological and structural level
0.8720 – extended resistance on the longer-term chart
Bearish Scenario:
A confirmed break and daily close below 0.8600 would weaken the bullish outlook and suggest deeper downside risk toward:
0.8590 – minor support
0.8570 – stronger support and potential demand zone
Outlook:
Bullish bias remains intact while the EURGBP holds above 0.8600. A sustained break below this level could shift momentum to the downside in the short term.
This communication is for informational purposes only and should not be viewed as any form of recommendation as to a particular course of action or as investment advice. It is not intended as an offer or solicitation for the purchase or sale of any financial instrument or as an official confirmation of any transaction. Opinions, estimates and assumptions expressed herein are made as of the date of this communication and are subject to change without notice. This communication has been prepared based upon information, including market prices, data and other information, believed to be reliable; however, Trade Nation does not warrant its completeness or accuracy. All market prices and market data contained in or attached to this communication are indicative and subject to change without notice.

EURGBPEURGBP If the price can stay above 0.85028, it is likely to increase.
Consider buying the red zone.
🔥Trading futures, forex, CFDs and stocks carries a risk of loss.
Please consider carefully whether such trading is suitable for you.
>>GooD Luck 😊
❤️ Like and subscribe to never miss a new idea!
EUR_GBP BULLISH BIAS|LONG|
✅EUR_GBP broke the key
Structure level of 0.8620
While trading in an local uptrend
Which makes me bullish
And I think that after the retest
Of the broken level is complete
A rebound and bullish continuation will follow
LONG🚀
✅Like and subscribe to never miss a new idea!✅
Disclosure: I am part of Trade Nation's Influencer program and receive a monthly fee for using their TradingView charts in my analysis.

EURGBP Growth Ahead!
HI,Traders !
#EURGBP is trading along the
Rising support and is already
Making a bullish rebound so
AsTo the strong uptrend we
Will be expecting a further
Bullish move up on pair !
Comment and subscribe to help us grow !

EURGBP: Weak Market & Bearish Forecast
Our strategy, polished by years of trial and error has helped us identify what seems to be a great trading opportunity and we are here to share it with you as the time is ripe for us to sell EURGBP.
Disclosure: I am part of Trade Nation's Influencer program and receive a monthly fee for using their TradingView charts in my analysis.
❤️ Please, support our work with like & comment! ❤️

EURGBP sell, July 01HTF shows strong bullish trend, with price barely missing the Daily imbalance — signaling strong buyer momentum and no clear reversal point nearby.
On LTF, we had a clean 15m BOS, confirming bullish continuation, and price reacted from a 15m POI with imbalance left behind.
First entry missed by 1 pip, but it’s still in play — second entry aligns with the same narrative.
📍Entry: 15m imbalance
🧠 BOS in our favor, valid setup if triggered before London close
🎯 TP: Asia high for 1:3 RR
📉 Risk: 0.5% on each position
Looking to continue the upside trend, staying patient and letting price come to us.

EURGBP Watching the FVG for a Possible Push HigherEURGBP has been showing a clean bullish structure on the 1 hour chart. We got a solid break of structure that left behind an imbalance and price is now pulling back.
There’s a fair value gap just above the previous day’s low and also some local liquidity resting below the last minor low. If price dips into that FVG, fills the imbalance and takes out a bit more liquidity, it could set up the next move up.
I’ll be watching how price reacts in that zone. A strong rejection could signal buyers stepping back in to target the highs and sweep the liquidity sitting above.
No need to rush. Let the market come into the level and prove itself first.

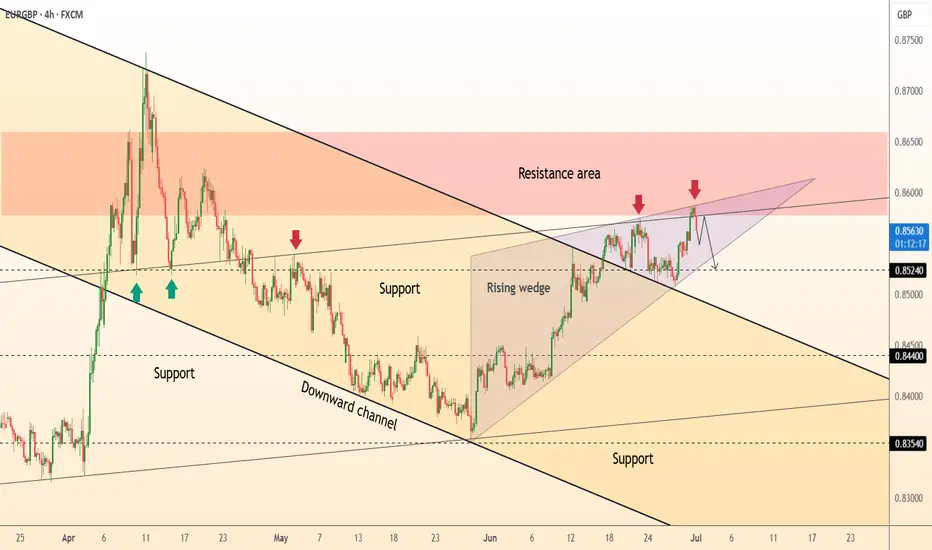
DeGRAM | EURGBP correction from the resistance area📊 Technical Analysis
● Price failed twice at 0.8580-0.8600 supply, completing a rising-wedge inside the larger downward channel; bearish divergence accompanies the second rejection.
● A clean drop back under the former breakout line (≈0.8560) turns it into fresh resistance; wedge depth and channel mid-line converge at 0.8525, with the April floor 0.8440 as next objective.
💡 Fundamental Analysis
● French election risk premium is pressuring the euro, while stronger-than-expected UK GDP proxy (ONS monthly estimate) narrows growth gap and supports sterling.
✨ Summary
Sell 0.8560-0.8570; hold below 0.8560 targets 0.8525 → 0.8440. Short view invalidated on an H4 close above 0.8600.
-------------------
Share your opinion in the comments and support the idea with like. Thanks for your support!
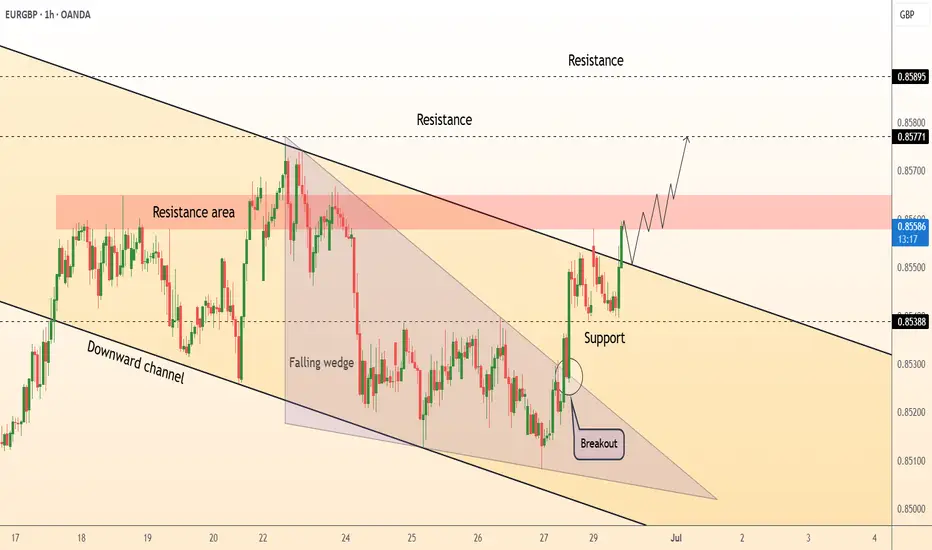
DeGRAM | EURGBP broke the channel📊 Technical Analysis
● Price broke out of a six-day falling wedge and reclaimed the channel’s upper wall at 0.8538, flipping it into support and signalling trend reversal.
● A fresh sequence of higher-lows is guiding bids toward the 0.8558-0.8565 supply; a close above that zone exposes the next resistance cluster at 0.8577 → 0.8590 (wedge 1:1 objective).
💡 Fundamental Analysis
● Softer UK GDP revisions and firmer Euro-area CPI flash (still at 2.6 % y/y) narrow rate-differential expectations, underpinning EUR vs GBP.
✨ Summary
Long 0.8538-0.8550; targets 0.8577 then 0.8590. Bull view void on an H1 close below 0.8530.
-------------------
Share your opinion in the comments and support the idea with like. Thanks for your support!
EURGBP: Will Start Falling! Here is Why:
It is essential that we apply multitimeframe technical analysis and there is no better example of why that is the case than the current EURGBP chart which, if analyzed properly, clearly points in the downward direction.
Disclosure: I am part of Trade Nation's Influencer program and receive a monthly fee for using their TradingView charts in my analysis.
❤️ Please, support our work with like & comment! ❤️
EURGBP Bullish continuation supported at 0.8510Trend Overview:
EURGBP remains in a bullish trend, characterised by higher highs and higher lows. The recent intraday price action is forming a continuation consolidation pattern, suggesting a potential pause before a renewed move higher.
Key Technical Levels:
Support: 0.8510 (primary pivot), followed by 0.8490 and 0.8470
Resistance: 0.8570 (initial), then 0.8590 and 0.8620
Technical Outlook:
A pullback to the 0.8510 level, which aligns with the previous consolidation zone, could act as a platform for renewed buying interest. A confirmed bounce from this support may trigger a continuation toward the next resistance levels at 0.8570, 0.8590, and ultimately 0.8620.
Conversely, a daily close below 0.8510 would suggest weakening bullish momentum. This scenario would shift the bias to bearish in the short term, potentially targeting 0.8490 and 0.8470 as downside levels.
Conclusion:
EURGBP maintains a bullish structure while trading above the 0.8510 support. A bounce from this level would validate the consolidation as a continuation pattern, with upside potential toward the 08570 area. A breakdown below 0.8510, however, would invalidate this view and suggest deeper corrective risk.
This communication is for informational purposes only and should not be viewed as any form of recommendation as to a particular course of action or as investment advice. It is not intended as an offer or solicitation for the purchase or sale of any financial instrument or as an official confirmation of any transaction. Opinions, estimates and assumptions expressed herein are made as of the date of this communication and are subject to change without notice. This communication has been prepared based upon information, including market prices, data and other information, believed to be reliable; however, Trade Nation does not warrant its completeness or accuracy. All market prices and market data contained in or attached to this communication are indicative and subject to change without notice.

EURGBP DAILY FORECAST Q3 D30 W27 Y25EURGBP DAILY FORECAST Q3 D30 W27 Y25
Professional Risk Managers👋
Welcome back to another FRGNT chart update📈
Diving into some Forex setups using predominantly higher time frame order blocks alongside confirmation breaks of structure.
Let’s see what price action is telling us today! 👀
💡Here are some trade confluences📝
✅Daily Order block identified
✅4H Order Block identified
✅1H Order Block identified
🔑 Remember, to participate in trading comes always with a degree of risk, therefore as professional risk managers it remains vital that we stick to our risk management plan as well as our trading strategies.
📈The rest, we leave to the balance of probabilities.
💡Fail to plan. Plan to fail.
🏆It has always been that simple.
❤️Good luck with your trading journey, I shall see you at the very top.
🎯Trade consistent, FRGNT X

EURGBP WEEKLY HIGHER TIME FRAME FORECAST Q3 W27 Y25EURGBP WEEKLY HIGHER TIME FRAME FORECAST Q3 W27 Y25
Professional Risk Managers👋
Welcome back to another FRGNT chart update📈
Diving into some Forex setups using predominantly higher time frame order blocks alongside confirmation breaks of structure.
Let’s see what price action is telling us today! 👀
💡Here are some trade confluences📝
✅Weekly 50EMA Rejection
✅Daily Order block identified
✅4H Order Block identified
🔑 Remember, to participate in trading comes always with a degree of risk, therefore as professional risk managers it remains vital that we stick to our risk management plan as well as our trading strategies.
📈The rest, we leave to the balance of probabilities.
💡Fail to plan. Plan to fail.
🏆It has always been that simple.
❤️Good luck with your trading journey, I shall see you at the very top.
🎯Trade consistent, FRGNT X

EURGBP Will Go Higher! Long!
Here is our detailed technical review for EURGBP.
Time Frame: 9h
Current Trend: Bullish
Sentiment: Oversold (based on 7-period RSI)
Forecast: Bullish
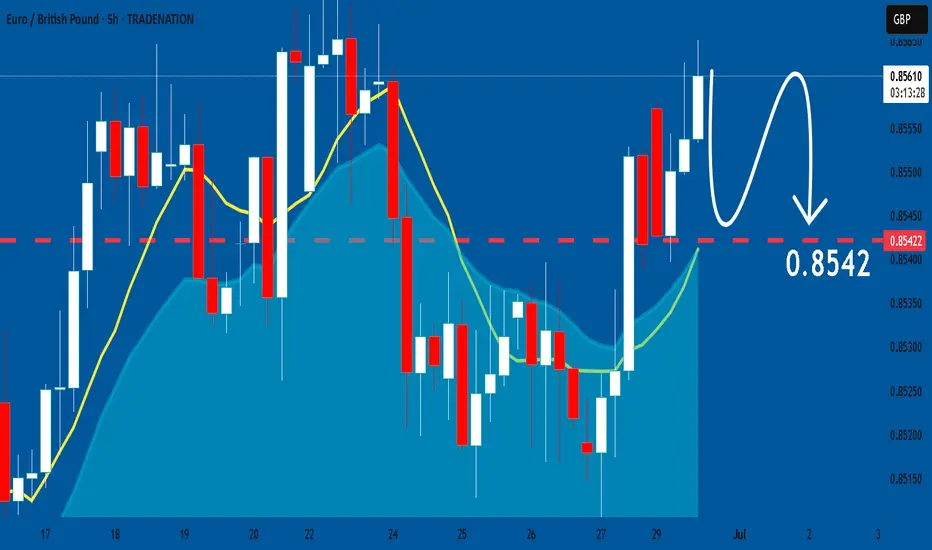
The market is approaching a significant support area 0.852.
The underlined horizontal cluster clearly indicates a highly probable bullish movement with target 0.856 level.
P.S
The term oversold refers to a condition where an asset has traded lower in price and has the potential for a price bounce.
Overbought refers to market scenarios where the instrument is traded considerably higher than its fair value. Overvaluation is caused by market sentiments when there is positive news.
Disclosure: I am part of Trade Nation's Influencer program and receive a monthly fee for using their TradingView charts in my analysis.
Like and subscribe and comment my ideas if you enjoy them!

Bearish drop?EUR/GBP is rising towards the pivot that aligns with the 38.2% Fibonacci retracement and could drop to the 1st support.
Pivot: 0.8530
1st Support: 0.8482
1st Resistance: 0.8569
Risk Warning:
Trading Forex and CFDs carries a high level of risk to your capital and you should only trade with money you can afford to lose. Trading Forex and CFDs may not be suitable for all investors, so please ensure that you fully understand the risks involved and seek independent advice if necessary.
Disclaimer:
The above opinions given constitute general market commentary, and do not constitute the opinion or advice of IC Markets or any form of personal or investment advice.
Any opinions, news, research, analyses, prices, other information, or links to third-party sites contained on this website are provided on an "as-is" basis, are intended only to be informative, is not an advice nor a recommendation, nor research, or a record of our trading prices, or an offer of, or solicitation for a transaction in any financial instrument and thus should not be treated as such. The information provided does not involve any specific investment objectives, financial situation and needs of any specific person who may receive it. Please be aware, that past performance is not a reliable indicator of future performance and/or results. Past Performance or Forward-looking scenarios based upon the reasonable beliefs of the third-party provider are not a guarantee of future performance. Actual results may differ materially from those anticipated in forward-looking or past performance statements. IC Markets makes no representation or warranty and assumes no liability as to the accuracy or completeness of the information provided, nor any loss arising from any investment based on a recommendation, forecast or any information supplied by any third-party.
