EURGBP - LongAfter the impulsive first wave witnessed on the pair, where we had an extended first leg, the EUR/GBP is now correcting. The next levels to watch are the 38.2% and 50.0% retracement from the highs, which come in at 0.8404 and 0.8382. Those are good entry levels for the third wave, which could take prices higher towards 0.8600.
Eurgbplong

EURGBP BUYSEURGBP buying for a short term then we look for shorts to pick up the lows and grab liquidity

EUR/GBP BUY NOW...
Hello Traders, here is the full analysis for this pair,
let me know in the comment section below if you have any questions,
the entry will be taken only if all rules of the strategies will be
satisfied. I suggest you keep this pair on your watch list and see if
the rules of your strategy are satisfied.
Dear Traders,
If you like this idea, do not forget to support with a like and follow.
PLZ! LIKE COMMAND AND SUBSCRIBE

EUR/GBPA buy setup for this pair. We should be careful with this pair because we can se the wick it made and then a very large upside , so we should be careful with stop loss.

EURGBP trend continuation ideasPrice is in a downtrend but don't be fooled, many retail orders are stacked up the top ready to be purged. Expect price to reverse in one of the two zones, I vouch for the lower one as institutions have open shorts there and need to be closed first before going up. Trend reversal confirmations needed within the indicated zones before entry. GL

EURGBP LongHey traders, in this week we are monitoring EURGBP for a long term buying opportunity around 0.84 zone, once we will receive any bullish confirmation the trade will be executed.
Trade safe, Joe.

EURGBP SHORTS 📉📉📉📉 Expecting bearish price action on this pair as price takes out weekly highs liquidity + d1 imbalance and rejected it with bearish candlestick closure, on the LTF(lowertimeframe) we can clearly see that price is making a bearish market strucutre with lower lows and higher lows bulls lost the momentum and bears are getting it, we have also a lot of inefficient price action aka PRICE IMBALANCES and we should go lower to fill those areas.
What do you think ? Comment below..

EURGBP Chart H1Here is my view for EURGBP on H1. The price should go up, you can put a pending order on the Order block or find an entry on LTF within OB Zone. Trade Safe!

EURGBP LONGEURGBP has retested the previous strong resistance level on the H4 and Daily time frame. We expecting the pair to retest key levels listed on the graph
We taking this trade based on technical analysis and price action.
(1) DO NOT ENTER ANY TRADE BEFORE THE ENTRY LEVEL
(2) USE YOUR STOP LOSS
(3) DO NOT HOLD A LOSS FOR MORE THAN 2 DAYS
Please use proper risk management depending on your account size, Use lot sizes based on these calculations.
Here is a break down of your pip value in ZAR and Dollars
0, 01 = R1,43 / $0,10c
0. 05 = R 7,15 / $ 0.50
0.10 = R 14,3 / $1.00
1 Lot size = R 146,26
How to calculate Margin = (Lot Size * Contract Size)/Leverage, Lets say your broker gives you 1:500, and you open 0,2 size, How much are you exposing ? calculations : (0.2 * 10 000) / 500 = $4 (R58) also (1 Lot * 100 000) / 500 = $200 (R2 960)
So, each time I open (1 Lot size, am exposing R2960 (Down payment)
Remember, These are long term trades, It is advisable to have enough margin to handle the fluctuation of the markets.
Please like and share for more useful content:

EURGBP Long Analysis Hey traders, here is the analysis for the EURGBP. Let me know if you guys have any questions in the comment section. If you guys like my analysis please hit like. Thanks. NOTE - Please do your own analysis before taking the trade.

EURGBP, the never ending storyWhen it seems to arrive to the point, it sh*ts oneself from fear.
Seriously, we are always in full B2 of the annual and we are moving towards the quarterly B1, after which the cyclical trend will turn downwards and we will have to evaluate an optimal closing of the positions.
For now we are in profit with both positions, I do not rule out a retest of the MML at 0.8380, but given the intense accumulation phase, the most logical move now would be to go and distribute the price above 0.8550, perhaps looking for the highs again. of the period to about 0.858.
So, we are waiting for the next movements, but we are starting to set a deadline: 1st March '22

Key level broken and buying opportunity with EURGBPH4 time frame.
Structure: The downtrend ended when Key level was broken at 0.84200.
Wait for the retest and the bullish confirmation signal to look for buying opportunities.
Profit target is 0.86000 price zone.
-----------------------------------------------------------------------------------------------
Wish you all have a good trading day!

Eurgbp daily time frame time reversal Eurgbp daily time frame time-reversal we expect bullish now for some days we need to wait for break in H4 LH then we enter long

EURGBP SHORTS 📉📉📉📉 Expecting bearish price action on EG as price takes out buy side liquidity aka retail resistance, the move was very inefficient i call this a bubble move and price should retrace lower to fill those imbalances 0.83688 and 0.83507.
There is also a possibility that price will take out weekly highs and fill d1 imbalance before moving to the downside and this is why i moved my stop way higher.
What do you think ? Comment below..

EURGBPThere were 5 correction waves in the flag and i think it's over, so i expect it start new wave and goes to top of the channel. It's long-term trend.

OPPORTUNITY FOR BUY EURGBPWe have these indicators for BUY opportunity:
- Support from Monthly low level
- Low volume for to continue the current direction
- Reflection from the bottom of the parallel channel
We define 3 goals:
TP 1 = 40 pips
TP 2 = 100 pips
TP 3 = 200 pips
SL = 0.81689

EURGBP potentially bullish | Feb 2, 2022Since 2021, EURGBP has been going up and down inside a descending channel. It has constantly created lower highs and lower lows, indicating bear is still in play.
On Jan 31, 2022, it reached the bottom of trendline where a demand zone is waiting. Then it formed a strong bullish candle in daily and 8H time frame, indicating the price has rejected the support and grab the buy order in the demand zone. Potentially, it will go upward before continuing the bearish trend.
We enter a long position on Jan 31, 2022 at 22:00 UTC. Buying price is at 0.83480, stop loss is at 50 pips, or just below the invalidation / latest swing low. Risk to Reward ratio is very good, 1:3.5.

EurGbp- Bullish Engulfing to mark reversalIn my previous EurGbp analysis I said that 0.83 should be strong support for the pair and, after a very short dip under this level, EurGbp has reversed strongly, leaving a large Bullish Engulfing on our daily chart.
This very well can be the start of a medium-term uptrend for the pair and 0.87 can be bulls target.
Dips under 0.84 should be bought and only EurGbp under yesterday's low would negate this scenario
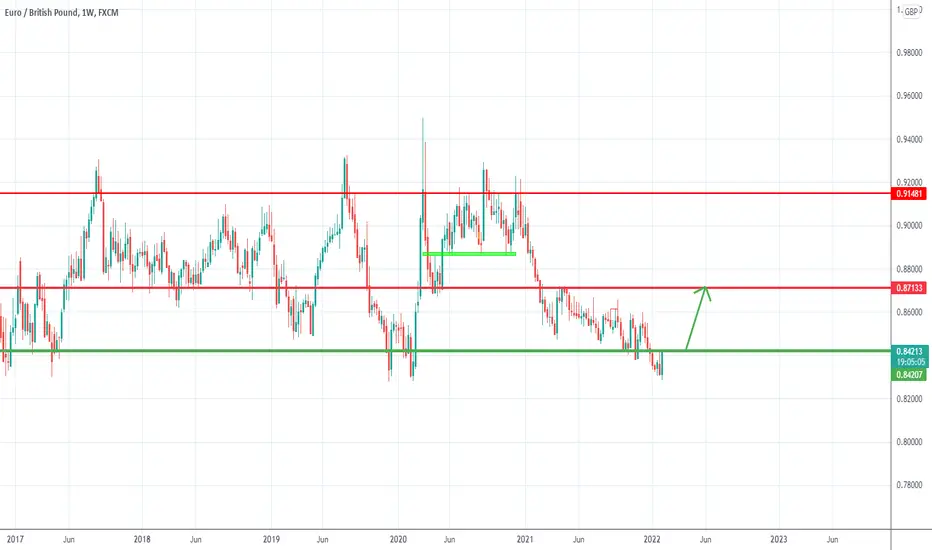
EURGBP LONG EURGBP forming a great channel and bouncing back from the important support zone.
Great time to go long in this pair with a R:R of approx. 1:6.5+.
For more simple analysis and setups, please follow me.
And for any queries feel free to comment below this or DM.
Trade safe. Manage risk. Be profitable.
Disclaimer :- This is just my view. Please analyze charts yourself and then decide to take any trades.


EURGBP - Update - 2The price on another uptrend is moving towards higher targets ... probably
This is my personal opinion. Please do not trade based on this analysis and data

EURGBP BUY ANALYSISPrice has broken out of the trendline
Price has created a Low and High
Price has retest the order block creating a HL

EURGBP uptrend in early 2022?After one-year siding way in a down channel, EURGBP has the signal for a reverse wave in early 2022.
If EURGBP truly changes to the uptrend, I think this up wave will reach the target during 2 - 3 months.
