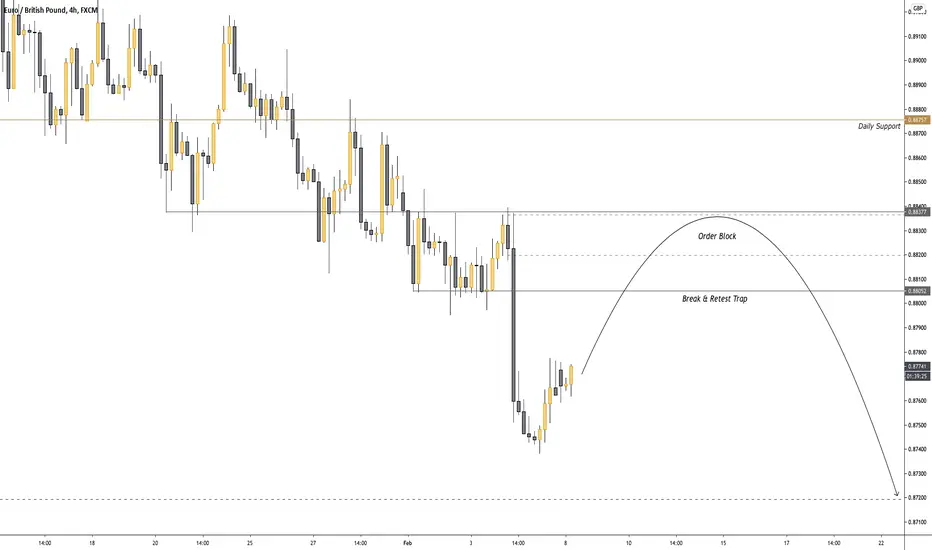
EURGBP - Bearish TrapsThere is no denying that this pair is creating stepping down structure, however, It is likely that selling traps will be in place.
I assume many would be selling from the break and re-test of the most recent structure, I will be waiting to get involved in sells from the order block just above it.
Eurgbplong
EURGBP - CURRENTLY IN DISCOUNT PRICETechnical Overview: - EUR/GBP
We had seen the bearish run down raiding the support level at 0.88500
many buyers and sellers were interested in this very special level.
Due to the fact that the market likes to move where there is liquidity, it is no surprise that we raid this very key lows.
Many of us are taught to buy where price is mostly rejecting, and that's exactly what the big banks want you to believe.
We were anticipating this raid to the downside clearing all buyers and sellers before we can look for buy opportunities.
It is very crucial to point out that we are in discount pricing meaning price is oversold, thus giving us a chance to look for buy potential.
We do anticipate price to come down lower from a smaller time frame, however higher time frame we are using this as a chance to buy these deals!
Remember this is our free analysis!
To learn more find out below.
Analysis is only 1 piece of the puzzle 🧩
Our analysis is a sentiment for the upcoming week, month.
Use this as a weather forecast, you are the person that has to put on a jacket when it’s raining.
Trade this sentiment based off your own entry strategy at the right time.
Flow with the Devil 😈
Trade with the manipulation👾


EUR/GBP LONGEUR/GBP has been respecting the descending channel drawn by the green trend lines.
The Price has recently failed to break below the key resistance level and is showing a reversal within the channel.
I expect the price to increase until it reaches the upper green trend line continuing the descending channel as drawn by the grey path.
If the price reaches the upper green trend line and breaks above it, I would wait for the retest back onto the trend line and go long until it reaches the next key resistance level

EURGBP is going for 0.95hello everyone,
Eurgbp is still bullish at monthly timeframe, we are on sideways market now just getting in more sellers for price to go up
Good luck everyone


EURGBP H4 TIMEFRAME ANALYSIS 3R TARGETAs you can see from the chart we wait for the price to reach the key support level near the two green lines near the lower channel line. We buy this pair expecting it to fuel higher up to the upper channel line before it does what it is known to do as usual. As you can see this week we are already in a good profit from our previous analysis, this is actually fantastic. We hope you will also get phenomenal rewards on this. Just stay with us. (Disclaimer, invest at your own risk). This is our view. What is your view on this pair?

EURGBP Daily DEMAND BUYLook to buy at 0.87654 for what could be a 7:1 RR depending on the risk. It already bounced but it will come back with plenty of buy orders still waiting.

EURGBP - Great R/R TRADE OPPORTUNITY!!!EURGBP - Great R/R TRADE OPPORTUNITY!!!
This pair did my head in yesterday, nearly get stopped out but I was disciplined and the patience paid off this morning waking up to green screen! That's the best feeling but everyday isn't like that. Don't get your emotions get to you whilst trading, I actually learnt this the hard way and I'm still working on that but you are who you bring to the market, there are great psychology books to help with this - if you are struggling message me privately I will be sure to give you trading reading list.
I got in at the lows of the formation, scaled in - Took 60% of partial profits got two more long positions in.
Technical aspects:
Pattern: Wedge
Support: 0.88240, 0.88100, 0.87960
Resistance: 0.88380, 0.88520, 0.88780, 0.89100
Fundamental aspects:
BoE TODAY - Focus on negative rates - I don't personally think they will go towards negative rates, vaccine roll out is positive, no further QE is really needed.
Don't forget to enter this trade idea, add your own trading plan towards it. Add further confluence.
Key tip: Be humble - There are so many ways to trade out there, but most important is if your way of trading is gaining capital - Keep Doing You!
Have a great Thursday!!
Trade Journal
(Just a trade idea, not a recommendation)


EURGBP bullish Monthly timeframe Hello everyone, eurgbp is targeting 1.0 incomming months, Monthly timeframe looks very bullish to me

EURGBP LongLong reasons:
-Ending diagonal
-Bullish engulfing candle
-61,8 Fibo correction on M15
-RR 1:3
Trade safe and simple🤓

EURGBP: A possible CHANNEL BREAKOUT!Hi traders and welcome to my channel, if you enjoy my FREE Technical Analysis 📈 and Trading Tips 📉, support the idea hitting the LIKE 👍 button and don't forget to SUBSCRIBE ✔️ my channel, you won't miss anything !
🟢 Forex Pair :
EUR/GBP
⚪ Technical Analysis :
Since the beginning of January 2021, the price has been following an interesting descending channel, breaking through the S/R level at about 0.89300, getting many rejections on the support level at about 0.88100.
It is currently re-testing the same level and the next price action around that zone will be essential to understand the next market movement.
🔴 Conclusion :
The price seems to be not strong enough to break the current support zone.
I'm confident to see it getting one more rejection, moving up with a bullish impulse until the next S/R level at about 0.89200.
I'll be waiting for the breakout of its channel before planning my long position on this trade.
Stay tuned for Updates and Trading Signals !
What's your opinion? Share your idea writing a comment!
⚠️ Please note the views are not investment advice and should be used only for educational purposes ⚠️
Trade Safe and Responsibly ,
Gianni


EURGBP long trade ideaPlan: resistance level breakout --> wait for the price to bounce off from support level --> wait for the rejection candle pattern to form e.g. bullish engulfing, pinbar, etc --> BUY
**Disclaimer** the content on this analysis is subject to change at any time without notice, and is provided for the sole purpose of assisting traders to make independent investment decisions.
Traders!! if you like my ideas and do take the same trade as I do, please write it in a comment so we can manage the trade together.
_____________________________________________________________________________________________________________________
Thank you for your support ;)
GWBFX

EURGBP ANALYSISEUR/GBP remains within this downwards trend channel, its bearish bias remains in place.

[Market Breakdown 2] EURGBPWEEKLY
We are sitting at a Weekly low zone as you can see.
Rejecting since June 2020 as support so pretty strong zone.
It's not only Support it's a clear Supply & Demand zone.
We have a -27 Fib completion, so we can expect a change of momentum.
These are all indications for a Long set-up.

EURGBP will go up now?The price already break the Lower High and High Level which tell me this is uptrend. And also if the price break and close above the trendline will also be confirm that this is an uptrend.
I see 2 choices to open the long position. Buy at retracement (the Red Zone) or buy instant (High-Risk).
This is just my personal opinion and idea. Please trade at your own risk.

EURGBP Have Yet To Breakout From Consolidation AreaLooking at EURGBP, we can see that price level has been moving within the support line @0.8896 and the resistance line @0.9085. With that, we managed to see instances where fakeout took placed with price level overextending out of this area. As of now, EURGBP has yet to show a strong BEARISH movement and might indicate that current movement might be a fakeout rather than a breakout. Instead, we managed to see price testing a weaker support @0.8833 and made a clean rejection from there. I am expecting price level to move back to the consolidation zone and continues moving sideway.
Kindly hit the LIKE Button if you agree with my analysis and feel free to COMMENT your idea below. As for those who are keen to get daily updates and analysis from me feel free to FOLLOW me. Cheers and Happy Trading!!

Bullish Bat PatternEURGBP BULLISH BAT PATTERN
Market Buy Order Set Up.
Buy Entry: (0.88371)
Min Take-Profit: (0.88678)
Max Take-Profit: (0.88871)
Stop-Loss: (0.88118)
Max Risk-Reward: (1.98)
Smash a Like button and leave a Comment, I appreciate every support. Goodluck.

