EURGBP Q3 | D21 | W30 | Y25📊EURGBP Q3 | D21 | W30 | Y25
Daily Forecast 🔍📅
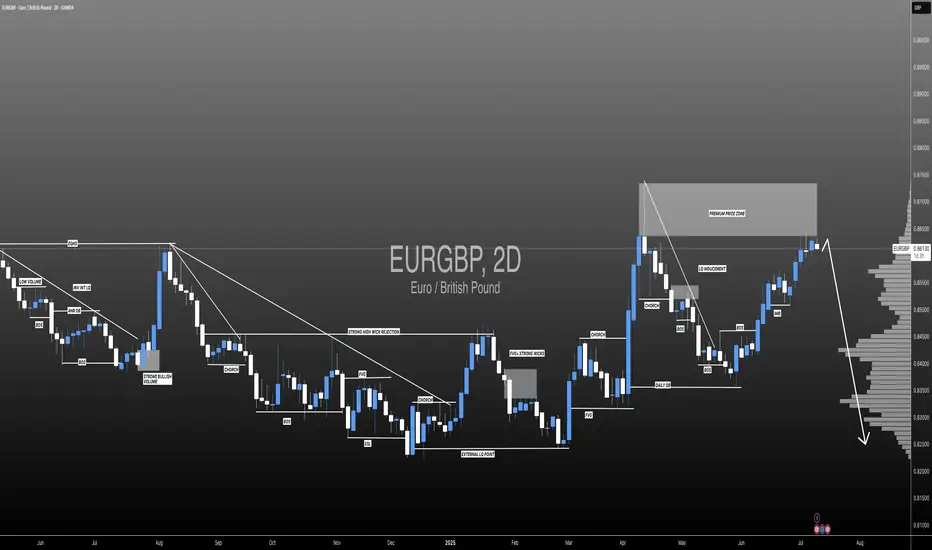
Here’s a short diagnosis of the current chart setup 🧠📈
Higher time frame order blocks have been identified — these are our patient points of interest 🎯🧭.
It’s crucial to wait for a confirmed break of structure 🧱✅ before forming a directional bias.
This keeps us disciplined and aligned with what price action is truly telling us.
📈 Risk Management Protocols
🔑 Core principles:
Max 1% risk per trade
Only execute at pre-identified levels
Use alerts, not emotion
Stick to your RR plan — minimum 1:2
🧠 You’re not paid for how many trades you take, you’re paid for how well you manage risk.
🧠 Weekly FRGNT Insight
"Trade what the market gives, not what your ego wants."
Stay mechanical. Stay focused. Let the probabilities work.
FRGNT 📊
Eurgbpshort

EURGBP – WEEKLY FORECAST Q3 | W30 | Y25📊 EURGBP – WEEKLY FORECAST
Q3 | W30 | Y25
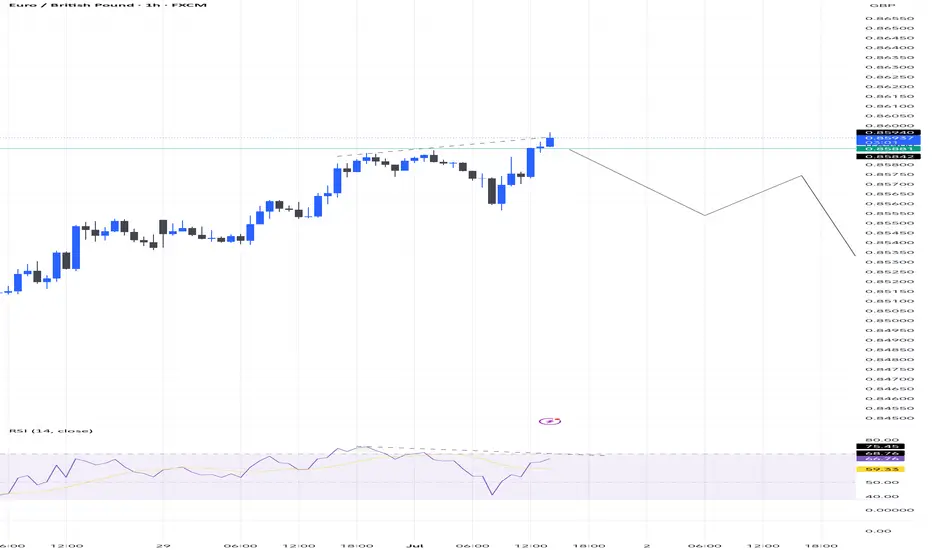
Weekly Forecast 🔍📅
Here’s a short diagnosis of the current chart setup 🧠📈
Higher time frame order blocks have been identified — these are our patient points of interest 🎯🧭.
It’s crucial to wait for a confirmed break of structure 🧱✅ before forming a directional bias.
This keeps us disciplined and aligned with what price action is truly telling us.
📈 Risk Management Protocols
🔑 Core principles:
Max 1% risk per trade
Only execute at pre-identified levels
Use alerts, not emotion
Stick to your RR plan — minimum 1:2
🧠 You’re not paid for how many trades you take, you’re paid for how well you manage risk.
🧠 Weekly FRGNT Insight
"Trade what the market gives, not what your ego wants."
Stay mechanical. Stay focused. Let the probabilities work.
FRGNT FOREX ANALYSIS 📊

EURGBP – Waiting for the Market to Come to UsWe are patiently waiting for price to correct
and reach our level.
📌 If the price touches the level and gives us a valid signal,
we will buy.
📉 But if the level is broken, we don't panic —
we simply wait for a pullback and enter a short position.
🧠 No guessing, no stress.
We let the market come to us, and then we react — according to plan.

EURGBP: Is This The End Of The Bulls? The GBP/USD pair has exhibited a consistent bullish trend, driven by a remarkable price momentum that is unprecedented in recent history. However, we anticipate a potential bearish reversal, as the market is witnessing a confluence of bearish indicators and increasing volume. Historically, the British pound has held a dominant position in this market, and long-term bears are likely to gain control.
Therefore, it is crucial to closely monitor the incoming market volume and, most importantly, the prevailing market sentiment. Your continued support throughout this journey is greatly appreciated. If you wish to encourage us, kindly like and comment on our ideas.
Team Setupsfx_
❤️❤️🚀🚀
EURGBP short trade Idea with divergence 💶 EURGBP SHORT SETUP – Clean Supply Rejection 📉🔥
Looking at a fresh opportunity to short EURGBP based on recent price action and structure:
🔹 Market Context:
Price recently pushed into a key supply zone or resistance around 0.84800–0.85000.
Multiple rejections spotted at that level – suggesting weak bullish momentum and engineered liquidity.
🔹 Setup Bias: Bearish
We’re anticipating a short-term correction or continuation to the downside, targeting recent demand zones or imbalances.
🔹 Trade Setup (Example):
Entry: ~0.84800
Stop Loss: ~0.85100 (above supply wick)
Take Profit: ~0.84100 (demand/imbalance fill area)
Risk to Reward: ~1:3 potential
🔹 Confluences:
Rejection candle at supply
Divergence
Price broke structure (BOS) to the downside earlier
Overbought signals (if using RSI/Stoch)
Clean imbalance zone below
📊 Execution Tip:
Wait for confirmation (M15 bearish engulfing / lower high break) to avoid early entries.
EURGBP WEEKLY HIGHER TIME FRAME FORECAST Q3 W27 Y25EURGBP WEEKLY HIGHER TIME FRAME FORECAST Q3 W27 Y25
Professional Risk Managers👋
Welcome back to another FRGNT chart update📈
Diving into some Forex setups using predominantly higher time frame order blocks alongside confirmation breaks of structure.
Let’s see what price action is telling us today! 👀
💡Here are some trade confluences📝
✅Weekly 50EMA Rejection
✅Daily Order block identified
✅4H Order Block identified
🔑 Remember, to participate in trading comes always with a degree of risk, therefore as professional risk managers it remains vital that we stick to our risk management plan as well as our trading strategies.
📈The rest, we leave to the balance of probabilities.
💡Fail to plan. Plan to fail.
🏆It has always been that simple.
❤️Good luck with your trading journey, I shall see you at the very top.
🎯Trade consistent, FRGNT X

DAILY HOT PICK HTF 50 EMA'S -EURGBP SHORT FORECAST Q2 W23 D2 Y25🔥👀TECHNICAL HOT PICK OF THE DAY
EURGBP SHORT FORECAST Q2 W23 D2 Y25
Professional Risk Managers👋
Welcome back to another FRGNT chart update📈
Diving into some Forex setups using predominantly higher time frame order blocks alongside confirmation breaks of structure.
Let’s see what price action is telling us today!
💡Here are some trade confluences📝
✅Weekly order block
✅15' order block
✅HTF 50 EMA'S
✅Tokyo ranges to be filled
🔑 Remember, to participate in trading comes always with a degree of risk, therefore as professional risk managers it remains vital that we stick to our risk management plan as well as our trading strategies.
📈The rest, we leave to the balance of probabilities.
💡Fail to plan. Plan to fail.
🏆It has always been that simple.
❤️Good luck with your trading journey, I shall see you at the very top.
🎯Trade consistent, FRGNT X

EUR/GBP Breakdown in Play: Time to Target the Next Support Below🔍 Technical Analysis Summary: EUR/GBP (Daily)
The pair is in a clear downtrend, with two descending blue trendlines confirming strong bearish pressure. After breaking below key support (now turned resistance), the price is forming lower highs and lower lows, a classic bearish continuation pattern. Currently, price is testing the trendline zone after a steep rejection, indicating renewed selling interest at resistance. Price failed to break above recent structure, validating the short setup further.
📉 Bearish Confluences
1. Descending Trendline
The price respects a multi-month downward trendline, rejecting it multiple times — confirming institutional selling interest.
2. Failed Retest of Structure (0.8465)
This level acted as prior support and has flipped into strong resistance. Price was rejected upon retesting, validating bearish continuation.
3. Momentum Shift
Candlestick structure and shrinking bullish bodies near resistance show fading bullish momentum — favoring sellers.
4. Lower Highs and Lower Lows
The chart clearly prints lower highs, indicating continuous bearish structure since early April.
✅ Trade Setup: Short Position
• Entry Point
🟡 Current market price around 0.83710–0.83740 after rejection from resistance
• Stop Loss (SL)
🔴 Above recent resistance and trendline at 0.84650
• Take Profit 1 (TP1)
🟢 Near recent support zone at 0.83234
• Take Profit 2 (TP2):
🟢 Near major trendline confluence / stronger support at 0.82218
📌 Final Thoughts
This EUR/GBP short setup is technically sound:
• It aligns with the overall trend
• Resistance has been confirmed with rejection wicks and weak bullish candles
• Bearish structure and trendline resistance remain intact
💡 Unless EUR/GBP breaks above 0.84650, the bias remains bearish, and this setup favors a continuation toward lower supports.

HOT PICK OF THE DAY EURGBP SHORT FORECAST Q2 W22 D29 Y25🔥👀TECHNICAL HOT PICK OF THE DAY ALONGSIDE HTF 50 EMA
EURGBP SHORT FORECAST Q2 W22 D29 Y25
Professional Risk Managers👋
Welcome back to another FRGNT chart update📈
Diving into some Forex setups using predominantly higher time frame order blocks alongside confirmation breaks of structure.
Let’s see what price action is telling us today!
💡Here are some trade confluences📝
✅Weekly order block
✅15' order block
✅Intraday bearish breaks of structure
✅Tokyo ranges to be filled
🔑 Remember, to participate in trading comes always with a degree of risk, therefore as professional risk managers it remains vital that we stick to our risk management plan as well as our trading strategies.
📈The rest, we leave to the balance of probabilities.
💡Fail to plan. Plan to fail.
🏆It has always been that simple.
❤️Good luck with your trading journey, I shall see you at the very top.
🎯Trade consistent, FRGNT X

HOT PICK ALONGSIDE HTF 50 EMA - SHORT FORECAST Q2 W22 D28 Y25 🔥👀TECHNICAL HOT PICK ALONGSIDE HTF 50 EMA
EURGBP SHORT FORECAST Q2 W22 D28 Y25
Professional Risk Managers👋
Welcome back to another FRGNT chart update📈
Diving into some Forex setups using predominantly higher time frame order blocks alongside confirmation breaks of structure.
Let’s see what price action is telling us today!
💡Here are some trade confluences📝
✅Weekly order block
✅15' order block
✅Intraday bearish breaks of structure
✅Tokyo ranges to be filled
🔑 Remember, to participate in trading comes always with a degree of risk, therefore as professional risk managers it remains vital that we stick to our risk management plan as well as our trading strategies.
📈The rest, we leave to the balance of probabilities.
💡Fail to plan. Plan to fail.
🏆It has always been that simple.
❤️Good luck with your trading journey, I shall see you at the very top.
🎯Trade consistent, FRGNT X

Why EUR vs GBP Could Be Your Best Trade This Week!When it comes to forex swing trading or even forex intraday trading, the temptation to zoom into lower timeframes—like the 15-minute or 1-hour charts—is strong. Most forex traders focus on short-term momentum, often diving into scalping strategies that chase quick pips. However, the real edge lies where most don’t look: the higher timeframes, particularly the weekly chart. The EUR/GBP forex pair is a perfect example of these higher timeframes' power, especially when paired with smart money concepts like demand and supply imbalances.
EUR/GBP: A Hidden Gem for Forex Swing Traders
The EUR/GBP Forex cross pair is often overlooked compared to major USD-based pairs. However, for seasoned swing traders and institutional players, EUR/GBP offers deep liquidity, cleaner technical analysis and price action structures, and strong reaction zones that are respected time and time again.
At the end of May 2025, a significant weekly demand imbalance at 0.8384 finally took control of price action—something smart money traders had been anticipating for months. This wasn't a surprise for those watching the higher timeframes. Similar to how the previous weekly imbalance at 0.8299 took control in February 2025, these zones have proven critical in guiding the medium- to long-term direction of EUR/GBP.

TECHNICAL HOT PICK - EURGBP SHORT FORECAST Q2 W22 D26 Y25🔥👀TECHNICAL HOT PICK
EURGBP SHORT FORECAST Q2 W22 D26 Y25
Professional Risk Managers👋
Welcome back to another FRGNT chart update📈
Diving into some Forex setups using predominantly higher time frame order blocks alongside confirmation breaks of structure.
Let’s see what price action is telling us today!
💡Here are some trade confluences📝
✅Weekly order block
✅15' order block
✅Intraday bearish breaks of structure
✅Tokyo ranges to be filled
🔑 Remember, to participate in trading comes always with a degree of risk, therefore as professional risk managers it remains vital that we stick to our risk management plan as well as our trading strategies.
📈The rest, we leave to the balance of probabilities.
💡Fail to plan. Plan to fail.
🏆It has always been that simple.
❤️Good luck with your trading journey, I shall see you at the very top.
🎯Trade consistent, FRGNT X

EURGBP FORCAST FOR NEXT WEEKSell Opportunity anticipation
Entry: 0.83994
Sl: 0.84077
Tp: 0.83200
Support breaken. Further sell anticipated.
Comments your opinion
For Account management. Connect on X @shajudeakinoba1

EUR/GBP "The Chunnel" Forex Bank Heist Plan (Scalping/Day Trade)🌟Hi! Hola! Ola! Bonjour! Hallo! Marhaba!🌟
Dear Money Makers & Robbers, 🤑💰✈️
Based on 🔥Thief Trading style technical and fundamental analysis🔥, here is our master plan to heist the EUR/GBP "The Chunnel" Forex Market. Please adhere to the strategy I've outlined in the chart, which emphasizes short entry. Our aim is the high-risk YELLOW MA Zone. It's a Risky level, oversold market, consolidation, trend reversal, trap at the level where traders and bullish robbers are stronger. 🏆💸"Take profit and treat yourself, traders. You deserve it!💪🏆🎉
Entry 📈 : "The vault is wide open! Swipe the Bearish loot at any price - the heist is on!
however I advise to Place sell limit orders within a 15 or 30 minute timeframe most nearest or swing, low or high level for Pullback Entries.
Stop Loss 🛑:
📌Thief SL placed at the nearest/swing High or Low level Using the 4H timeframe (0.85400) Day/Swing trade basis.
📌SL is based on your risk of the trade, lot size and how many multiple orders you have to take.
Target 🎯: 0.84000
💰💵💸EUR/GBP "The Chunnel" Forex Market Heist Plan (Scalping/Day Trade) is currently experiencing a Bearish trend.., driven by several key factors.👇👇👇
📰🗞️Get & Read the Fundamental, Macro, COT Report, Quantitative Analysis, Sentimental Outlook, Intermarket Analysis, Future trend targets and Overall outlook score..., go ahead to check 👉👉👉🔗🔗🌎🌏🗺
⚠️Trading Alert : News Releases and Position Management 📰 🗞️ 🚫🚏
As a reminder, news releases can have a significant impact on market prices and volatility. To minimize potential losses and protect your running positions,
we recommend the following:
Avoid taking new trades during news releases
Use trailing stop-loss orders to protect your running positions and lock in profits
💖Supporting our robbery plan 💥Hit the Boost Button💥 will enable us to effortlessly make and steal money 💰💵. Boost the strength of our robbery team. Every day in this market make money with ease by using the Thief Trading Style.🏆💪🤝❤️🎉🚀
I'll see you soon with another heist plan, so stay tuned 🤑🐱👤🤗🤩

APPLY CAUTION EURGBP SHORT FORECAST Q2 W21 D22 Y25EURGBP SHORT FORECAST Q2 W21 D22 Y25
Professional Risk Managers👋
Welcome back to another FRGNT chart update📈
Diving into some Forex setups using predominantly higher time frame order blocks alongside confirmation breaks of structure.
Let’s see what price action is telling us today!
💡Here are some trade confluences📝
✅Weekly order block
✅15' order block
✅Intraday bearish breaks of structure
✅Tokyo ranges to be filled
🔑 Remember, to participate in trading comes always with a degree of risk, therefore as professional risk managers it remains vital that we stick to our risk management plan as well as our trading strategies.
📈The rest, we leave to the balance of probabilities.
💡Fail to plan. Plan to fail.
🏆It has always been that simple.
❤️Good luck with your trading journey, I shall see you at the very top.
🎯Trade consistent, FRGNT X

EURGBP SHORT FORECAST Q2 W21 D21 Y25EURGBP SHORT FORECAST Q2 W21 D21 Y25
Professional Risk Managers👋
Welcome back to another FRGNT chart update📈
Diving into some Forex setups using predominantly higher time frame order blocks alongside confirmation breaks of structure.
Let’s see what price action is telling us today!
💡Here are some trade confluences📝
✅Weekly order block
✅15' order block
✅Intraday bearish breaks of structure
✅Tokyo ranges to be filled
🔑 Remember, to participate in trading comes always with a degree of risk, therefore as professional risk managers it remains vital that we stick to our risk management plan as well as our trading strategies.
📈The rest, we leave to the balance of probabilities.
💡Fail to plan. Plan to fail.
🏆It has always been that simple.
❤️Good luck with your trading journey, I shall see you at the very top.
🎯Trade consistent, FRGNT X

EUR/GBP – Bearish Breakout Expected & Triangle Pattern + TargetThe EUR/GBP pair is currently consolidating within a well-defined symmetrical triangle pattern on the 1-hour timeframe, often considered a neutral pattern that precedes a breakout in either direction. However, when placed in context with the prevailing downtrend, surrounding key support/resistance zones, and price action behavior, this pattern strongly hints at a bearish continuation.
This is a textbook setup where market compression within a triangle leads to a volatility expansion, offering traders a clear breakout structure with manageable risk and high reward potential.
🔺 Chart Pattern: Symmetrical Triangle
A symmetrical triangle forms when the price creates lower highs and higher lows, converging toward an apex. This indicates market indecision or consolidation. The price is being squeezed between buyers and sellers, leading to reduced volatility.
In the current EUR/GBP chart:
The triangle is forming after a strong bearish impulse, which suggests the probability favors a breakout to the downside (trend continuation).
The triangle’s boundaries are respected with multiple touches, increasing the reliability of the pattern.
🧭 Key Technical Levels:
🔴 Resistance Zone:
The 0.84290 level has acted as strong resistance, capping bullish attempts multiple times. This zone aligns with the upper boundary of the triangle and the prior rejection point.
🟢 Support Zone:
The 0.83915 - 0.83710 zone is a previous support structure that saw multiple reactions. This is the projected take-profit region if the breakdown follows through.
🔵 Breakout Retest Area:
If price breaks the lower triangle trendline (~0.84100), a retest of the broken line may offer a high-probability short entry. This is a common occurrence in technical setups — former support becomes new resistance.
🧠 Market Psychology Insight:
Triangle patterns often reflect a period of balance — bulls and bears are temporarily equal in strength. However, when the price is compressing inside a triangle after a strong directional move (in this case, downward), the market is typically building pressure to continue in the same direction.
The inability of bulls to push past the resistance and the repeated rejection at lower highs is a psychological signal that buyers are weakening, and a bearish breakout is imminent.
📋 Bearish Trade Plan:
Entry:
After price breaks below the lower triangle boundary (~0.84100) and retests it.
Enter on confirmation of bearish candle rejection or strong volume.
Stop Loss (SL):
Above resistance and triangle top: ~0.84290
This invalidates the setup if breached.
Take Profits:
TP1: 0.83915 — minor support zone and realistic first target.
Final TP: 0.83710 — major support and historical price reaction level.
Risk-Reward Ratio:
With SL around 20 pips and TP1 around 30 pips, and TP2 near 50 pips, this setup offers an excellent risk-reward profile (>1.5 to 2.5 R:R).
📅 Upcoming Events & Volatility Watch:
There are multiple economic events shown on the chart (Euro and UK flags). These could impact price action significantly:
Eurozone announcements
UK economic data releases
Ensure you monitor the economic calendar and avoid entering just before high-impact events unless you're managing your trade closely.
📝 Final Thoughts:
This is a high-probability breakout setup for swing or intraday traders who favor trading patterns with clear structure and back-tested success. The market is compressing, and the squeeze is tightening. Volume is likely to surge on breakout, especially during London or early US sessions.
Keep in mind:
Confirmation is crucial — wait for a decisive breakout and retest before committing capital.
Risk management is non-negotiable — place SL logically beyond structure and respect it.
📌 If the breakout happens to the upside, reevaluate the bias and wait for fresh confirmation. The structure itself remains valid either way — it’s how price reacts at those boundary levels that will dictate the move.

EURGBP SHORT FORECAST Q2 W21 D20 Y25EURGBP SHORT FORECAST Q2 W21 D20 Y25
OK, LONG TERM BULLISH,
BUT BUT BUT, LET COLLECT SOME MONEY BEFORE THE LONG MOVE!
ITS THERE FOR THE TAKING !!!!!!!
Professional Risk Managers👋
Welcome back to another FRGNT chart update📈
Diving into some Forex setups using predominantly higher time frame order blocks alongside confirmation breaks of structure.
Let’s see what price action is telling us today!
💡Here are some trade confluences📝
✅Weekly order block
✅15' order block
✅Intraday bearish breaks of structure
✅Tokyo ranges to be filled
🔑 Remember, to participate in trading comes always with a degree of risk, therefore as professional risk managers it remains vital that we stick to our risk management plan as well as our trading strategies.
📈The rest, we leave to the balance of probabilities.
💡Fail to plan. Plan to fail.
🏆It has always been that simple.
❤️Good luck with your trading journey, I shall see you at the very top.
🎯Trade consistent, FRGNT X

OK, LONG TERM BULLISH, BUT BUT BUT, LET COLLECT SOME MONEY!EURGBP SHORT FORECAST Q2 W21 Y25
OK, LONG TERM BULLISH, BUT BUT BUT, LET COLLECT SOME MONEY BEFORE THE LONG MOVE! ITS THERE FOR THE TAKING !!!!!!!
Professional Risk Managers👋
Welcome back to another FRGNT chart update📈
Diving into some Forex setups using predominantly higher time frame order blocks alongside confirmation breaks of structure.
Let’s see what price action is telling us today!
💡Here are some trade confluences📝
✅Weekly order block
✅15' order block
✅Intraday bearish breaks of structure
✅Tokyo ranges to be filled
🔑 Remember, to participate in trading comes always with a degree of risk, therefore as professional risk managers it remains vital that we stick to our risk management plan as well as our trading strategies.
📈The rest, we leave to the balance of probabilities.
💡Fail to plan. Plan to fail.
🏆It has always been that simple.
❤️Good luck with your trading journey, I shall see you at the very top.
🎯Trade consistent, FRGNT X

EURGBP SHORT FORECAST Q2 W20 D16 Y25EURGBP SHORT FORECAST Q2 W20 D16 Y25
Professional Risk Managers👋
Welcome back to another FRGNT chart update📈
Diving into some Forex setups using predominantly higher time frame order blocks alongside confirmation breaks of structure.
Let’s see what price action is telling us today!
💡Here are some trade confluences📝
✅Weekly order block
✅15' order block
✅Intraday bearish breaks of structure
✅Tokyo ranges to be filled
🔑 Remember, to participate in trading comes always with a degree of risk, therefore as professional risk managers it remains vital that we stick to our risk management plan as well as our trading strategies.
📈The rest, we leave to the balance of probabilities.
💡Fail to plan. Plan to fail.
🏆It has always been that simple.
❤️Good luck with your trading journey, I shall see you at the very top.
🎯Trade consistent, FRGNT X

EURGBP SHORT FORECAST Q2 W20 D15 Y25EURGBP SHORT FORECAST Q2 W20 D15 Y25
Professional Risk Managers👋
Welcome back to another FRGNT chart update📈
Diving into some Forex setups using predominantly higher time frame order blocks alongside confirmation breaks of structure.
Let’s see what price action is telling us today!
💡Here are some trade confluences📝
✅Weekly order block
✅15' order block
✅Intraday bearish breaks of structure
✅Tokyo ranges to be filled
🔑 Remember, to participate in trading comes always with a degree of risk, therefore as professional risk managers it remains vital that we stick to our risk management plan as well as our trading strategies.
📈The rest, we leave to the balance of probabilities.
💡Fail to plan. Plan to fail.
🏆It has always been that simple.
❤️Good luck with your trading journey, I shall see you at the very top.
🎯Trade consistent, FRGNT X

EURGBP SHORT FORECAST Q2 W20 D13 Y25EURGBP SHORT FORECAST Q2 W20 D13 Y25
Professional Risk Managers👋
Welcome back to another FRGNT chart update📈
Diving into some Forex setups using predominantly higher time frame order blocks alongside confirmation breaks of structure.
Let’s see what price action is telling us today!
💡Here are some trade confluences📝
✅Weekly order block
✅15' order block
✅Intraday bearish breaks of structure
✅Tokyo ranges to be filled
🔑 Remember, to participate in trading comes always with a degree of risk, therefore as professional risk managers it remains vital that we stick to our risk management plan as well as our trading strategies.
📈The rest, we leave to the balance of probabilities.
💡Fail to plan. Plan to fail.
🏆It has always been that simple.
❤️Good luck with your trading journey, I shall see you at the very top.
🎯Trade consistent, FRGNT X

EURGBP SHORT FORECAST Q2 W20 D12 Y25EURGBP SHORT FORECAST Q2 W20 D12 Y25
Professional Risk Managers👋
Welcome back to another FRGNT chart update📈
Diving into some Forex setups using predominantly higher time frame order blocks alongside confirmation breaks of structure.
Let’s see what price action is telling us today!
💡Here are some trade confluences📝
✅Weekly order block
✅15' order block
✅Intraday bearish breaks of structure
✅Tokyo ranges to be filled
🔑 Remember, to participate in trading comes always with a degree of risk, therefore as professional risk managers it remains vital that we stick to our risk management plan as well as our trading strategies.
📈The rest, we leave to the balance of probabilities.
💡Fail to plan. Plan to fail.
🏆It has always been that simple.
❤️Good luck with your trading journey, I shall see you at the very top.
🎯Trade consistent, FRGNT X
