DeGRAM | EURGBP contraction and trend continuationEURGBP makes higher lows and higher highs. It bounced off the daily support level.
The market broke and closed above the resistance that became support.
Price also broke the consolidation zone that will act as support.
We anticipate a pullback to support and continue the trend.
-------------------
Share your opinion in the comments and support the idea with a like. Thanks for your support!
Eurgbpsignal

EURGBP Idea H1Here is my analysis for EURGBP on H1 using Order Block. The price could go bearish, you can put a pending order on the Order block or find an entry on LTF within OB Zone. Trade Safe!

DeGRAM | EURGBP in consolidation zoneEURGBP pulled back to resistance, then made a massive sell-off.
Price move is in the ascending channel, and it's printing an AB=CD pattern.
We anticipate a bearish move from the psychological level at 0.87000 and a retest of the support since the market is consolidating.
-------------------
Share your opinion in the comments and support the idea with like. Thanks for your support!

EUR/GBP Retreat Amid Mixed PMI ForecastsAnalyzing the EUR/GBP 1-hour chart provided:
Pattern Recognition:
- The chart shows a recent decline from the 'Premium' level, indicating a resistance zone.
- The price is currently approaching the 'Equilibrium' level, which may act as a short-term support.
- A series of lower highs from the 'Weak high' suggests a potential downtrend in the making.
Trading Strategy:
- Confidence Level: Moderate
- Recommended Position: Short, with caution for a potential bounce or reversal at the Equilibrium level.
- Entry Point: The current level (approximately 0.8746) could serve as an entry point if the price demonstrates continued weakness, breaking below the Equilibrium level.
- Exit Point: Target the 'Discount' zone for potential exit around 0.8700. If the price breaks below this level, it could suggest further bearish momentum, potentially heading towards the 'Strong Low' around 0.8690.
Key Observations:
- The price is in a pullback phase within a larger range-bound market structure. The 'BOS' (Break of Structure) markers indicate significant levels where price structure has been broken, and these could serve as future areas of interest for support/resistance flips.
- The presence of 'ChOCH' (Change of Character) markers suggest volatility and potential changes in market sentiment at these levels.
Conclusion: Look to short the EUR/GBP with a conservative target, while monitoring price action at key levels such as the Equilibrium and Discount zones. Beware of potential reversals as the price is near a historically significant level.

EURGBP Analysis H1Here is my analysis for EURGBP on H1 using Order Block. The price could go bullish, you can put a pending order on the Order block or find an entry on LTF within OB Zone. Trade Safe!

EURGBPPair : EURGBP ( Euro / British Pound )
Description :
Completed " 1234 " Impulsive Wave at the Lower Trend Line of the Corrective Pattern " Rising Wedge " in Short Time Frame. It will Reject from the Fibonacci Level - 61.80% or Previous Resistance Level forming Triple Top
Entry Precautions :
Wait for the Proper Rejection Price Action

EURGBP:08/11/2023:🔴Sell opportunity🔴As you can see, the market structure is bearish and we looking for a sell.
There is a bearish order block with liquidity that makes it even stronger.
Attention please: We need LTF confirmation for entry.
💡Wait for the update!
🗓08/11/2023
🔎 DYOR
💌It is my honor to share your comments with me💌

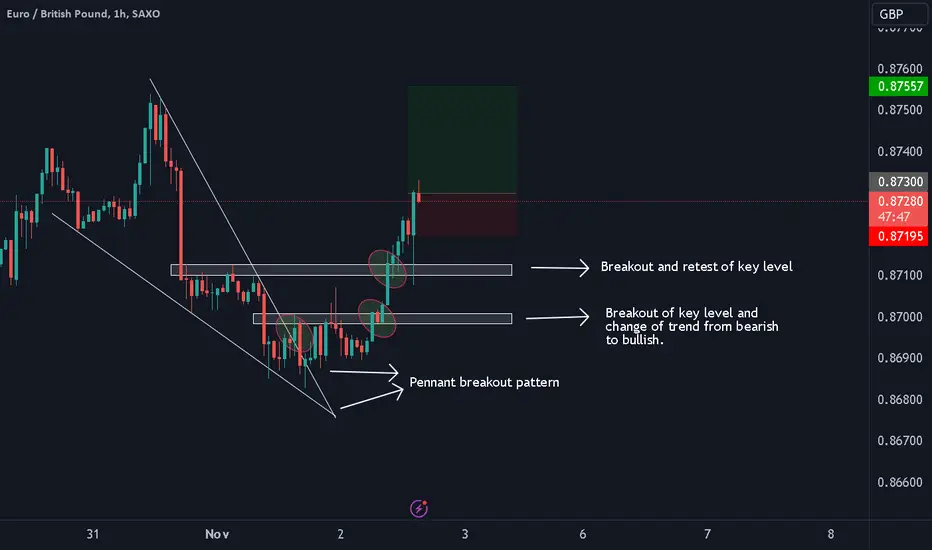
EURGBP Pennant Pattern Breakout We expect further upside on this pair, signalled by the breakout of the pennant pattern. We can also see the formation of a new high and a breakout of two key levels which further supports our directional basis.
EURGBP: 31/10/2023:🟢Buy opportunity🟢As you can see, the price penetrated the bearish order block.
Now we need LTF confirmation. I valid ChOCh occurs in 5 min. then we can buy.
Please pay attention to details.
💡Wait for the update!
🗓31/10/2023
🔎 DYOR
💌It is my honor to share your comments with me💌

EURGBP I Pullback and continuation Welcome back! Let me know your thoughts in the comments!
** EURGBP Analysis - Listen to video!
We recommend that you keep this pair on your watchlist and enter when the entry criteria of your strategy is met.
Please support this idea with a LIKE and COMMENT if you find it useful and Click "Follow" on our profile if you'd like these trade ideas delivered straight to your email in the future.
Thanks for your continued support!

EURGBP Analysis H4Here is my analysis for EURGBP on H4 using Order Block. The price could go bullish, you can put a pending order on the Order block or find an entry on LTF within OB Zone. Trade Safe!

EURGBP Long Term Buying Trading IdeaHello Traders
In This Chart Forex ForecastEURGBP DAY By FOREX PLANET
today EURGBP analysis 👆
🟢This Chart includes_ (EURGBP market update)
🟢What is The Next Opportunity on EURGBP Market
🟢how to Enter to the Valid Entry With Assurance Profit
This CHART is For Trader's that Want to Improve Their Technical Analysis Skills and Their Trading By Understanding How To Analyze The Market Using Multiple Timeframes and Understanding The Bigger Picture on the Charts.

EURGBP a break out could change everything very intense scenario going on eurgbp at the moment
analysing the weekly tf looks to me like the price is bullish , the price formed a double bottom broke and retested neckline .
but on lower tfs looks like something else the price formed a double top on daily and decending triangle on 1hr .
the neckline of the double to in daily is also accompanied with 100 and 200 moving averages if the price manages to break all of them without a doubt we will see a bearish move

EUR-GBP Bearish Breakout!EURGBP broke the support
Cluster of the rising and
Horizontal levels at 0.86717
And the breakout is confirmed
So I think that we will see
A further move down !

DeGRAM | EURGBP at major resistanceEURGBP is in an ascending channel, but the price is in consolidation on the 4-hourly chart.
Price bounced off the resistance level that was tested multiple times before. Look left.
We expect the price to retest the support levels and further move down to the support levels.
-------------------
Share your opinion in the comments and support the idea with like. Thanks for your support!

EURGBP : Short Trade , 1hHello traders, we want to check the EURGBP chart. The price has broken the ascending channel to the bottom and pulled back to the key level indicated. We expect this level to play the role of a resistance level and the price will fall to around 0.86300. Good luck.

EURGBP _____ INCOMING QUICK SHORT TRADEHello Guys,
How has the week been so far... Well for me, kinda bumpy but it's part of the game so I'm good.
Anyways, here we have a pair that just swept a monthly high (buy-side liquidity) and price formed a CHOCH on the daily timeframe, hence, the daily supply order.
I have set an alert for when the price will trade into the daily order block. Once that happens, I will drop down to the 1-hour timeframe to see if I will get my trade setup to go short.
Follow for more updates like this.
Cheers,
Jabari

EURGBP Analysis D1Here is my analysis for EURGBP on D1 using Order Block. The price could go bullish, you can put a pending order on the Order block or find an entry on LTF within OB Zone. Trade Safe!

EurGbp could rise above 0.88In the past 3 months, EurGbp has traded in a range between 0.85 zone and 0.8650
Last week, however, the pair managed to break above resistance an after a long time of consolidation we could expect continuation.
In this case, the next important level of resistance is above 0.88
The bullish scenario is valid as long as the pair stays above old resistance, now support

EURGBP Long Term Selling Trading IdeaHello Traders
In This Chart EURGBP HOURLY Forex Forecast By FOREX PLANET
today EURGBP analysis 👆
🟢This Chart includes_ (EURGBP market update)
🟢What is The Next Opportunity on EURGBP Market
🟢how to Enter to the Valid Entry With Assurance Profit
This CHART is For Trader's that Want to Improve Their Technical Analysis Skills and Their Trading By Understanding How To Analyze The Market Using Multiple Timeframes and Understanding The Bigger Picture on the Charts

EUR/GBP Primed for Movement Amidst Key Economic IndicatorsThe sentiment from central banks, coupled with softer UK inflation data, suggests a bullish move for EUR/GBP. The technical analysis aligns with this perspective, indicating a potential move towards the 0.8700 handle, especially with the currency pair managing to stay above the 0.8650 level.
TRADE IDEA DETAILS
CURRENCY PAIR: EUR/GBP
CURRENT TREND: Bullish
TRADE SIGNAL: Buy
👉ENTRY PRICE: 0.8655
✅TAKE PROFIT: 0.8700
❌STOP LOSS: 0.8630
TRADE PLAN:
Enter a buy position around the current level of 0.8655. Given the potential upside, a take profit can be set near the technical resistance of 0.8700. To protect the downside, considering the inherent market volatility and any unexpected shifts in sentiment or data, a stop loss at 0.8630 is prudent.
FINAL THOUGHTS:
This trading idea is predicated on both fundamental factors (central bank sentiments and economic data) and technical indicators. Traders should monitor the position closely, especially around the time of the BoE's rate decision and subsequent economic releases, as these could serve as catalysts for significant price movement.

DeGRAM | EURGBP at major resistanceEURGBP is approaching a major resistance level and dynamic resistance.
Price made a two-legged move in the ascending channel. Price is essentially in consolidation on the 4-hourly chart.
The market printed a bearish harmonic pattern on the daily chart, which adds more confluence to the level.
We anticipate a sell off and bearish move.
-------------------
Share your opinion in the comments and support the idea with like. Thanks for your support!

DeGRAM | EURGBP broke reaction zone in descending channel EURGBP is trading in the descending channel. The market is in a bearish trend.
Price rebounded from the resistance, broke, and closed below the significant level where price dropped.
We expect the price to retest the support levels and further move down from the resistance.
-------------------
Share your opinion in the comments and support the idea with like. Thanks for your support!
