EURGBP Bearish Breakout!
HI,Traders !
#EURGBP broke the rising
Support line and the breakout
Is confirmed so we are
Bearish biased and we
Will be expecting a
Further move down !
Comment and subscribe to help us grow !
Eurgbptrend

EUR/GBP Thief Trade: Swipe Profits Before Overbought Trap!🦹♂️ EUR/GBP "THE CHUNNEL HEIST" – BULLISH LOOT IN PROGRESS! 🚨💰
(Thief Trading Strategy – Escape Before the Cops Arrive!)
🎯 DEAR MARKET PIRATES & PROFIT SNATCHERS,
Based on our 🔥Thief Trading Style Analysis🔥, we’re executing a bullish heist on EUR/GBP ("The Chunnel"). The vault is wide open—time to swipe the loot before the high-risk resistance police barricade (aka overbought trap) shuts us down!
📜 THE MASTER PLAN:
✔ Entry (📈): "The Bullish Vault is Unlocked!"
Buy Limit Orders (15-30min TF) near recent swing lows/highs.
Thief’s DCA Trick: Layer entries like a pro robber—multiple limit orders for max loot.
✔ Stop Loss (🛑): "Hide Your Stash Wisely!"
SL at nearest 4H candle wick (0.86500)—adjust based on your risk appetite & lot size.
Remember: A good thief always has an escape route!
✔ Target (🎯): 0.88500 (or escape earlier if the cops get suspicious!)
🔎 SCALPERS & SWING BANDITS – LISTEN UP!
Scalpers: Stick to LONG-ONLY heists! Use trailing SL to protect profits.
Swing Thieves: If you’re low on cash, join the slow robbery—DCA & hold!
📡 WHY THIS HEIST IS HOT:
Bullish momentum in play (but BEWARE of overbought traps!).
Fundamental Drivers: Check COT Reports, Macro Data, & Sentiment.
🚨 TRADING ALERT: NEWS = POLICE RAID RISK!
Avoid new trades during high-impact news.
Trailing SL = Your Getaway Car! Lock profits before volatility strikes.
💥 BOOST THIS HEIST – STRENGTHEN THE GANG!
👉 Smash the LIKE & BOOST button to fuel our next market robbery!
👉 Follow for more heists—profit awaits! 🚀💰
🦹♂️ Stay Sharp, Stay Ruthless… See You on the Next Heist!

EURGBP Bullish Flag Pattern!
HI,Traders !
EURGBP is trading in an
Uptrend and made a bullish
Breakout out of bullish flag
Pattern so we are
Bullish biased and we
Will be expecting a
Further bullish move up !
Comment and subscribe to help us grow !

EURGBP – Waiting for the Market to Come to UsWe are patiently waiting for price to correct
and reach our level.
📌 If the price touches the level and gives us a valid signal,
we will buy.
📉 But if the level is broken, we don't panic —
we simply wait for a pullback and enter a short position.
🧠 No guessing, no stress.
We let the market come to us, and then we react — according to plan.

Ready to Raid the Chunnel? EUR/GBP Bullish Strategy Unveiled!🔥🤑 "THE CHUNNEL HEIST: EUR/GBP BULLISH LOOTING SEASON!" 🏴☠️💸
🌟 Greetings, Market Pirates & Profit Bandits! 🌟
(Hi! Hola! Ola! Bonjour! Hallo! Marhaba!)
Based on the 🚨THIEF TRADING STYLE🚨 (a ruthless mix of technical & fundamental analysis), we’re plotting a major heist on EUR/GBP "The Chunnel"—time to LOOT THE BULLS!
🚨 HEIST BLUEPRINT (LONG ENTRY) 🚨
🎯 Escape Zone: High-risk RED MA Zone (Overbought? Reversal? Trap? Bears lurking? Cops are waiting!).
🏆 Take Profit & Run! You’ve earned it, outlaw! 💰🔥
🔓 ENTRY: "VAULT IS OPEN—SWIPE THE BULLISH LOOT!" after the breakout
Pullback Entry near the Moving average @0.84850
Buy Limit Orders preferred (15-30min timeframe).
Swing Low/High Pullbacks = Perfect Stealth Entry.
⛔ STOP LOSS (SL): "DON’T GET CAUGHT!"
📍 Thief SL: Recent swing low (4H timeframe) @ 0.84000 (Scalping/Day Trade Basis).
⚠️ Adjust based on your risk, lot size & multiple orders!
🎯 TARGET: 0.85850 (OR ESCAPE EARLY IF HEAT’S ON!)
📢 WHY THIS HEIST? (BULLISH CATALYSTS)
💥 EUR/GBP is BULLISH—backed by:
Fundamentals (COT Report, Macro Data)
Sentiment & Intermarket Trends
Quantitative Edge (Check out for full intel! 👉🌎🔗)
🚨 TRADING ALERT: NEWS = DANGER ZONE!
📉 Avoid New Trades During High-Impact News!
🔒 Use Trailing Stops—Lock profits, evade volatility traps!
💥 BOOST THIS HEIST! (SUPPORT THE MISSION)
🔥 Hit the "LIKE" & "BOOST" button—strengthen our Profit Robbery Squad!
🤑 Daily Market Heists = Easy Money (Thief Trading Style FTW!)
Stay tuned for the next heist plan! 🚀🐱👤💖

Ready to Raid the Chunnel? EUR/GBP Bullish Strategy Unveiled!🔐💸"The Chunnel Heist: EUR/GBP Bank Job with Thief Trading Style"💸🔐
Master Plan for Smart Money Robbers, Scalpers, and Swing Traders – Chart Ready Strategy to Boost Your TradingView Clout
🌍 Greetings, Global Hustlers & Strategic Traders!
Hola! Ola! Bonjour! Hallo! Marhaba! Ni Hao! Ciao! 👋🌟
Welcome to Thief Trading Style, where we treat the market like a high-stakes heist and every pip is precious loot! 🏦💰
This time, the target is the EUR/GBP Forex Vault – nicknamed "The Chunnel". It’s time to outsmart the system and execute a calculated plan that balances technical setups with a thief’s precision. 🐱👤🔥
🧠 Heist Blueprint: EUR/GBP Bullish Setup
🔍 Concept:
We're spotting a bullish bias with underlying momentum for a breakout heist.
This move is not for the faint-hearted – police traps (resistance zones) and bearish defenders are guarding the top, but our tools (TA + FA) suggest a strong breakout is brewing. ⚠️📊
🚀 Thief Strategy at a Glance:
🟢 Entry (Stealth Mode)
💥 "The vault is wide open – grab the bullish loot!"
Initiate BUY positions on pullbacks, using a layering/DCA style entry system.
📅 Recommended on 15m or 30m charts for precision.
🎯 Key Entry Zone: Recent swing lows/highs – the quieter, unguarded door into the vault.
🛑 Stop Loss (Silent Exit Strategy)
Set SL near the most recent 1D timeframe wick low – smart risk management is key.
Adjust size based on your risk tolerance, lot sizes, and how deep you’ve stacked the entries.
🏁 Target (Escape Route)
🎯 Main Target: 0.88000
But remember – sometimes it’s safer to exit early if things get hot. Use trailing SLs to secure your loot and dodge the heat. 🔥🚓
💸 Scalper Advisory – Quick Snatch & Run
Scalpers should only ride the bullish momentum.
If your wallet's heavy, jump in early. If not, trail the swing traders and plan your entry like a pro.
🛡 Use tight trailing SLs to keep your gains in the bag.
📈 Why the Chunnel Heist Now?
The market is shifting:
🔹 Overbought conditions
🔹 Signs of trend reversal
🔹 Bullish divergence + liquidity grab setups
🔹 Positioning based on COT reports, sentiment analysis, macroeconomic shifts, and intermarket flow
👉 Full FA/TA/COT breakdown liinkedd in the Klick 🔗🔗
📢 Heads-Up: News Alert 🚨
📰 Major news events ahead – stay sharp.
❌ Avoid fresh entries during high-impact announcements.
✅ Use trailing SLs to lock profits and reduce emotional exposure.
❤️ Support the Heist, Boost the Team
🔥 Smash the "Boost" button if you're down with the Thief Trading Style
– it powers our next robbery and keeps the strategy alive!
Each boost strengthens the team and spreads the loot. Let’s out-trade the market, not just survive it. 🚀💰
⚠️ Disclaimer (The Clean Getaway)
📌 This is an educational, entertainment-based strategic overview – not financial advice.
📌 Always do your own due diligence and trade based on your personal risk profile.
📌 Markets shift quickly – adapt, adjust, and don’t marry your trades.
💬 Leave a comment if you’re riding this plan or if you’ve got your eyes on the next target.
🎯 Follow for more Thief Trading Heists – the next plan drops soon!
Stay stealthy, stay profitable. See you at the vault! 🏦🐱👤💸

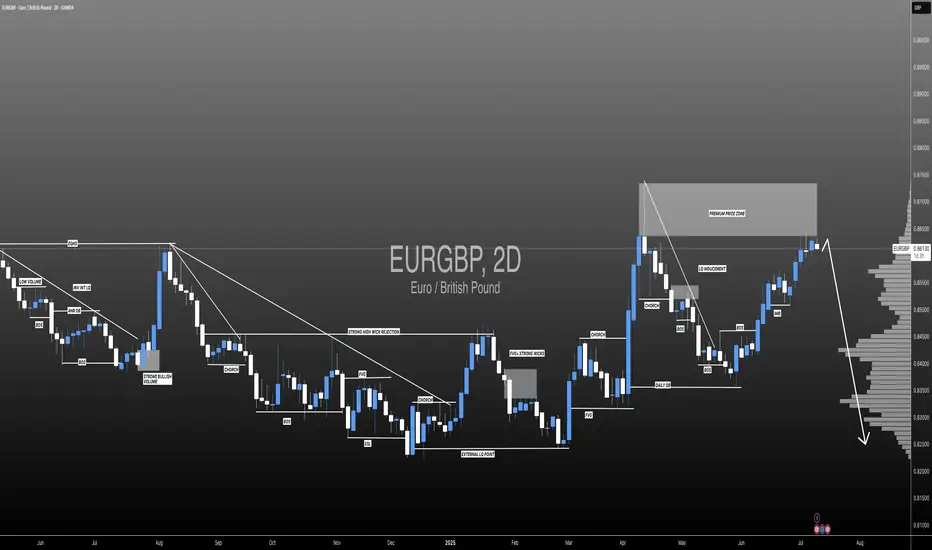
EURGBP: Is This The End Of The Bulls? The GBP/USD pair has exhibited a consistent bullish trend, driven by a remarkable price momentum that is unprecedented in recent history. However, we anticipate a potential bearish reversal, as the market is witnessing a confluence of bearish indicators and increasing volume. Historically, the British pound has held a dominant position in this market, and long-term bears are likely to gain control.
Therefore, it is crucial to closely monitor the incoming market volume and, most importantly, the prevailing market sentiment. Your continued support throughout this journey is greatly appreciated. If you wish to encourage us, kindly like and comment on our ideas.
Team Setupsfx_
❤️❤️🚀🚀
Market Analysis: EUR/GBP Accelerates HigherMarket Analysis: EUR/GBP Accelerates Higher
EUR/GBP is rising and might climb above the 0.8670 resistance.
Important Takeaways for EUR/GBP Analysis Today
- EUR/GBP is gaining pace and trading above the 0.8600 zone.
- There was a break above a contracting triangle with resistance at 0.8630 on the hourly chart at FXOpen.
EUR/GBP Technical Analysis
On the hourly chart of EUR/GBP at FXOpen, the pair started a decent increase from the 0.8500 zone. The Euro traded above the 0.8580 resistance level to enter a positive zone against the British Pound.
The pair settled above the 50-hour simple moving average and 0.8620. It traded as high as 0.8670 before a downside correction. There was a move below the 23.6% Fib retracement level of the upward move from the 0.8507 swing low to the 0.8670 high.
However, the pair is stable above the 0.8600 support zone. The next major support is near the 50% Fib retracement level of the upward move from the 0.8507 swing low to the 0.8670 high at 0.8590.
A downside break below 0.8590 might call for more downsides. In the stated case, the pair could drop toward the 0.8545 support level. Any more losses might call for an extended drop toward the 0.8505 pivot zone.
The EUR/GBP chart suggests that the pair is facing resistance near the 0.8635 zone. A close above the 0.8635 level might accelerate gains. In the stated case, the bulls may perhaps aim for a test of 0.8670. Any more gains might send the pair toward the 0.8700 level.
This article represents the opinion of the Companies operating under the FXOpen brand only. It is not to be construed as an offer, solicitation, or recommendation with respect to products and services provided by the Companies operating under the FXOpen brand, nor is it to be considered financial advice.

EURGBP Growth Ahead!
HI,Traders !
#EURGBP is trading along the
Rising support and is already
Making a bullish rebound so
AsTo the strong uptrend we
Will be expecting a further
Bullish move up on pair !
Comment and subscribe to help us grow !

EURGBP forex rallying as expected off weekly demand levelWeekly uptrend. Weekly demand imbalance at 0.83 is still in control and trying to play out as expected. Any swing long positions should be managed. I hope you could take advantage of long positions using the smaller timeframes for those intraday and short-term forex traders.

EURGBP Hits SupportEURGBP Hits Support
EUR/GBP declined steadily below the 0.8440 and 0.8430 support levels.
Important Takeaways for EUR/GBP Analysis Today
- EUR/GBP is trading in a bearish zone below the 0.8450 pivot level.
- There is a connecting bullish trend line forming with support at 0.8415 on the hourly chart at FXOpen.
EUR/GBP Technical Analysis
On the hourly chart of EUR/GBP at FXOpen, the pair started a fresh decline from well above 0.8460. The Euro traded below the 0.8440 and 0.8430 support levels against the British Pound.
The EUR/GBP chart suggests that the pair even declined below the 0.8420 level and tested 0.8415. It is now consolidating losses and trading below the 50-hour simple moving average. However, there is a connecting bullish trend line forming with support at 0.8415.
The pair is now facing resistance near the 50% Fib retracement level of the downward move from the 0.8442 swing high to the 0.8416 low at 0.8430.
The next major resistance could be 0.8440. The main resistance is near the 0.8450 zone. It coincides with the 1.236 Fib extension level of the downward move from the 0.8442 swing high to the 0.8416 low.
A close above the 0.8450 level might accelerate gains. In the stated case, the bulls may perhaps aim for a test of 0.8480. Any more gains might send the pair toward the 0.8500 level.
Immediate support sits near 0.8415. The next major support is near 0.8405. A downside break below the 0.8405 support might call for more downsides. In the stated case, the pair could drop toward the 0.8380 support level.
This article represents the opinion of the Companies operating under the FXOpen brand only. It is not to be construed as an offer, solicitation, or recommendation with respect to products and services provided by the Companies operating under the FXOpen brand, nor is it to be considered financial advice.

Falling Wedge - Bullish Reversal - Bullish DivergenceOANDA:EURGBP has formed and broken out of a falling wedge, which is considered a bullish reversal pattern. Pattern has formed after price found support at the support trend line and broke the lower highs in the retracement!
I am expecting bullish momentum in the coming days!

DAILY CLOSE ABOVE D50 EMA - EURGBP LONG FORECAST Q2 W23 D3 Y25
EURGBP LONG FORECAST Q2 W23 D3 Y25
Professional Risk Managers👋
Welcome back to another FRGNT chart update📈
Diving into some Forex setups using predominantly higher time frame order blocks alongside confirmation breaks of structure.
Let’s see what price action is telling us today!
💡Here are some trade confluences📝
✅Daily close above Daily 50EMA
✅15' order block
✅Intraday breaks of structure
✅Tokyo ranges to be filled
🔑 Remember, to participate in trading comes always with a degree of risk, therefore as professional risk managers it remains vital that we stick to our risk management plan as well as our trading strategies.
📈The rest, we leave to the balance of probabilities.
💡Fail to plan. Plan to fail.
🏆It has always been that simple.
❤️Good luck with your trading journey, I shall see you at the very top.
🎯Trade consistent, FRGNT X

DAILY HOT PICK HTF 50 EMA'S -EURGBP SHORT FORECAST Q2 W23 D2 Y25🔥👀TECHNICAL HOT PICK OF THE DAY
EURGBP SHORT FORECAST Q2 W23 D2 Y25
Professional Risk Managers👋
Welcome back to another FRGNT chart update📈
Diving into some Forex setups using predominantly higher time frame order blocks alongside confirmation breaks of structure.
Let’s see what price action is telling us today!
💡Here are some trade confluences📝
✅Weekly order block
✅15' order block
✅HTF 50 EMA'S
✅Tokyo ranges to be filled
🔑 Remember, to participate in trading comes always with a degree of risk, therefore as professional risk managers it remains vital that we stick to our risk management plan as well as our trading strategies.
📈The rest, we leave to the balance of probabilities.
💡Fail to plan. Plan to fail.
🏆It has always been that simple.
❤️Good luck with your trading journey, I shall see you at the very top.
🎯Trade consistent, FRGNT X

HOT PICK ALONGSIDE HTF 50 EMA - SHORT FORECAST Q2 W22 D28 Y25 🔥👀TECHNICAL HOT PICK ALONGSIDE HTF 50 EMA
EURGBP SHORT FORECAST Q2 W22 D28 Y25
Professional Risk Managers👋
Welcome back to another FRGNT chart update📈
Diving into some Forex setups using predominantly higher time frame order blocks alongside confirmation breaks of structure.
Let’s see what price action is telling us today!
💡Here are some trade confluences📝
✅Weekly order block
✅15' order block
✅Intraday bearish breaks of structure
✅Tokyo ranges to be filled
🔑 Remember, to participate in trading comes always with a degree of risk, therefore as professional risk managers it remains vital that we stick to our risk management plan as well as our trading strategies.
📈The rest, we leave to the balance of probabilities.
💡Fail to plan. Plan to fail.
🏆It has always been that simple.
❤️Good luck with your trading journey, I shall see you at the very top.
🎯Trade consistent, FRGNT X

TECHNICAL HOT PICK - EURGBP SHORT FORECAST Q2 W22 D26 Y25🔥👀TECHNICAL HOT PICK
EURGBP SHORT FORECAST Q2 W22 D26 Y25
Professional Risk Managers👋
Welcome back to another FRGNT chart update📈
Diving into some Forex setups using predominantly higher time frame order blocks alongside confirmation breaks of structure.
Let’s see what price action is telling us today!
💡Here are some trade confluences📝
✅Weekly order block
✅15' order block
✅Intraday bearish breaks of structure
✅Tokyo ranges to be filled
🔑 Remember, to participate in trading comes always with a degree of risk, therefore as professional risk managers it remains vital that we stick to our risk management plan as well as our trading strategies.
📈The rest, we leave to the balance of probabilities.
💡Fail to plan. Plan to fail.
🏆It has always been that simple.
❤️Good luck with your trading journey, I shall see you at the very top.
🎯Trade consistent, FRGNT X

EUR/GBP "The Chunnel" Forex Bank Heist Plan (Scalping/Day Trade)🌟Hi! Hola! Ola! Bonjour! Hallo! Marhaba!🌟
Dear Money Makers & Robbers, 🤑💰✈️
Based on 🔥Thief Trading style technical and fundamental analysis🔥, here is our master plan to heist the EUR/GBP "The Chunnel" Forex Market. Please adhere to the strategy I've outlined in the chart, which emphasizes short entry. Our aim is the high-risk YELLOW MA Zone. It's a Risky level, oversold market, consolidation, trend reversal, trap at the level where traders and bullish robbers are stronger. 🏆💸"Take profit and treat yourself, traders. You deserve it!💪🏆🎉
Entry 📈 : "The vault is wide open! Swipe the Bearish loot at any price - the heist is on!
however I advise to Place sell limit orders within a 15 or 30 minute timeframe most nearest or swing, low or high level for Pullback Entries.
Stop Loss 🛑:
📌Thief SL placed at the nearest/swing High or Low level Using the 4H timeframe (0.85400) Day/Swing trade basis.
📌SL is based on your risk of the trade, lot size and how many multiple orders you have to take.
Target 🎯: 0.84000
💰💵💸EUR/GBP "The Chunnel" Forex Market Heist Plan (Scalping/Day Trade) is currently experiencing a Bearish trend.., driven by several key factors.👇👇👇
📰🗞️Get & Read the Fundamental, Macro, COT Report, Quantitative Analysis, Sentimental Outlook, Intermarket Analysis, Future trend targets and Overall outlook score..., go ahead to check 👉👉👉🔗🔗🌎🌏🗺
⚠️Trading Alert : News Releases and Position Management 📰 🗞️ 🚫🚏
As a reminder, news releases can have a significant impact on market prices and volatility. To minimize potential losses and protect your running positions,
we recommend the following:
Avoid taking new trades during news releases
Use trailing stop-loss orders to protect your running positions and lock in profits
💖Supporting our robbery plan 💥Hit the Boost Button💥 will enable us to effortlessly make and steal money 💰💵. Boost the strength of our robbery team. Every day in this market make money with ease by using the Thief Trading Style.🏆💪🤝❤️🎉🚀
I'll see you soon with another heist plan, so stay tuned 🤑🐱👤🤗🤩

EUR/GBP - Blue Box is Strong SupportIn our recent EUR / GBP analysis we observed a substantial 226‑pip decline from the peak.() Price has now settled into the blue‑boxed support area, a level at which previous pullbacks found buyers and genuine value emerged.
It follows, then, that if price can break above the nearby red‑boxed resistance on lower‑time‑frame charts, with clear follow‑through rather than a fleeting spike, a long position would be entirely reasonable. Such a breakout would signal that demand has overcome supply pressure, restoring the upward trend in a disciplined, verifiable way.
Throughout our work, we have never relied on guesswork or emotion. Every level is chosen through careful study of price behavior and hard data, and our methodology has consistently delivered high accuracy as a result. In the spirit of prudent analysis, we ask only for confirmation of these key levels before committing capital, an approach that has served us well and should serve our followers equally.
📌I keep my charts clean and simple because I believe clarity leads to better decisions.
📌My approach is built on years of experience and a solid track record. I don’t claim to know it all but I’m confident in my ability to spot high-probability setups.
📌If you would like to learn how to use the heatmap, cumulative volume delta and volume footprint techniques that I use below to determine very accurate demand regions, you can send me a private message. I help anyone who wants it completely free of charge.
🔑I have a long list of my proven technique below:
🎯 ZENUSDT.P: Patience & Profitability | %230 Reaction from the Sniper Entry
🐶 DOGEUSDT.P: Next Move
🎨 RENDERUSDT.P: Opportunity of the Month
💎 ETHUSDT.P: Where to Retrace
🟢 BNBUSDT.P: Potential Surge
📊 BTC Dominance: Reaction Zone
🌊 WAVESUSDT.P: Demand Zone Potential
🟣 UNIUSDT.P: Long-Term Trade
🔵 XRPUSDT.P: Entry Zones
🔗 LINKUSDT.P: Follow The River
📈 BTCUSDT.P: Two Key Demand Zones
🟩 POLUSDT: Bullish Momentum
🌟 PENDLEUSDT.P: Where Opportunity Meets Precision
🔥 BTCUSDT.P: Liquidation of Highly Leveraged Longs
🌊 SOLUSDT.P: SOL's Dip - Your Opportunity
🐸 1000PEPEUSDT.P: Prime Bounce Zone Unlocked
🚀 ETHUSDT.P: Set to Explode - Don't Miss This Game Changer
🤖 IQUSDT: Smart Plan
⚡️ PONDUSDT: A Trade Not Taken Is Better Than a Losing One
💼 STMXUSDT: 2 Buying Areas
🐢 TURBOUSDT: Buy Zones and Buyer Presence
🌍 ICPUSDT.P: Massive Upside Potential | Check the Trade Update For Seeing Results
🟠 IDEXUSDT: Spot Buy Area | %26 Profit if You Trade with MSB
📌 USUALUSDT: Buyers Are Active + %70 Profit in Total
🌟 FORTHUSDT: Sniper Entry +%26 Reaction
🐳 QKCUSDT: Sniper Entry +%57 Reaction
📊 BTC.D: Retest of Key Area Highly Likely
📊 XNOUSDT %80 Reaction with a Simple Blue Box!
📊 BELUSDT Amazing %120 Reaction!
📊 Simple Red Box, Extraordinary Results
I stopped adding to the list because it's kinda tiring to add 5-10 charts in every move but you can check my profile and see that it goes on..

OK, LONG TERM BULLISH, BUT BUT BUT, LET COLLECT SOME MONEY!EURGBP SHORT FORECAST Q2 W21 Y25
OK, LONG TERM BULLISH, BUT BUT BUT, LET COLLECT SOME MONEY BEFORE THE LONG MOVE! ITS THERE FOR THE TAKING !!!!!!!
Professional Risk Managers👋
Welcome back to another FRGNT chart update📈
Diving into some Forex setups using predominantly higher time frame order blocks alongside confirmation breaks of structure.
Let’s see what price action is telling us today!
💡Here are some trade confluences📝
✅Weekly order block
✅15' order block
✅Intraday bearish breaks of structure
✅Tokyo ranges to be filled
🔑 Remember, to participate in trading comes always with a degree of risk, therefore as professional risk managers it remains vital that we stick to our risk management plan as well as our trading strategies.
📈The rest, we leave to the balance of probabilities.
💡Fail to plan. Plan to fail.
🏆It has always been that simple.
❤️Good luck with your trading journey, I shall see you at the very top.
🎯Trade consistent, FRGNT X

EUR/GBP Caper: Bearish Breakout Blueprint!🌍 Greetings, global money heisters! 🌟 Welcome to the EUR/GBP "Chunnel" Forex Market caper! 🤑💸
Dear traders and fortune chasers, get ready to execute our cunning plan based on the 🔥 Thief Trading Style 🔥, blending sharp technicals with savvy fundamentals. Our mission? A slick short entry targeting the high-risk Support Zone. The market’s oversold, consolidation’s brewing, and a trend reversal’s lurking—perfect for our ambush! 🏆🎯 Here’s the blueprint to steal those pips! 🚀
Entry 📈: The heist kicks off at the Major Support breakout. Lock in your sell at 0.84000 for bearish gains! 💰 For precision, set sell stop orders above the Moving Average or sell limit orders post-breakout within a 15/30-minute window near the swing low/high for pullback entries. 📌 Pro tip: Set a chart alert 🚨 to catch the breakout moment!
Stop Loss 🛑: Stay sharp, crew! For sell stop orders, hold off on placing your stop loss until the breakout confirms. 📍 Place it at the nearest swing high/low on the 4H timeframe (0.84400) for swing/day trades. Adjust based on your risk, lot size, and multiple orders. Play smart—your capital, your rules! ⚠️🔥
Target 🎯: Aim for 0.83500 or slip out early if the market whispers an escape. 🏃♂️💨
💵 Why’s the Chunnel ripe for the taking? The EUR/GBP’s in a bearish groove, driven by key market signals. Curious? Dive into the fundamentals, COT reports, sentiment, and intermarket analysis for the full scoop! 🌎🔗 Check linkk macro trends and future targets & overall score. 📊
⚠️ Trading Alert: News can shake the market like a getaway car! 📰🚗 Avoid new trades during high-impact releases and use trailing stops to lock in profits and shield your positions. Safety first, heisters! 🚫🔐
💖 Boost our heist! Hit that Boost Button 🚀 to fuel our Thief Trading crew. With daily market raids, we’re stacking pips and living the trader’s dream! 🤑🤝 Stay tuned for the next caper—more profits await! 🐱👤🎉
Happy heisting, and let’s make those charts bleed green! 💪🌟

Market Analysis: EUR/GBP Loses GroundMarket Analysis: EUR/GBP Loses Ground
EUR/GBP declined steadily below the 0.8460 and 0.8440 support levels.
Important Takeaways for EUR/GBP Analysis Today
- EUR/GBP is trading in a bearish zone below the 0.8460 pivot level.
- There was a break above a connecting bearish trend line with resistance near 0.8410 on the hourly chart at FXOpen.
EUR/GBP Technical Analysis
On the hourly chart of EUR/GBP at FXOpen, the pair started a fresh decline from well above 0.8500. The Euro traded below the 0.8430 level and tested 0.8400. It is now consolidating losses and trading below the 50-hour simple moving average. However, there was a break above a connecting bearish trend line with resistance near 0.8410.
The pair is now facing resistance near the 23.6% Fib retracement level of the downward move from the 0.8522 swing high to the 0.8399 low at 0.8430.
The next major resistance could be 0.8460. It coincides with the 50% Fib retracement level of the downward move from the 0.8522 swing high to the 0.8399 low. The main resistance is near the 0.8495 zone. A close above the 0.8495 level might accelerate gains. In the stated case, the bulls may perhaps aim for a test of 0.8520. Any more gains might send the pair toward the 0.8550 level.
Immediate support sits near 0.8400. The next major support is near 0.8365. A downside break below the 0.8365 support might call for more downsides. In the stated case, the pair could drop toward the 0.8300 support level.
This article represents the opinion of the Companies operating under the FXOpen brand only. It is not to be construed as an offer, solicitation, or recommendation with respect to products and services provided by the Companies operating under the FXOpen brand, nor is it to be considered financial advice.

EURGBP SHORT FORECAST Q2 W20 D13 Y25EURGBP SHORT FORECAST Q2 W20 D13 Y25
Professional Risk Managers👋
Welcome back to another FRGNT chart update📈
Diving into some Forex setups using predominantly higher time frame order blocks alongside confirmation breaks of structure.
Let’s see what price action is telling us today!
💡Here are some trade confluences📝
✅Weekly order block
✅15' order block
✅Intraday bearish breaks of structure
✅Tokyo ranges to be filled
🔑 Remember, to participate in trading comes always with a degree of risk, therefore as professional risk managers it remains vital that we stick to our risk management plan as well as our trading strategies.
📈The rest, we leave to the balance of probabilities.
💡Fail to plan. Plan to fail.
🏆It has always been that simple.
❤️Good luck with your trading journey, I shall see you at the very top.
🎯Trade consistent, FRGNT X

EURGBP SHORT FORECAST Q2 W20 D12 Y25EURGBP SHORT FORECAST Q2 W20 D12 Y25
Professional Risk Managers👋
Welcome back to another FRGNT chart update📈
Diving into some Forex setups using predominantly higher time frame order blocks alongside confirmation breaks of structure.
Let’s see what price action is telling us today!
💡Here are some trade confluences📝
✅Weekly order block
✅15' order block
✅Intraday bearish breaks of structure
✅Tokyo ranges to be filled
🔑 Remember, to participate in trading comes always with a degree of risk, therefore as professional risk managers it remains vital that we stick to our risk management plan as well as our trading strategies.
📈The rest, we leave to the balance of probabilities.
💡Fail to plan. Plan to fail.
🏆It has always been that simple.
❤️Good luck with your trading journey, I shall see you at the very top.
🎯Trade consistent, FRGNT X
