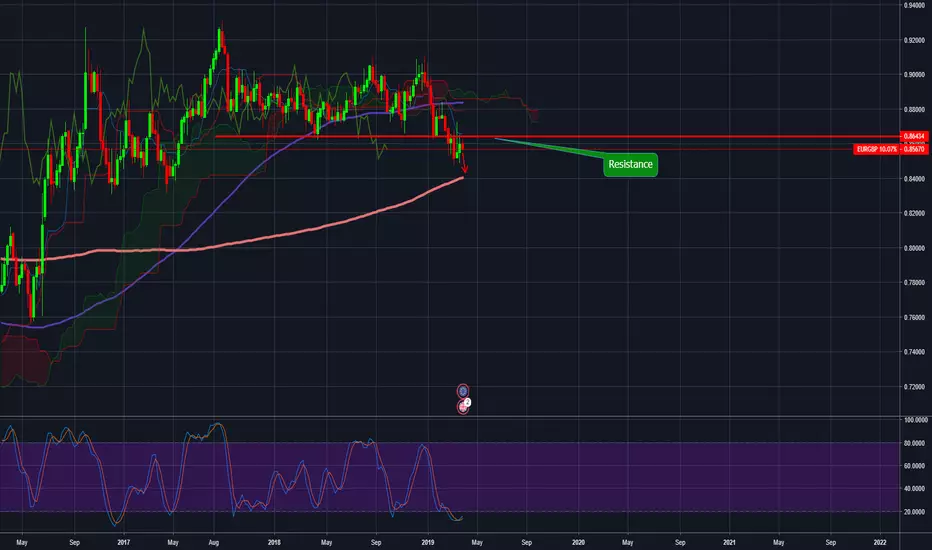
EURGBP Approaching Resistance: POTENTIAL SELLEURGBP is approaching horizontal resistance at 0.8675-0.8700. Besides, the 100D EMA at 0.8678 can also prove to be a strong hurdle.
So, traders can look for SELL at 0.8670-0.8710 with SL above 0.8740.
TPs can be set at 0.8500.
Eurgbptrend

Brexit more like brex#hitPrice is currently in consolidation ( moving sideward ) and is 40ish pips off our resistance zone, we think price will make a bullish run upto this zone and then bounce making bearish movement all the way down to our support zone.
Now we don't have an high impact news releases this week involving this pairing, but as we know around brexit anything can happen and GBP pairings can be very volatile, so please trade with caution and correct risk management.
Do you think the UK will ever leave Europe? Or was it all a scam to make the people of the UK feel like they had a choice with what went on in the country when really it was never an option to leave?

#EURGBP Analysis+signalThe line of resistance in the weekly chart above is a line that once supported and turned into resistance, as long as the price of the eurgbp does not break this resistance and we are relatively close to the resistance price, our signal will be a sell signal
Sell EURGBP:
Entry Price:0.8568
Take Profit:0.84
Stop Loss: 0.8645
EURGBP Trend Reversal PossibleEURGBP has been in tight range of 0.86500 and 0.84700 since 15 days. Price has created good support at this level which is important trendline support.Price is also near to 200EMA support which increase the probability of bullishness. I will wait for retracement after breakout of 0.86500....Will eneter the position at 0.86700 levels with the stoploss of 0.85400 for the target of 0.88000-0.89000.

EUR/GBP: Buy Sell Trade Setup !!BUY & SELL Above Given Chart or
You Can Also set Own Risk reward.
Let see what Will be Next Move.
Warning- I m Not a Financial Advisor this idea Only For Educational Purpose Only.
Thank You !!


#EURGBP Analysis+SignalOur recommendation is a sell recommendation for several reasons:
The eurgbp is currently in front of resistance (Support turned into resistance) And this is the third time he has tried to break and is not succeeding
And the other reasons, in short, are the downward trend, The Ichimoku indicator that all parameters indicate continued declines
Sell EURGBP:
Entry Price: 0.8634
Stop Loss: 0.8675
Take Profit:0.8510


EURGBP BUY ON 1HAnticipating a breakout upwards after price closed above trend line confirming continuing uptrend

#EURGBP An even bigger fall in the road?From 8 October we entered into Rang prices with support at 0.8650 and resistance at 0.9075, The break came last week with the candle falling to 0.8525 since the price has returned to a little higher but support has broken it- is a sign for us to enter into a sell position! There are sometimes false alarms so please do not gamble with everything.
Sell EUR/GBP:
Entry Price: 0.8618
Stop loss: 0.8670
Take Profit: 0.8380


EUR/GBP: BUY For Longer Terms After Breakout !!BUY & SELL Above Given Chart or
You Can Also set Own Risk reward.
Let see what Will be Next Move.
Warning- I m Not a Financial Advisor this idea Only For Educational Purpose Only.
Thank You !!

Elliott Wave View: Downside Pressure in EURGBPEURGBP shows a sequence of lower low from August 29, 2017 high, suggesting further downside is likely. The bounce to 0.9105 on January 3, 2019 high ended wave (2). From there, pair declines as a double three Elliott Wave structure where wave W ended at 0.8615 and wave X ended at 0.884. Pair broke below wave W at 0.8615 and confirmed that the next leg lower in wave Y has started.
From 0.88407 peak the market is currently unfolding as an Elliott Wave Zig Zag structure. Which ended wave (a) at 0.8665 low. Above, from there it ended wave (b) bounce at 0.8730. Below from there we expect it to extend into the blue box area of 0.8552-0.8510, which is the equal legs of wave (a)-(b). Where we expect wave ((w)) to end. Afterwards we expect a bounce in wave ((x)) to occur. As long as the market stays below 0.88407 peak we expect it to extend lower.

EUR/GBP (IS THE BOTTOM IN?) DAILY CHARTEUR/GBP approaching a very well respected level of support on the Daily time frame.
Looks to me like the bottom is in, LONG on this trade.
Thanks for checking out my idea, let me know what you think?

EURGBP Analysis+SignalWe added the Fibonacci Retracement to the graph after a relatively large drop or rise it helps to analyze, So last week the euro rallied against the pound and started to rise even crossed the 23.6 Fibonacci line and then stopped right in the 38.2 area and fell back to 23.6, We believe that the price will stabilize and gradually return to the 38.2 Fibonacci and possibly cross it.
Be careful with the Doji Candlestick created during the weekly time period (This can indicate the sellers' victory in this war)
Buy EUR/GBP
Entry Price:0.8759
Stop Loss:0.8720
Take Profit:0.8810

EURGBP SHORTHigher timeframe its a correction after the impulse. but on the H1 we can get a channel from this correction. A break of this channel we can get a downwards movement to previous support. Enter after a bearish close breaking the channel or an retest of breakout.

EG..... Dont let it leave you with EGg on your face :p We will keep this 1 short and sweet.... We are short to our trendline then long for that..... is that simple enough for you? Got that... or do you need us to wipe your arse as well? ;p


EURGBP - BULLS PULLING UPI CAN SEE THIS MAKING MORE MOVE
UP TO AROUND 0.87983 OR FURTHER
UP TO AROUND THE 0.88543 (50% FIB RETRACEMENT)

EURGBPPrice Breakout, retest of support we can long up to next resistance if we get a double buttom or a bullish engulfing also will confirm the upward move.

EURGBP BUY THE BREKOUTEURGBP has hit its previous April 2018 low.
i am expecting a horizontal pullback where it
could potentially reverse to its support at
around 0.87657
EMA 200 & EMA 21 are both in the sell zone so
WATCH OUT.
Watch out for the break in the RED trend line
as this could leads us back to
its support of 0.87657
See previous analysis
PLEASE SUPPORT THE MOVEMENT WITH YOUR
LIKES, COMMENTS AND FOLLOW FOR MORE

EUR/GBP : Strong BUY Setup !!BUY & SELL Above Given Chart or
You Can Also set Own Risk reward.
Let see what Will be Next Move.
Warning- I m Not a Financial Advisor this idea Only For Educational Purpose Only.
Thank You !!
