DeGRAM | EURJPY is moving in an ascending channel📊 Technical Analysis
● Price is climbing within a rising channel after confirming a breakout retest at 172.10, turning former resistance into support.
● Structure favors continuation toward 172.90 and channel top at 173.90, with minor pullbacks likely staying above the breakout base.
💡 Fundamental Analysis
● Improved eurozone PMI data and firm ECB stance reinforce euro strength, while BoJ’s unchanged ultra-loose policy keeps the yen under pressure.
✨ Summary
Long above 172.10; targets 172.90 → 173.90. Invalidation below 172.00.
-------------------
Share your opinion in the comments, and support the idea with a like. Thanks for your support!
Eurjpy!

EURJPY Is Very Bearish! Short!
Here is our detailed technical review for EURJPY.
Time Frame: 1D
Current Trend: Bearish
Sentiment: Overbought (based on 7-period RSI)
Forecast: Bearish
The market is on a crucial zone of supply 172.334.
The above-mentioned technicals clearly indicate the dominance of sellers on the market. I recommend shorting the instrument, aiming at 169.030 level.
P.S
We determine oversold/overbought condition with RSI indicator.
When it drops below 30 - the market is considered to be oversold.
When it bounces above 70 - the market is considered to be overbought.
Disclosure: I am part of Trade Nation's Influencer program and receive a monthly fee for using their TradingView charts in my analysis.
Like and subscribe and comment my ideas if you enjoy them!

DeGRAM | EURJPY exited from the channel📊 Technical Analysis
● EURJPY broke above the descending channel’s resistance line near 171.38, holding within an ascending wedge that favors bullish continuation.
● A sustained move above 172.17 opens the way toward 173.06, with intraday pullbacks likely retesting the breakout area for support.
💡 Fundamental Analysis
● The euro gained as ECB officials signaled no immediate rate cuts, while the yen remains pressured by Bank of Japan’s commitment to ultra-loose policy despite rising inflation expectations.
✨ Summary
Buy above 171.38; target 173.06. Setup remains valid while price stays above 171.00.
-------------------
Share your opinion in the comments, and support the idea with a like. Thanks for your support!


EURJPY Buyers In Panic! SELL!
My dear subscribers,
EURJPY looks like it will make a good move, and here are the details:
The market is trading on 172.25 pivot level.
Bias - Bearish
Technical Indicators: Both Super Trend & Pivot HL indicate a highly probable Bearish continuation.
Target - 171.49
About Used Indicators:
The average true range (ATR) plays an important role in 'Supertrend' as the indicator uses ATR to calculate its value. The ATR indicator signals the degree of price volatility.
Disclosure: I am part of Trade Nation's Influencer program and receive a monthly fee for using their TradingView charts in my analysis.
———————————
WISH YOU ALL LUCK

EURYEN EURJPY BUYSEurjpy keeping it simple and straightforward will be buying easily and will be closing partials

EURJPY PROFIT Eurjpy hit take profit and will keep trading and scalping it whether it gives good opportunities
EURJPY PROFIT Eurjpy performed well and has mashed all take profits and unlocked a new price level will be looking to hold a bit more longer

EUR/JPY - target almost reached at 174.46 - But is it worth it?W Formation formed tick.
Price>20 and 200 - Tick
Target 174.46
Stop loss - not hit - TICK
All easy and said and done.
BUt the analysis was done in April. It is August.
We take on daily interest charges.
Opportunity costs.
So are these LONG term trades good in the long run? Maybe with LARGE portfolios then it's all relative and the costs are the price to pay.
But for smaller portfolios that most people have - it's not worth it.
Prioritise with your trading risk management and profile. And if need be, implement a TIME STOP LOSS to avoid long winded holding trades that turn into unnecessary marriages.
Disclosure: I am part of Trade Nation's Influencer program and receive a monthly fee for using their TradingView charts in my analysis.


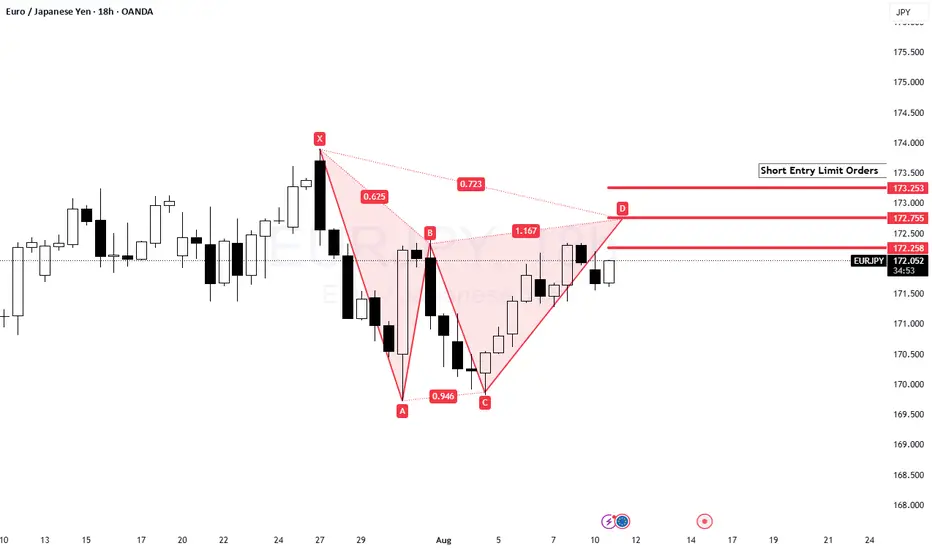
EUR/JPY Bearish BatA Bearish Bat is forming on the EUR/JPY custom timeframe chart (18hr). I'm expecting price to push through 172.00 and possibly through 173.00 before reversing. I've put in a few limit orders. If price sharply reverses I'm just going to short the market.
EUR/JPY BEARS WILL DOMINATE THE MARKET|SHORT
EUR/JPY SIGNAL
Trade Direction: short
Entry Level: 172.040
Target Level: 170.885
Stop Loss: 172.804
RISK PROFILE
Risk level: medium
Suggested risk: 1%
Timeframe: 9h
Disclosure: I am part of Trade Nation's Influencer program and receive a monthly fee for using their TradingView charts in my analysis.
✅LIKE AND COMMENT MY IDEAS✅

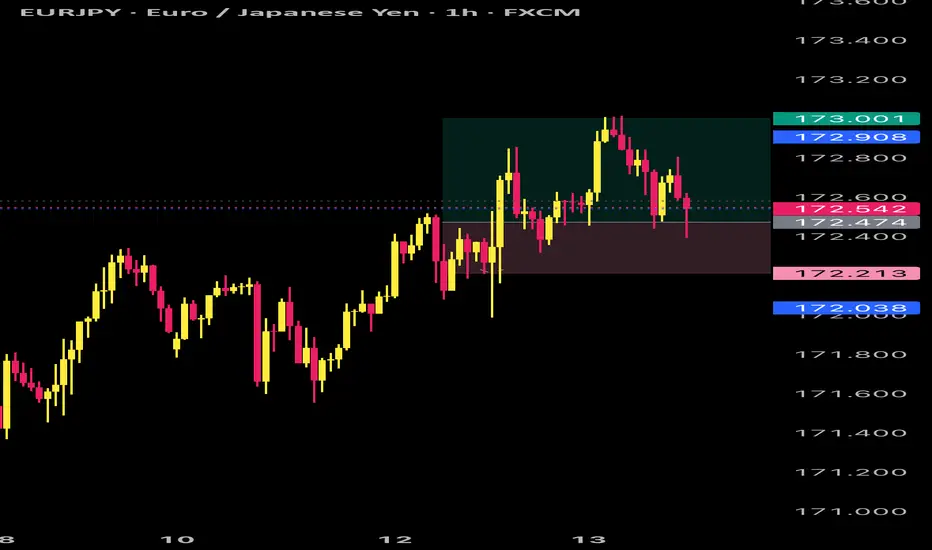
EURJPY – Bearish Reversal Looming from Key Resistance ZoneAfter a strong recovery rally, EURJPY has once again hit the 172.30 resistance zone a level that has repeatedly acted as a ceiling for price action. This latest retest comes with signs of momentum fading, and I’m eyeing a potential reversal that could send the pair back toward key support zones. With broader yen strength creeping in on safe-haven flows and the euro’s upside capped by a cautious ECB, this setup is looking primed for sellers to step in.
Current Bias
Bearish – The pair is struggling to break and hold above the 172.30 resistance zone. Price action is showing rejection wicks on the H4 chart, indicating potential distribution before a move lower.
Key Fundamental Drivers
Euro Side: The ECB remains cautious on further tightening, with growth concerns in the eurozone limiting the upside for EUR. Recent industrial production softness and muted inflation expectations cap bullish momentum.
Yen Side: The BoJ’s shift toward a slightly less accommodative stance, combined with safe-haven demand amid global trade tensions and Trump’s tariff rhetoric, supports JPY strength.
Risk Sentiment: Ongoing uncertainty around global growth and trade flows benefits JPY as a defensive asset, putting downside pressure on EURJPY.
Primary Risk to the Trend
A surprise hawkish tilt from the ECB or strong eurozone economic data could fuel renewed buying pressure, forcing a breakout above 172.98.
A sudden drop in risk-off sentiment or a rebound in global equities could weaken JPY demand and negate the bearish bias.
Most Critical Upcoming News/Event
Eurozone GDP and Industrial Production data – Any significant beat could temporarily lift EUR.
Japan CPI and BoJ commentary – Inflation beats or hawkish language could accelerate JPY gains.
Geopolitical headlines – Trade tensions between the US and China remain a key driver for yen demand.
Leader/Lagger Dynamics
EURJPY is acting as a lagger in the current yen move, with USDJPY leading the direction for JPY crosses. Any decisive move in USDJPY—especially a break lower—would likely spill over into EURJPY. The pair also tends to mirror risk sentiment shifts seen in equity indices like US500, making global sentiment a secondary driver.
Summary: Bias and Watchpoints
I’m maintaining a bearish bias on EURJPY as long as price stays below the 172.30 resistance zone. My stop-loss is placed just above the 172.98 swing high to protect against a bullish breakout. First targets sit at 171.43, then 170.65, with an extended downside target near 169.73 if momentum builds. A clean break below 170.65 would open the path for deeper declines, while any sustained break above 172.98 would invalidate this setup. In short, I’m watching for rejection confirmation from resistance and will be tracking USDJPY closely as the leader for yen sentiment.

EURJPY 4Hour TF - August 10th, 2025🟦 EURJPY 4H Analysis
📅 August 10, 2025
Top-Down Trend Bias:
• Monthly – Bullish
• Weekly – Bullish
• Daily – Bullish
• 4H – Bearish
EURJPY is approaching the 172.25 resistance zone after a strong bullish correction. While higher timeframes remain bullish, the 4H structure is still technically in a retracement phase, making this a critical reaction level.
🔍 Key Zone: 172.50
This area marks prior structure and could serve as either a breakout base for further upside or a strong rejection point for sellers.
✅ Scenario A: Bullish Breakout (Orange Path)
1.If price breaks and closes above 172.50
2.Expect continuation toward 173.75 resistance zone
This would align with the overall bullish HTF bias
⚠️ Scenario B: Bearish Rejection (Blue Path)
1.If price rejects from 172.250
2.Look for bearish confirmation (rejection wicks, engulfing, LTF BOS)
Target 1: 171.00
Target 2: 169.60 support
This would maintain the short term 4H bearish structure while still sitting inside a bullish macro trend.
🧠 Final Notes
• 172.250 is the key decision point, watch for clear confirmation
• HTFs favor upside, but short term traders may find better R:R on a rejection
• Always trade the reaction, not the assumption

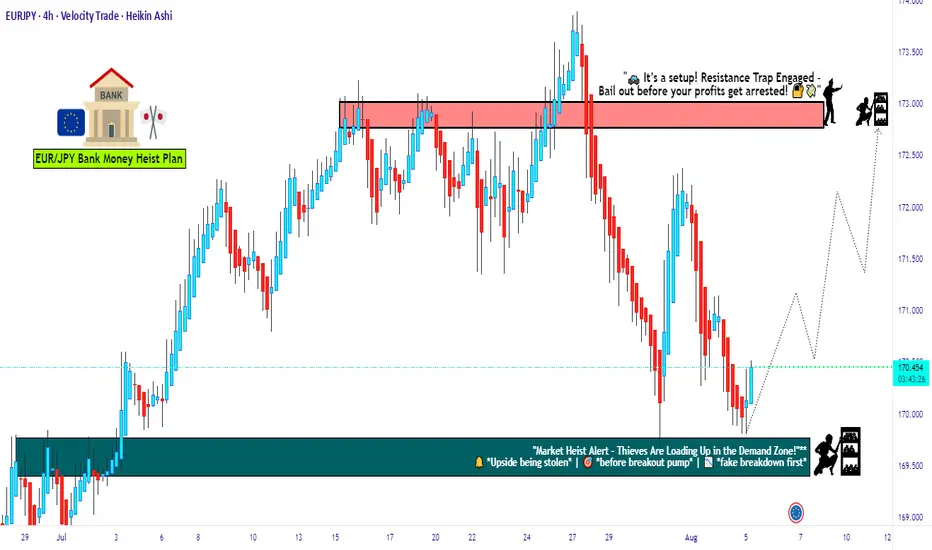
EUR/JPY Setup: Thief Trader's Stealth Bull Run to 173.000🔥💶 EUR/JPY Bullish Heist Plan 💶🔥
🧠 New Plan Unlocked – The EUR/JPY Bullish Mission is LIVE!
Thief Trader style means: No noise, no fluff — just pure sniper precision with layered limit orders. 🧤🔫
This isn’t trading… it’s a planned market robbery 💼💣
🧩 Asset: EUR/JPY
📊 Strategy: Bullish Bias with Stealth Layered Entries (Limit Order Gameplan)
🎯 Target: 173.000 — That’s the vault we’re cracking!
🛑 Stop Loss: 169.100 — Tight security, keep your escape route clean.
📍 Entry: No fixed door — we’re setting traps (limit orders) across key levels. Patience pays thieves.
Watch for pullbacks on lower timeframes: 15m, 30m, or even 1H — strike near support bounces & fakeout wicks. 🐍💥
🔍 Thief Logic:
This ain’t random — price is setting up for a high-stakes move north with JPY weakness fueling the getaway car.
Think smart, layer deep — sniper entries, not shotgun chaos. 🎯🔍
📌 Notes from the Safe House:
Trade with position sizing discipline – the market doesn’t owe you.
News events are motion sensors — avoid them or stay light! 🕵️♂️📉
Use trailing SLs once in profit — secure the bag and vanish. 💼💨
💣 Ready to steal pips, not hope? Hit that 👍, drop a 💬, and join the crew.
This is Thief Trading — we don’t follow markets, we outsmart them. 🧠💵
Stay sharp, stay silent… profit loud. 🐱👤📈💸
🔥 Tap Boost. Support the Heist. Run the Charts. #ThiefTrader 🧤💰
EUR_JPY PULLBACK AHEAD|SHORT|
✅EUR_JPY price went up sharply
But a strong resistance level was hit at 172.400
Thus, as a pullback is already happening
And a move down towards the target of 171.853 shall follow
SHORT🔥
✅Like and subscribe to never miss a new idea!✅

EURJPY Long on EURJPY for next week as the price is short-term bearish. Don't try to call the highs or you will be down bad

EURJPY Will Go Lower From Resistance! Sell!
Here is our detailed technical review for EURJPY.
Time Frame: 2h
Current Trend: Bearish
Sentiment: Overbought (based on 7-period RSI)
Forecast: Bearish
The market is on a crucial zone of supply 172.145.
The above-mentioned technicals clearly indicate the dominance of sellers on the market. I recommend shorting the instrument, aiming at 171.318 level.
P.S
We determine oversold/overbought condition with RSI indicator.
When it drops below 30 - the market is considered to be oversold.
When it bounces above 70 - the market is considered to be overbought.
Disclosure: I am part of Trade Nation's Influencer program and receive a monthly fee for using their TradingView charts in my analysis.
Like and subscribe and comment my ideas if you enjoy them!

EURJPY BUYS BLUEThis pair has responded positively to the analysis of the recent post and it has now hit take profit perfectly with minimum drawdown


Possible Short Position Levels for EURJPYThe trade plan is as follows:
Action: Entering a short position, betting on the price to fall.
Entry: 171.886, anticipating a pullback to a previously broken support level.
Stop Loss: Placed at 172.406 to limit losses if the price unexpectedly rises and breaks the recent high.
Targets: Two take-profit levels are identified to secure profits as the price declines.
TP1: 170.780 (a recent support level).
TP2: 169.720 (a major previous low).
The setup is considered favorable because the potential profit is significantly larger than the potential risk.
Disclaimer
This analysis is for educational and informational purposes only and does not constitute financial advice. The provided trade idea is based on technical analysis and historical price action, and past performance is not indicative of future results. Trading foreign exchange on margin carries a high level of risk and may not be suitable for all investors. Before deciding to trade, you should carefully consider your investment objectives, level of experience, and risk appetite. You could lose some or all of your initial investment. Seek advice from an independent financial advisor if you have any doubts. Any action you take upon the information on this chart and analysis is strictly at your own risk.

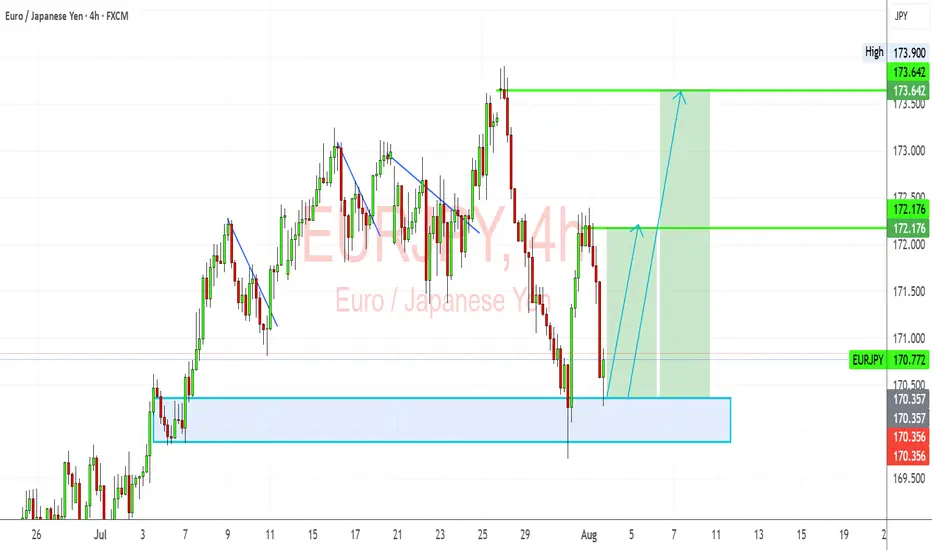
EURJPY: Bullish Rebound from Key Demand ZoneEURJPY has bounced off a critical demand zone and is showing signs of a bullish recovery. Despite the recent pullback, the pair’s structure remains fundamentally and technically bullish, driven by JPY weakness and EUR resilience.
Technical Analysis (4H Chart)
Pattern: Price tested a strong demand zone near 170.35–170.50 and rejected it aggressively.
Current Level: 170.77, starting a potential bullish leg toward higher resistance levels.
Key Support Levels:
170.35 – key demand zone and invalidation level for bulls.
169.90 – deeper support if demand zone breaks.
Resistance Levels:
172.17 – first bullish target and interim resistance.
173.64 – major target if bullish continuation sustains.
Projection: A successful rebound from 170.35 could drive price toward 172.17 initially, then 173.64 if momentum holds.
Fundamental Analysis
Bias: Bullish.
Key Fundamentals:
EUR: ECB’s slower path toward easing supports EUR stability relative to JPY.
JPY: Weakness persists as BoJ maintains dovish bias, though FX intervention risk limits JPY downside speed.
Global Sentiment: Mild risk-on mood supports EUR strength against JPY.
Risks:
BoJ verbal intervention or actual FX intervention could trigger temporary JPY strength.
Sharp reversal in global risk sentiment could weaken EUR/JPY.
Key Events:
ECB speeches and data (CPI, growth updates).
BoJ FX comments and broader market risk appetite.
Leader/Lagger Dynamics
EUR/JPY is a leader among JPY pairs, often moving in sync with GBP/JPY and CHF/JPY. Its movement also tends to precede confirmation in risk-sensitive JPY crosses.
Summary: Bias and Watchpoints
EUR/JPY is bullish from the 170.35 demand zone, with a potential move toward 172.17 and 173.64. Key watchpoints include ECB communication, BoJ stance, and market risk sentiment. As long as 170.35 holds, bulls remain in control.
EURJPY: Market Sentiment & Forecast
The recent price action on the EURJPY pair was keeping me on the fence, however, my bias is slowly but surely changing into the bearish one and I think we will see the price go down.
Disclosure: I am part of Trade Nation's Influencer program and receive a monthly fee for using their TradingView charts in my analysis.
❤️ Please, support our work with like & comment! ❤️
