EUR/JPY Hits 12-Month HighEUR/JPY Hits 12-Month High
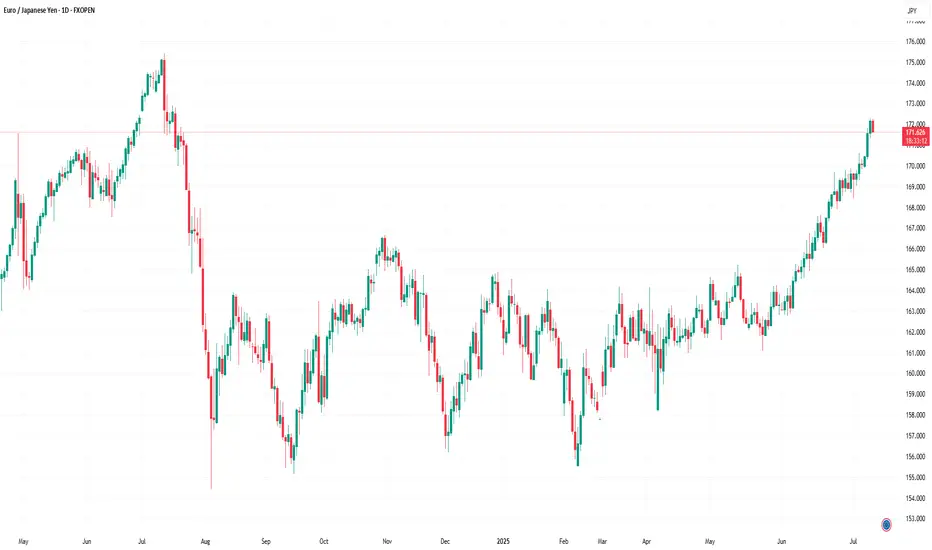
As the chart indicates, the EUR/JPY pair has risen above ¥172 per euro — a level last seen in July 2024.
Since early June, the exchange rate has increased by approximately 5.6%. This upward movement is driven by a combination of factors, including:
→ Divergence in central bank policy: The European Central Bank’s key interest rate remains significantly higher than that of the Bank of Japan, making the euro more attractive in terms of yield compared to the yen.
→ US trade tariffs on Japan: The potential imposition of 25% tariffs by the United States on Japanese goods poses a threat to Japan’s export-driven economy, placing downward pressure on the national currency.
→ Eurozone expansion and consolidation: News of Bulgaria’s potential accession to the euro area is strengthening investor confidence in the single currency.
→ Weakness in the US dollar: As the US Dollar Index fell to its lowest level since early 2022 this July, demand for the euro has grown, positioning it as a key alternative reserve currency.
Can the rally continue?
Technical Analysis of EUR/JPY
For several months, the pair traded within a range of approximately ¥156–165 per euro, but has recently broken above the upper boundary of this channel. Based on technical analysis, the width of the previous range implies a potential price target in the region of ¥174 per euro.
It is noteworthy that the rally gained momentum (as indicated by the arrow) following the breakout above the psychological threshold of 170, a sign of bullish market dominance. At the same time, the RSI has surged to a multi-month high, signalling moderate overbought conditions.
Under these circumstances, the market may be vulnerable to a short-term correction, potentially:
→ Towards the lower boundary of the ascending channel (shown in orange);
→ To retest the psychological support around ¥170.
That said, a reversal of the prevailing trend would likely require a significant shift in the fundamental backdrop — for example, progress towards a trade agreement between Japan and the United States.
This article represents the opinion of the Companies operating under the FXOpen brand only. It is not to be construed as an offer, solicitation, or recommendation with respect to products and services provided by the Companies operating under the FXOpen brand, nor is it to be considered financial advice.
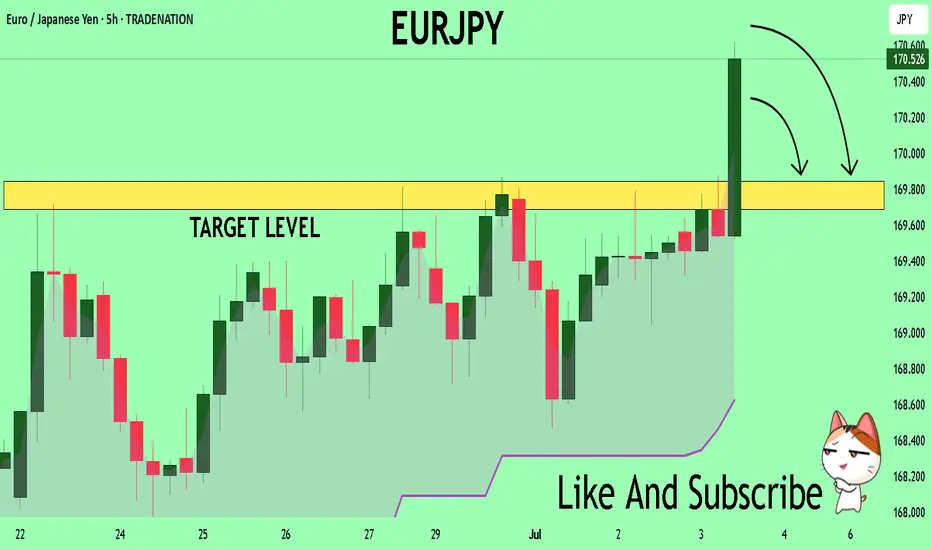
Eurjpy!
EURJPY Bullish Breakout!
HI,Traders !
#EURJPY is trading in an
Uptrend an the pair made a
Bullish breakout of the key
Horizontal level of 169.790
Which is confirmed so after
pullback we will
Be expecting a further
Bullish continuation !
Comment and subscribe to help us grow !

EURJPY Will Go Lower! Sell!
Please, check our technical outlook for EURJPY.
Time Frame: 9h
Current Trend: Bearish
Sentiment: Overbought (based on 7-period RSI)
Forecast: Bearish
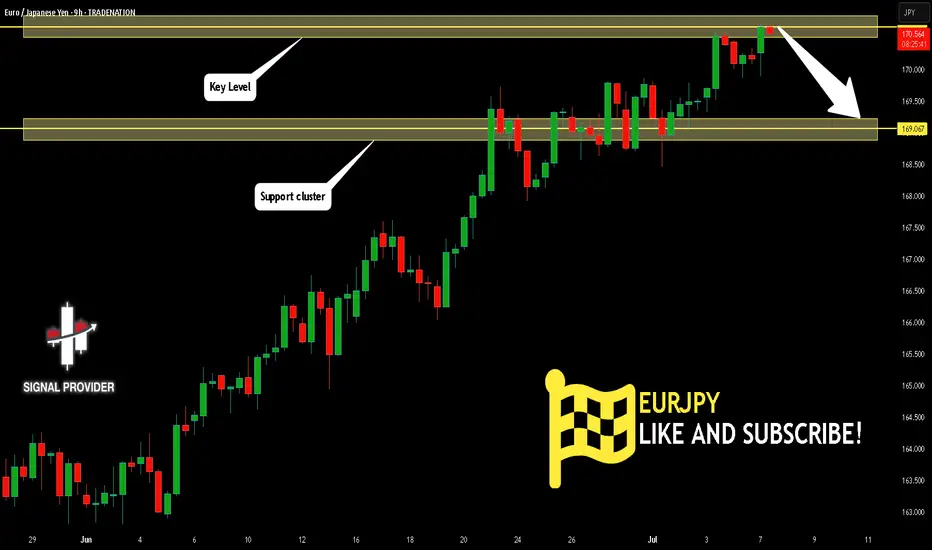
The price is testing a key resistance 170.636.
Taking into consideration the current market trend & overbought RSI, chances will be high to see a bearish movement to the downside at least to 169.067 level.
P.S
We determine oversold/overbought condition with RSI indicator.
When it drops below 30 - the market is considered to be oversold.
When it bounces above 70 - the market is considered to be overbought.
Disclosure: I am part of Trade Nation's Influencer program and receive a monthly fee for using their TradingView charts in my analysis.
Like and subscribe and comment my ideas if you enjoy them!
EURJPY: Trading Above Major QP 170. Strong Bullish Trend EJ broke above the key psychological level of 170.00, and has not found major resistance yet. Expecting a bullish trend continuation as long as price stays above 169.
* M30 Bullish Choch
* Creating new HHs and HLs
* M30/H1 Bearish Break Block
* M30/H1 Bullish FVG (50% filled)
🟢Entry: 168.40 – 168.60
Stop Loss: 168.00
TP1: 169.80
TP2: 170.50
TP3: 171.20
Breakout Option: If price pushes above 170.50 early in the week, consider breakout entry on retest.
Invalidation: Bias shifts to neutral if H4 closes below 169.00.

EUR/JPY BEARISH BIAS RIGHT NOW| SHORT
Hello, Friends!
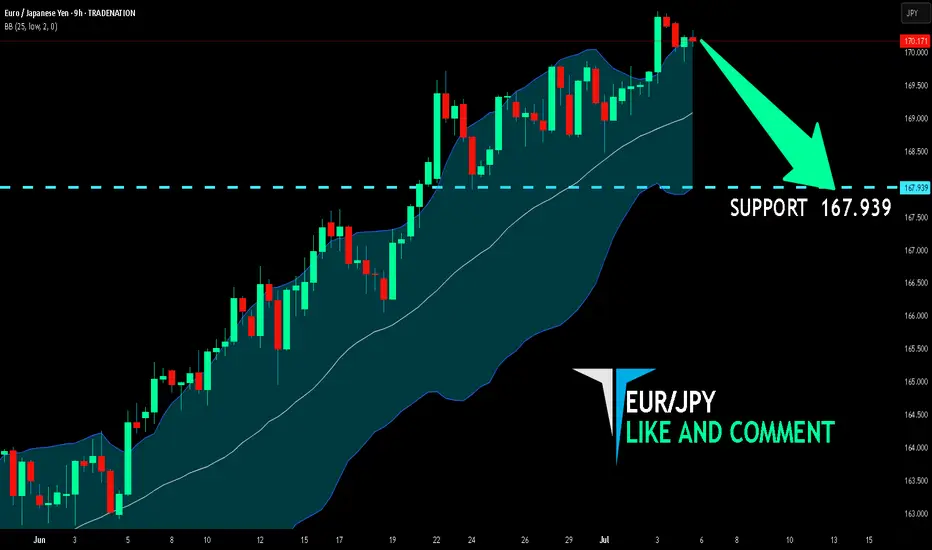
We are now examining the EUR/JPY pair and we can see that the pair is going up locally while also being in a uptrend on the 1W TF. But there is also a powerful signal from the BB upper band being nearby, indicating that the pair is overbought so we can go short from the resistance line above and a target at 167.939 level.
Disclosure: I am part of Trade Nation's Influencer program and receive a monthly fee for using their TradingView charts in my analysis.
✅LIKE AND COMMENT MY IDEAS✅
EUR_JPY WILL GO UP|LONG|
✅EUR_JPY is trading in an
Uptrend and the pair has already
Made a retest of the horizotnal
Support of 169.800 and we are
Already seeing a bullish rebound
So we are bullish biased and
We will be expecting a
Further bullish move up
LONG🚀
✅Like and subscribe to never miss a new idea!✅
Disclosure: I am part of Trade Nation's Influencer program and receive a monthly fee for using their TradingView charts in my analysis.

EUR/JPY – Morning Star Reversal with RSI/MA Bullish ConfirmationTechnical Snapshot (1H Timeframe):
✅ Morning Star pattern at key support/resistance zone (169.90–170.00), indicating potential bullish reversal.
📈 Price holds above 55 EMA, confirming structure support and sustained uptrend.
💥 MACD Bullish Crossover signaling renewed upward momentum.
🔄 RSI crossover above its MA from the 50 level – a classic sign of buyer strength resuming.
Bias: Bullish
As long as price sustains above the EMA cluster and doesn’t close below the 170.00 zone, bulls are in control. Watch for a retest + push scenario for low-risk entries.
This idea is for educational purposes only – not financial advice.

EURJPY What Next? SELL!
My dear friends,
My technical analysis for EURJPY is below:
The market is trading on 170.54 pivot level.
Bias - Bearish
Technical Indicators: Both Super Trend & Pivot HL indicate a highly probable Bearish continuation.
Target - 169.84
About Used Indicators:
A pivot point is a technical analysis indicator, or calculations, used to determine the overall trend of the market over different time frames.
Disclosure: I am part of Trade Nation's Influencer program and receive a monthly fee for using their TradingView charts in my analysis.
———————————
WISH YOU ALL LUCK
EURJPY Weekly Analysis (MMC + SMC) - Trend Expansion + Target🧠 Contextual Overview:
EURJPY has been on a strong long-term bullish rally, fueled by institutional demand and consistent volume expansion patterns. This pair is approaching a critical macro resistance/reversal zone around the 175–176 level, where historically large players have shown interest in redistributing or taking profit.
This analysis uses the MMC (Market Mechanics Concept) integrated with SMC (Smart Money Concepts) to provide a complete perspective on price structure, order flow, and volume behavior.
📊 Structural Breakdown:
🔹 1. Volume Expansion as a Leading Indicator
Volume precedes price — this is a foundational MMC principle.
The recent aggressive impulse to the upside is backed by clear volume expansion visible on higher time frames.
This type of movement indicates smart money accumulation and commitment, rather than retail-driven volatility.
A key insight: Volume Expansion typically signals trend continuation, not reversal—unless a liquidity grab or divergence shows up in reversal zones.
🔹 2. Break of Structure (BOS) Confirms Trend Continuation
A clear BOS occurred when price violated previous swing highs around the 165–167 range.
This BOS suggests a new bullish leg is forming, confirming the market has transitioned from consolidation (accumulation) to distribution (markup phase).
🔹 3. Current Price Path: Heading into a Key Reversal Zone (175–176)
This zone has been mapped based on previous supply imbalances and historical resistance.
Price may tap into this zone before we see either:
A clean continuation above (indicating absorption of supply), or
A rejection or smart money sell-off pattern (distribution, divergence, or exhaustion candles).
Institutions tend to execute significant moves in these areas — watch for liquidity sweep traps and break-of-structure (BOS) on lower timeframes for confirmation.
🧱 Support Zones & Safety Net:
🔸 Major Support: 155–157 Zone
This is a historically significant demand block, respected multiple times since 2023.
A drop into this region could offer a prime long-term swing entry, should price reject the reversal zone.
Also acts as invalidity for current bullish structure. A weekly close below this would signal a potential trend shift or deeper correction.
📉 Technical Patterns & Confluences:
Trendline Breakout + Retest occurred from 2024 into early 2025. This is a classic break-and-retest continuation pattern, confirming bullish interest from smart money.
Price consolidated (reaccumulation) and exploded upward with volume expansion, aligning with Wyckoff theory’s markup phase.
Strong candles with minimal upper wicks = clear sign of institutional commitment.
🎯 Trade Strategy & Scenarios:
🟢 Bullish Continuation Scenario:
If price breaks above 176.000 with volume and closes weekly bullish, expect continuation toward 180.00+ in coming months.
Watch for:
Clean BOS above the reversal zone
Volume expansion confirmation
Retest of breakout level (176–174) for safe re-entry
🔴 Bearish Rejection Scenario:
If price rejects the reversal zone with bearish engulfing or divergence, expect a retracement back toward 165–162 short-term, and possibly 157–155 long-term.
Lower time frame structure shift (BOS to the downside) will confirm early exit from bulls or reversal setups for bears.
🧠 Psychological Perspective:
Smart Money uses reversal zones to entice late buyers before triggering liquidity grabs.
Reversal zones serve as liquidity magnets, often leading to false breakouts before true direction is revealed.
Retail traders often buy into strength at these levels, providing liquidity for institutional exits.
📌 Summary:
✅ Trend: Strong bullish
✅ Structure: Clean BOS with volume confirmation
✅ Next Key Level: 175–176 (Reversal Zone)
✅ Strategy: Monitor for rejection/continuation; align with volume + structure
✅ Volume Behavior: Expansion supports trend continuation
🔖 Final Thoughts:
The EURJPY pair presents a highly educational and strategic opportunity. Whether you trade intraday or swing, this zone (175–176) will define the market direction for the next few months. Use volume, structure shifts, and institutional behavior to guide your trades, not just candlestick patterns.

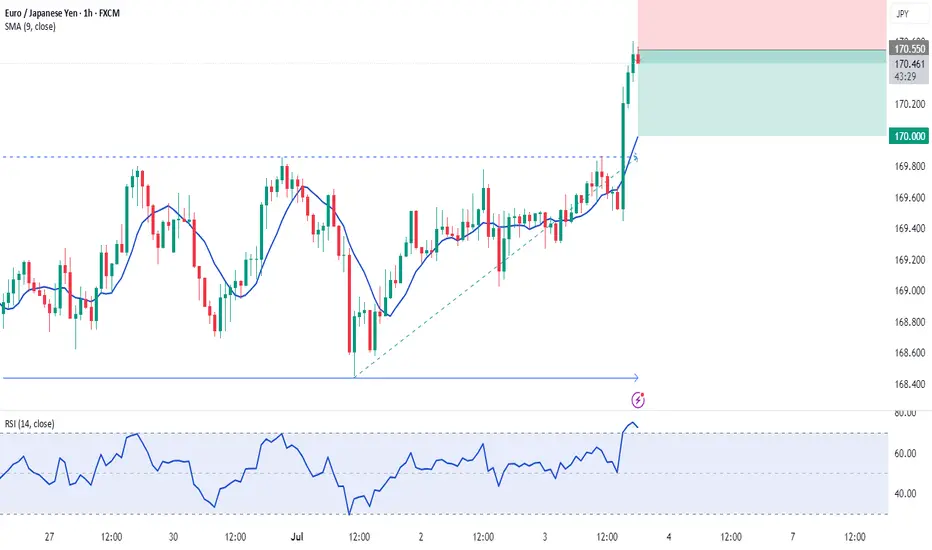
EUR/JPY: Bullish Setup on 170.00 Breakout & Dovish BoJWe've identified a compelling, high-conviction long trade setup on EUR/JPY, perfect for a limit order right now. This trade leverages a powerful combination of fundamental divergence and a confirmed technical breakout, setting the stage for quick execution and potential profit! 🎯💰
Fundamental Rationale: 🌍📊
Japanese Yen (JPY) Weakness: The JPY is under significant bearish pressure. 📉 The Bank of Japan's (BoJ) persistently dovish monetary policy, keeping interest rates at historic lows, creates a wide interest rate differential. This fuels "carry trades," where investors borrow low-yielding JPY to invest in higher-yielding currencies like the Euro, increasing JPY supply. Recent weak economic data, including a decline in Tokyo CPI, reinforces expectations that the BoJ will not hike rates in 2025. Additionally, a global "risk-on" sentiment diminishes the JPY's safe-haven appeal, leading to capital outflow and sustained Yen depreciation. 🐻📉
Euro (EUR) Stability: While the Euro isn't showing explosive bullish momentum, its relative stability provides a crucial counter-balance to the weakening Yen. 🇪🇺 The European Central Bank (ECB) is inclined to maintain its current policy, and recent Eurozone inflation data hasn't significantly altered expectations for further rate cuts in H2 2025. This steady footing, paired with the pronounced JPY weakness, creates a compelling bullish case for EUR/JPY. The Euro's role is to be a stable anchor against a fundamentally weak JPY, allowing the cross to climb. ⚖️
Technical Setup: 📊✨
Decisive Breakout Confirmed: EUR/JPY has achieved a powerful and decisive breakout above the critical psychological resistance of 170.00 and its previous yearly high of 169.75. This is a monumental technical event! Such a sustained move above key long-term barriers signals strong underlying buying pressure and confirms a "new trigger for the bulls," indicating a high probability of continued uptrend. 🚀⬆️
High-Probability Entry Strategy: Our entry strategy is designed for a quick and successful fill. Following the confirmed breakout, we anticipate a classic "breakout and retest" phenomenon, where price pulls back to retest the former resistance (now new support). By placing a limit order slightly below the current market price, at 170.10, we aim to catch this anticipated pullback, securing an optimal entry with a tighter risk profile. 🔄🎯
Clear Resistance Target: Our single Take Profit target is strategically set at 170.90, just below the next significant resistance: the 78.6% Fibonacci retracement level at 170.93. This level, derived from a previous long-term decline, represents a key area where price might encounter resistance. Targeting slightly below it increases the probability of the TP being hit before any potential reversal. 🎯✅
Trade Parameters: 📋✨
Currency Pair: EUR/JPY 💶🇯🇵
Direction: Long (Buy) ⬆️
Entry (Limit Order): 170.10
Take Profit (TP): 170.90
Stop Loss (SL): 169.60
Risk-Reward Ratio: 1.6:1 (A favorable ratio for a high-probability setup!) ✅

EURJPY SHORT DAILY FORECAST Q3 D4 W27 Y25EURJPY SHORT DAILY FORECAST Q3 D4 W27 Y25
Professional Risk Managers👋
Welcome back to another FRGNT chart update📈
Diving into some Forex setups using predominantly higher time frame order blocks alongside confirmation breaks of structure.
Let’s see what price action is telling us today! 👀
💡Here are some trade confluences📝
✅Daily Order block identified
✅4H Order Block identified
✅1H Order Block identified
🔑 Remember, to participate in trading comes always with a degree of risk, therefore as professional risk managers it remains vital that we stick to our risk management plan as well as our trading strategies.
📈The rest, we leave to the balance of probabilities.
💡Fail to plan. Plan to fail.
🏆It has always been that simple.
❤️Good luck with your trading journey, I shall see you at the very top.
🎯Trade consistent, FRGNT X

EUR-JPY Will Keep Growing! Buy!
Hello,Traders!
EUR-JPY is trading in an
Uptrend and the pair broke
The key horizontal level
Of 169.814 and the breakout
Is confirmed so after a potential
Retest of the support cluster
Of the rising and horizontal
Support lines below we will
Be expecting a bullish continuation
Buy!
Comment and subscribe to help us grow!
Check out other forecasts below too!
Disclosure: I am part of Trade Nation's Influencer program and receive a monthly fee for using their TradingView charts in my analysis.

EURJPY LONG IDEAI have been waiting for this EURJPY long setup to form for the past 2 trading sessions.
This morning I saw this beautiful bullish swing low formed and that is my entry signal for to take a long trade on EURJPY.
REASONS:
EURJPY is super bullish right now.
The Daily and 4Hour time frame trend is extremely bullish. So, am only looking to take a long buy to follow the trend direction.

EUR-JPY Strong Uptrend! Buy!
Hello,Traders!
EUR-JPY is trading in an
Uptrend along the rising
Support and we are already
Seeing a local rebound
Which reinforces our bullish
Bias and we will be expecting
A further bullish move up
Buy!
Comment and subscribe to help us grow!
Check out other forecasts below too!
Disclosure: I am part of Trade Nation's Influencer program and receive a monthly fee for using their TradingView charts in my analysis.

EURJPY - Looking To Sell Pullbacks In The Short TermM15 - Strong bearish move.
Lower lows on the moving averages of the MACD.
No opposite signs.
Currently it looks like a pullback is happening.
Expecting bearish continuation until the two Fibonacci resistance zones hold.
If you enjoy this idea, don’t forget to LIKE 👍, FOLLOW ✅, SHARE 🙌, and COMMENT ✍! Drop your thoughts and charts below to keep the discussion going. Your support helps keep this content free and reach more people! 🚀
--------------------------------------------------------------------------------------------------------------------

EURJPY SHORT DAILY FORECAST Q3 D1 W27 Y25EURJPY SHORT DAILY FORECAST Q3 D1 W27 Y25
Professional Risk Managers👋
Welcome back to another FRGNT chart update📈
Diving into some Forex setups using predominantly higher time frame order blocks alongside confirmation breaks of structure.
Let’s see what price action is telling us today! 👀
💡Here are some trade confluences📝
✅Daily Order block identified
✅4H Order Block identified
✅1H Order Block identified
🔑 Remember, to participate in trading comes always with a degree of risk, therefore as professional risk managers it remains vital that we stick to our risk management plan as well as our trading strategies.
📈The rest, we leave to the balance of probabilities.
💡Fail to plan. Plan to fail.
🏆It has always been that simple.
❤️Good luck with your trading journey, I shall see you at the very top.
🎯Trade consistent, FRGNT X

EURJPY Readies Triangle Breakout w/ Elliot WaveOANDA:EURJPY has formed a Triangle Pattern with a Rising Support and Resistance Zone @ 169.5 - 169.7 area.
After the False Breakout last week on Friday, we see Price falls back within the Pattern and finds strong Resistance from the zone.
Now based from the High - to Low - to Lower High where price made a 50% - 61.8% Retracement, we can plot the Trend Based-Fib Tool that suggests with the change of trend ( Price printing a Lower High ) we can expect Lower Prices to come and potentially a Bearish Breakout to the pattern!
First we will want to see where the next Lower Low will be ( currently @ 168.934 ) then wait for a Retracement to a favorable Fibonacci Level based from the Lower High to Lower Low.
Fundamentally, the EUR will have CPI Flash Estimates on Tuesday, and multiple Services PMI on Thursday with ECB President Lagarde speaking Tuesday and Wednesday. This could add volatility!!
Stay Tuned!

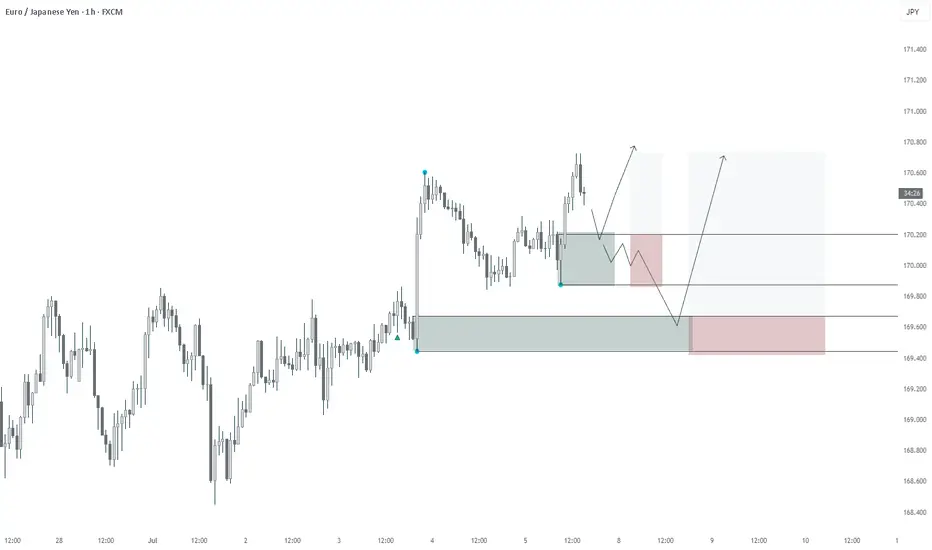
EUR/JPY 1H Analysis – Ascending Channel With Critical ResistanceThe EUR/JPY pair has been trending steadily inside a well-defined ascending channel, indicating bullish control over the past few weeks. However, price is now approaching a major horizontal resistance zone, aligning with the upper boundary of the channel — a critical area for potential breakout or reversal.
🔍 Chart Structure Breakdown:
🔹 1. Ascending Channel (Trend Continuation Structure)
The pair is respecting both the upper and lower trendlines precisely, forming a bullish parallel channel.
EMAs are aligned bullishly and acting as dynamic support.
Price continues forming higher highs and higher lows, a classic uptrend behavior.
🔹 2. Horizontal Resistance Zone (Purple Box)
The price is currently retesting a key horizontal resistance zone where sellers previously stepped in.
This zone aligns closely with the upper channel boundary, increasing confluence.
We could be witnessing a potential double top or a breakout build-up.
🔹 3. Volume Spike & Buyer Strength
Recent candles show increased volume — a possible signal that institutions are preparing for a larger move.
If volume increases further on breakout, it would confirm continuation.
🧭 Scenarios to Watch:
🟢 Bullish Scenario:
A strong breakout above the purple zone with a full-body candle close could signal:
A breakout from the ascending channel.
Fresh bullish momentum possibly targeting the 170.800–171.500 zone.
Ideal entry: On bullish retest of the breakout zone.
SL below breakout candle; TP at upper Fibonacci extensions.
🔴 Bearish Scenario (Double Top Rejection):
If price rejects the resistance zone again, forming a lower high or engulfing candle:
Expect a short-term pullback toward the midline or lower channel, around 168.500–168.000.
Bearish divergence with RSI or volume may confirm weakness.
This would create a Double Top inside the channel, often leading to a deeper correction.
📌 Conclusion:
EURJPY is at a make-or-break zone. The bullish structure remains intact, but the price must break and hold above the resistance to confirm strength. Until then, this could be a short-term exhaustion point.
🔄 Stay flexible. Watch volume, candle closes, and EMA behavior for confluence on your trade setup.
This analysis and chart work are entirely original and created from my own observations and strategy. Any resemblance to other posts is purely coincidental.
⚠️ Disclaimer:
This analysis is for educational and informational purposes only and does not constitute financial advice or a buy/sell recommendation. All views expressed are my own, based on personal technical interpretation.

EURJPY SHORT DAILY FORECAST Q3 D30 W27 Y25EURJPY SHORT DAILY FORECAST Q3 D30 W27 Y25
Professional Risk Managers👋
Welcome back to another FRGNT chart update📈
Diving into some Forex setups using predominantly higher time frame order blocks alongside confirmation breaks of structure.
Let’s see what price action is telling us today! 👀
💡Here are some trade confluences📝
✅Daily Order block identified
✅4H Order Block identified
✅1H Order Block identified
🔑 Remember, to participate in trading comes always with a degree of risk, therefore as professional risk managers it remains vital that we stick to our risk management plan as well as our trading strategies.
📈The rest, we leave to the balance of probabilities.
💡Fail to plan. Plan to fail.
🏆It has always been that simple.
❤️Good luck with your trading journey, I shall see you at the very top.
🎯Trade consistent, FRGNT X

The Correlation Between EURJPY and NASDAQ You Shouldn't IgnoreCurrently keeping a close eye on EURJPY — price action has been bullish 📈, showing a strong upward push on the daily timeframe 🕒.
Right now, we’re seeing a bit of indecision 🤔, which is fairly typical for a Monday session as the market finds its footing.
🔍 I’m watching for continuation to the upside, as long as NASDAQ remains bullish. That said, NASDAQ is looking quite overextended 🧗, and a pullback could trigger a short-term retracement in the euro as well — these two tend to move in correlation 🔗, so keep a close watch on NAS100 for early clues.
If EURJPY consolidates sideways ⏸️, and we then get a clear break of market structure to the upside 🚀, I’ll be looking for a long setup on the retest and failure of the range floor — textbook continuation play 🎯.
As always, this is not financial advice — full breakdown in the video 🎥.

EURJPY 4hour TF - June 29th, 2025EURJPY 4hour Bullish Idea
Monthly - Bullish
Weekly - Bullish
Daily - Bullish
4hour - Bullish
EJ has been in a bullish trend on all timeframes and doesn’t really show any signs of stopping. Currently we are right near major monthly resistance around 171.000. It is likely we will see price action push into this zone but we want to identify a potential trade beforehand.
Here are two potential scenarios for this week on EJ
Bullish Continuation - We are a bit close to the 171.000 monthly zone so we would like to see price action come back to our 168.500 4hour support zone before targeting higher.
Trend Reversal - If we see price action fall below 168.500 we want to see bearish conviction and rejection from that same zone. If this happens we can start to consider short scenarios and target lower support levels like 166.250.
