EURJPY Bulls in Trouble? Massive Rejection Signals📉 Full Multi-Factor Analysis – EUR/JPY
🔍 1. Price Action
EUR/JPY strongly rejected the key supply zone between 164.80–165.50, aligned with a major static resistance.
Last week's breakout was invalidated by a clear bull trap, followed by a bearish engulfing candle.
Price broke below the ascending channel drawn since April and is now heading toward the 162.00 demand area.
The weekly RSI shows a bearish divergence, confirming a slowdown in momentum.
➡️ Technical Bias: Bearish toward 161.50–162.00, with a possible extension to 160.00.
💼 2. COT Data – Commitment of Traders
EUR Futures (CME)
Strong increase in commercial longs (+16,095) and non-commercial shorts (+4,830).
Suggests smart money is accumulating while retail/speculators are pressing shorts — potential accumulation, but no breakout yet.
JPY Futures
Significant rise in non-commercial shorts (+10,575), while long positions declined.
The yen remains pressured, but extreme positioning could fuel a reversal if sentiment flips.
➡️ COT Takeaway: Euro remains in bullish consolidation. Yen is heavily oversold — ripe for mean reversion. Caution warranted.
📊 3. Retail Sentiment
80% of retail traders are short from an average price of 160.46, while price now sits at 164.86.
The crowd is deep in drawdown — a typical condition for short-term consolidations or fakeouts before reversals.
➡️ Implication: Price may hover around 164+ to trap remaining retail shorts before unwinding.
📈 4. Seasonality
June seasonality for EUR/JPY is historically neutral to bearish.
Only the 5-year data shows strength, while 15Y and 20Y trends reveal consistent downside starting mid-June.
➡️ Seasonal Outlook: Adds further weight to a bearish correction scenario for the second half of the month.
✅ Actionable Summary
📌 Weekly Bias: Bearish
📉 Main Target: 162.00–161.50
📉 Extended Target: 160.00
📈 Invalidation: Weekly close above 165.60
🧠 Final Thoughts
All major elements — price action, COT, sentiment, and seasonality — point toward a corrective move on EUR/JPY.
Given the strong underlying trend and retail’s positioning, watch out for bull traps before deeper downside.
Best setup: Sell the pullback or wait for clean breakdown below 163.00.
Eurjpy!

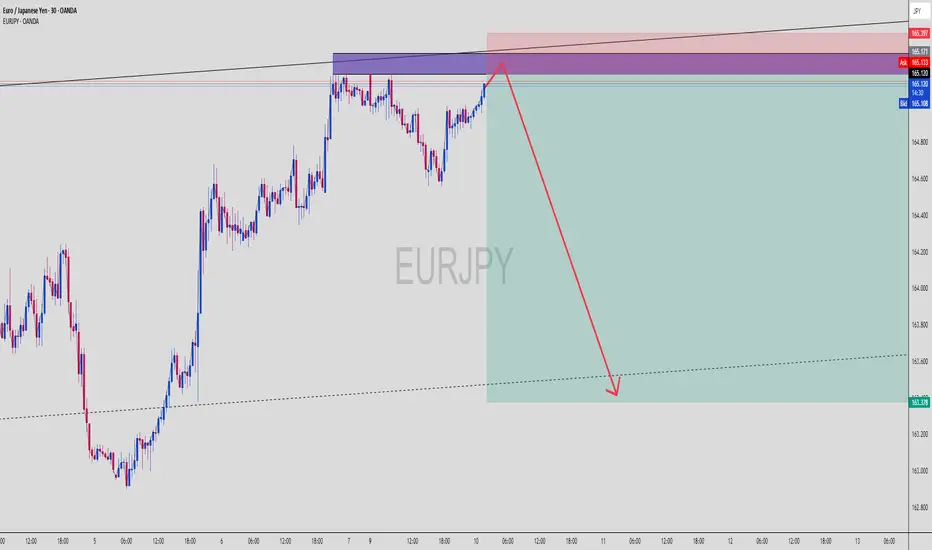
EURJPY Supply Tap! Bearish Reaction Coming?EURJPY (30-Min) | Supply Zone Hit + Bearish Reversal Setup
This EURJPY move is brewing into a classic SMC bearish play — engineered liquidity run, supply zone reaction, and a projected melt to imbalance below. Let’s dissect the ninja logic 🧠📉
🔍 Breakdown of the Setup:
🟥 Supply / Order Block Zone
Price enters a strong bearish OB zone between 165.100–165.397
Previous rejection wicks in this zone = smart money sell interest
Price now testing that area again — potential for liquidity sweep + reversal
🟪 Multi-Zone Confluence
Multiple overlapping zones stacked: OB, mitigation block, and liquidity sweep area
Perfect spot for Smart Money to unload positions before sending price lower
📏 Risk-Reward Optimization
Entry near 165.100–165.397 zone
Stop Loss placed slightly above the last rejection wick (above 165.397)
Take Profit projected around 163.378 based on measured impulse leg and imbalance fill
🧠 Liquidity Narrative
The rally into supply is likely a buy-side liquidity hunt
Smart Money often drives price into key zones before triggering reversals
Price may wick above 165.171 to fake bulls before a strong sell-off
🧠 Chart Ninja Entry Plan:
🔻 Entry Zone 165.100 – 165.397 (Supply OB)
🛡 SL Above 165.450 (above wick / last structure high)
🎯 TP Target 163.378 (imbalanced fill target)
⚖️ RRR Approx. 1:4+ depending on entry precision
🥷 Chart Ninja Note:
“The trap is always set where the crowd feels the safest —
and that’s exactly where the ninja strikes.” 🥷📉
This setup could be a clean ride down if price reacts as expected. Confirmation entry = bearish engulfing on M15 or M30.
🔁 Bonus Observation:
You can see lower timeframes building internal liquidity, meaning we might get a sharp, volatile drop once that top wick finishes sweeping.
📍Mark this zone and set an alert — entry can trigger fast!
🔥 What’s your confirmation style — engulfing candle or breaker structure?
EURJPY Long opportunity at 164.250EURJPY currently has bullish market directionality and is on a retracement from the 165.000 level toward the break and retest zone at 164.250. on the 4 hour timeframe price is trading above the 50 SMA and is in the Bullish RSI zone above 55 below 70. The 164.250 price points lays in the sweet spot between 45-55 in the RSI which signals the potential end of the retracement and pivot back towards the bullish momentum. Looking to ride this long position back towards the 165.000 resistance level.

EURJPY ANALYSIS After seeing the previous week close really bullish on the daily and weekly timeframes, we could expect that momentum to continue pushing but since the pair is at a HH area on the daily we could expect a pull back before the bullish move kicks in

LONG | EUR/JPY | 1D Macro Context: With ECB neutral and BoJ dovish, EUR/JPY favored to drift upward slowly as Yen weakness persists.
Structure: In a long-term bullish channel and recently bounced off the 50‑day MA near 163.0–163.5 .
Trigger:
Entry: Long on pullback to 163.50–164.00.
Stop: 162.80 (below channel support & LVN).
Target: 166.70 (upper channel range) → 168.00 zone.
R:R: ~1:2.5.
Framework: Entry aligns with liquidity sweep and bounce off HVN/50MA, supported by Elliott/Elliott-wave count and broader bullish range.
EURJPY: Short Trade with Entry/SL/TP
EURJPY
- Classic bearish setup
- Our team expects bearish continuation
SUGGESTED TRADE:
Swing Trade
Short EURJPY
Entry Point - 164.60
Stop Loss - 165.15
Take Profit - 163.56
Our Risk - 1%
Start protection of your profits from lower levels
Disclosure: I am part of Trade Nation's Influencer program and receive a monthly fee for using their TradingView charts in my analysis.
❤️ Please, support our work with like & comment! ❤️

EURJPY Be ready to sell soon.Last time we looked at the EURJPY pair (February 26, see chart below), we gave a clear buy signal that wasted no time hitting straight our 162.250 Target:
With the Lower Highs trend-line now broken, a new pattern has emerged and that's a (blue) Channel Up. The current Bullish Leg is headed straight to the 8-month Resistance Zone, so we will be turning bearish there, targeting the 1D MA200 (orange trend-line) at 162.250.
-------------------------------------------------------------------------------
** Please LIKE 👍, FOLLOW ✅, SHARE 🙌 and COMMENT ✍ if you enjoy this idea! Also share your ideas and charts in the comments section below! This is best way to keep it relevant, support us, keep the content here free and allow the idea to reach as many people as possible. **
-------------------------------------------------------------------------------
💸💸💸💸💸💸
👇 👇 👇 👇 👇 👇

EURJPY: Well supported Channel Up aiming for 166.700.EURJPY is bullish on its 1D technical outlook (RSI = 58.535, MACD = 0.340, ADX = 24.438) and is staging right now a rebound on the 1D MA50. This comes only days after the 1D MA200 HL rebound tight at the bottom of the Channel Up. This is a great opportunity to buy and aim for the R1 level (TP = 166.700).
## If you like our free content follow our profile to get more daily ideas. ##
## Comments and likes are greatly appreciated. ##

ECB Rate Cut - EUR/JPY Trading ImpactThe European Central Bank (ECB) is expected to cut rates by 25 bps today, lowering the deposit rate to 2.00%. While this move is largely priced in, what matters for markets—especially EUR/JPY—is the forward guidance.
Relevance to EUR/JPY:
Rate Cut = EUR Bearish: Lower rates reduce euro appeal, especially vs. the yen, which is still heavily influenced by the Bank of Japan’s ultra-loose policy. A clear ECB dovish tone may weigh on EUR/JPY.
ECB Caution May Limit EUR Downside: If the ECB signals it's nearing the end of cuts or expresses concern over sticky inflation, it could support EUR. This would limit downside in EUR/JPY or even trigger a rebound.
BOJ Policy Still Ultra-Loose: Japan’s rates remain near zero, and unless the BOJ surprises with a hawkish shift (unlikely short term), EUR/JPY is more likely to react to ECB tone than BOJ policy.
Risk Sentiment Matters: EUR/JPY often tracks risk appetite. If markets interpret the ECB cut as growth-supportive, and global equities rise, EUR/JPY could hold firm or climb despite the rate cut.
Trading Implications
Dovish ECB = EUR/JPY downside, especially if markets price in more cuts.
"One-and-done" message = EUR/JPY support or slight upside.
Watch for BOJ comments or risk sentiment shifts to fine-tune positioning.

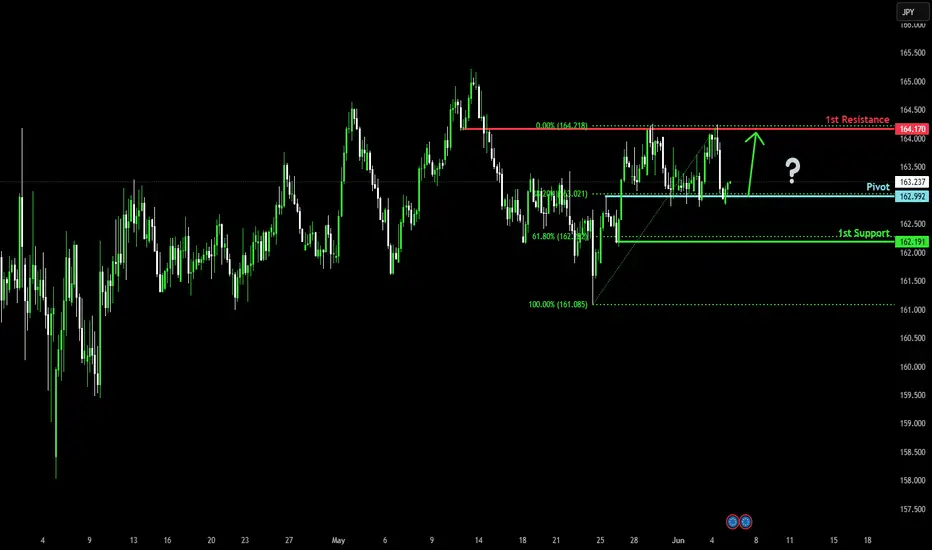
Could the price bounce from here?EUR/JPY has reacted off the pivot that lines up with the 38.2% Fibonacci retracement and could bounce to the 1st resistance.
Pivot: 162.99
1st Support: 162.19
1st Resistance: 164.17
Risk Warning:
Trading Forex and CFDs carries a high level of risk to your capital and you should only trade with money you can afford to lose. Trading Forex and CFDs may not be suitable for all investors, so please ensure that you fully understand the risks involved and seek independent advice if necessary.
Disclaimer:
The above opinions given constitute general market commentary, and do not constitute the opinion or advice of IC Markets or any form of personal or investment advice.
Any opinions, news, research, analyses, prices, other information, or links to third-party sites contained on this website are provided on an "as-is" basis, are intended only to be informative, is not an advice nor a recommendation, nor research, or a record of our trading prices, or an offer of, or solicitation for a transaction in any financial instrument and thus should not be treated as such. The information provided does not involve any specific investment objectives, financial situation and needs of any specific person who may receive it. Please be aware, that past performance is not a reliable indicator of future performance and/or results. Past Performance or Forward-looking scenarios based upon the reasonable beliefs of the third-party provider are not a guarantee of future performance. Actual results may differ materially from those anticipated in forward-looking or past performance statements. IC Markets makes no representation or warranty and assumes no liability as to the accuracy or completeness of the information provided, nor any loss arising from any investment based on a recommendation, forecast or any information supplied by any third-party.
EUR_JPY VERY RISKY LONG|
✅EUR_JPY is set to retest a
Local support level below at 162.900
After trading in a local downtrend for some time
Which makes a bullish rebound a likely scenario
With the target being a local resistance above at 163.112
LONG🚀
✅Like and subscribe to never miss a new idea!✅
Disclosure: I am part of Trade Nation's Influencer program and receive a monthly fee for using their TradingView charts in my analysis.

EURJPY Technical Analysis! SELL!
My dear subscribers,
My technical analysis for EURJPY is below:
The price is coiling around a solid key level - 163.50
Bias - Bearish
Technical Indicators: Pivot Points High anticipates a potential price reversal.
Super trend shows a clear sell, giving a perfect indicators' convergence.
Goal - 162.79
My Stop Loss - 163.85
About Used Indicators:
By the very nature of the supertrend indicator, it offers firm support and resistance levels for traders to enter and exit trades. Additionally, it also provides signals for setting stop losses
Disclosure: I am part of Trade Nation's Influencer program and receive a monthly fee for using their TradingView charts in my analysis.
———————————
WISH YOU ALL LUCK

EURJPY: First red day, new monthly cycle!Hello everyone and welcome back to my channel! As always, my analysis are not a financial suggestion, neither a way to predict the market direction.
Predicting and guessing is quite 50/50, my job is hunting the best trade setup for the day, and my analysis are only a tool to identify a great risk reward and to align the setup with the overall thesis.
EURJPY, ended the month of May with an interesting signal, and I'm looking to potentially complete a two week Pump and dump, if it will setup correctly during the upcoming days.
Let's see it in depth, zooming into the previous week!
Monday, opening range of the week, the weekly boundaries are in place, long triggered in the market, starting the day with a pump before Asia session.
Tuesday, initial balance, the market pumped stronger higher, expanding the range, setting the currently weekly high low.
Long traders have been triggered for the second time, and the market closed in breakout. (Other time frames may be driving this move!)
Wednesday, midpoint range of the week, nothing really happened, the market stayed inside, up high into the weekly high, closing the day as an "inside" signal, which typically can be an interesting signal for explosive move.
Thursday, the weekly high has been broken for the third time, long traders are triggered one more time, and eventually (we don't know it certainly), volume can be trapped up high, and the market could shift soon. The breakout of the weekly high, looks like failed and we might start watching for a great reversal.
Friday, last trading day of the week and the month of May, placed a lower low (breaking in structure) and pumped back up inside the daily range, near the Thursday closing price, closing the week as a first red day.
FIRST RED DAY, typical is a reversal signal when it setup properly, but as per my experience and backtest, I don't have many templates where the market fall on Monday. It might happen because it is the first day of the new month and we can see interesting moves, but currently I do not see the setup for today, unless major red news on schedule at 10am NYT might be particularly volatile.
What am I looking for?
In order to validate this signal, I want to partecipate in a pump and dump scenario, setting up during the 3 session Asia, London and NY, not necessarily today, but until the signal will be valid.
Can this market go higher?
Absolutely yes, I repeat, I'm not Nostradamus ahah I do not use technical analysis to forecast, but only to research for the risk reward eventually I will position myself in the market.
I will update this post until FRD signal will be valid!
Gianni

As ECB Ready's "Final Cut", EJ "Begins Reversal"OANDA:EURJPY has began to potentially form a very strong Triple Reversal Pattern, The Head and Shoulders @ the Resistance Level lasted visited May 14th.
I say "potentially" because the "Right Shoulder" or recent Lower High has been created but we still wait for the final decline to the "Neckline" or Support Area formed by the Lows separating the "Head" from the "Shoulders" or Higher High from the Lower Highs in the pattern!
Signs of Potential Head & Shoulders:
1) Left Shoulder is an Oversold High
2) A Higher High is created at a level of Resistance
3) The Head not only has the Most Volume concentrated in the Pattern, but is also the start of the RSI Divergence from Price
4) Right Shoulder is formed and unable to surpass the Left Shoulder
..Bringing us to a very important tell..
5) Volume Decreases and logs a 3rd Divergent High in the RSI @ the creation of the Right Shoulder
Now we must WAIT for CONFIRMATION of the Pattern!
This will come when Price:
1) Declines to the Neckline
&
2) Makes Successful Breakout
Once the Head & Shoulders is Confirmed and Breakout is Validated:
- This could deliver great Short opportunities as a Head and Shoulders Breakout and Retest at the Neckline being the Last Line of Defense for the Bulls if Bears can push Price through and pick up Volume!
Fundamentally, BOJ Governor Kazuo Ueda will be speaking on Tuesday, June 3rd where we could see volatility come in for JPY.
The ECB is expected to cut rates by 25 bps from 2.4% to 2.15% on Thursday, June 5th and this could be the Last Cut we see the ECB plan to make until they see downside growth risks make more cuts likely.

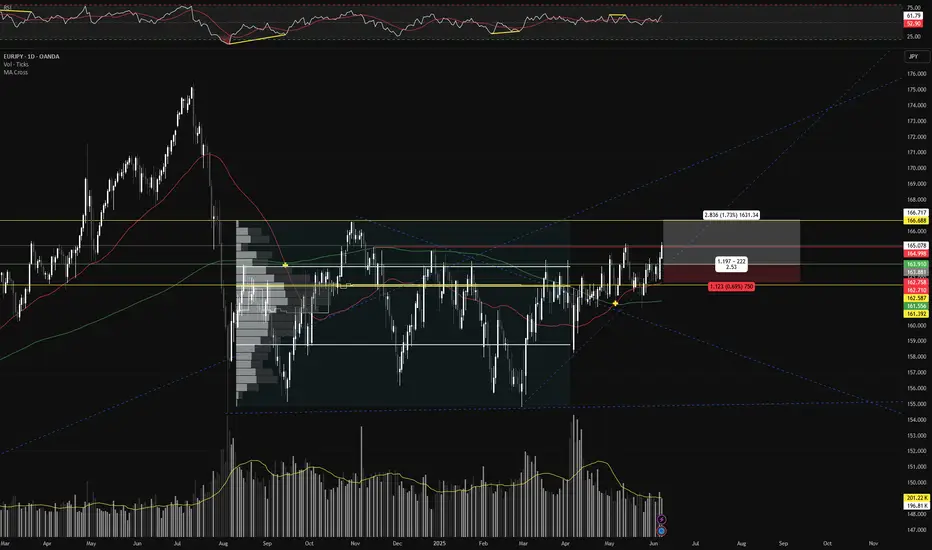
EURJPY Weekly Analysis – Major Structural Breakout & Target🧱 1. Consolidation Zone: The Dual Directional Area
From around August 2024 to May 2025, EURJPY traded inside a well-defined consolidation range, marked between approximately 155.00 to 165.00. This phase can be categorized as a Dual Directional Zone, meaning both buyers and sellers had tactical entries, but the market was in accumulation/distribution mode.
This phase often traps breakout traders and builds liquidity on both sides.
Price repeatedly swept highs and lows inside this zone but lacked any commitment, signaling that larger players were building positions.
The flat structure over months hinted that a major move was imminent.
⚠️ 2. Major CHoCH (Change of Character)
The first clue of shifting momentum was the CHoCH, which signaled a change in direction and flow of control.
The lower highs and lower lows began to shift into higher lows, showing buying strength beneath the surface.
This change didn’t immediately lead to breakout, but it marked the early intention of bullish dominance.
🚀 3. Major BOS (Break of Structure): Confirming the Bullish Bias
The clean break above the range high was the confirmation of a major bullish BOS.
This wasn’t just a minor pop — it was an aggressive breakout, validating that institutional liquidity had been accumulated and was now being deployed.
The price ran swiftly toward the Bullish Target Zone (~177.50–180.00) with very little pullback, suggesting urgency from buyers or short-covering from trapped sellers.
🎯 4. Bullish Target Reached – What's Next?
Price has hit the projected Bullish Target Area — a region of prior imbalance and psychological round numbers.
Traders who caught the breakout now face a critical decision point: Will price continue higher into price discovery mode, or is this the exhaustion phase?
If price holds above the BOS level (~165.00), there’s still room for continuation. But signs of rejection or slowing momentum here could lead to a correction.
🔻 5. Bearish Alternative: Trap and Reversal Scenario
The bearish path is not out of play — in fact, this move upward could potentially be a liquidity sweep.
If price fails to stay above the BOS and rapidly closes back into the consolidation range, it would suggest a bull trap.
This would confirm a deviation, which often leads to violent reversals.
The projected Bearish Target Zone (~145.00–147.50) aligns with prior unmitigated zones and imbalance that may attract price if sentiment flips.
🧭 6. Trading Strategy & Risk Planning
For Bulls: Watch for consolidation above 165.00. Breakout + Retest entries toward 180.00 or beyond offer high R/R.
For Bears : Look for exhaustion or fakeout patterns (like a Quasimodo or supply engulfing) near current highs. A breakdown and close below 165.00 signals short entries targeting 150s and potentially 147s.
💬 Final Thoughts:
This chart is a prime example of how patience during a range and reaction after breakout pays off. Smart traders don’t chase — they prepare.
A bullish continuation may still be in play.
However, if this move was only a liquidity purge, the reversal could be deep and fast.
Stay alert, mark your key levels, and trade what you see — not what you feel.

EURJPY: Move Up Ahead! 🇪🇺🇯🇵
EURJPY is going to rise more after breaking
a resistance line of a tiny horizontal consolidation range
that was formed on a retest of a recently broken daily structure.
Goal - 164.8
❤️Please, support my work with like, thank you!❤️
I am part of Trade Nation's Influencer program and receive a monthly fee for using their TradingView charts in my analysis.

EURJPY: Important Breakout 🇪🇺🇯🇵
EURJPY broke a significant resistance cluster on a daily.
We see its retest now.
I think that the price will start rising from that and reach
at least 164.5 level.
❤️Please, support my work with like, thank you!❤️
I am part of Trade Nation's Influencer program and receive a monthly fee for using their TradingView charts in my analysis.

EURJPY: Bearish Continuation
Balance of buyers and sellers on the EURJPY pair, that is best felt when all the timeframes are analyzed properly is shifting in favor of the sellers, therefore is it only natural that we go short on the pair.
Disclosure: I am part of Trade Nation's Influencer program and receive a monthly fee for using their TradingView charts in my analysis.
❤️ Please, support our work with like & comment! ❤️

Bearish reversal?EUR/JPY is rising towards the resistance level which is an overlap resistance that lines up with the 50% Fibonacci retracement and could drop from this level to our take profit.
Entry: 163.18
Why we like it:
There is an overlap resistance level that lines up with the 50% Fibonacci retracement.
Stop loss: 163.18
Why we like it:
There is a pullback resistance level that is slightly above the 61.8% Fibonacci retracement.
Take profit: 161.61
Why we like it:
There is a pullback support level.
Enjoying your TradingView experience? Review us!
Please be advised that the information presented on TradingView is provided to Vantage (‘Vantage Global Limited’, ‘we’) by a third-party provider (‘Everest Fortune Group’). Please be reminded that you are solely responsible for the trading decisions on your account. There is a very high degree of risk involved in trading. Any information and/or content is intended entirely for research, educational and informational purposes only and does not constitute investment or consultation advice or investment strategy. The information is not tailored to the investment needs of any specific person and therefore does not involve a consideration of any of the investment objectives, financial situation or needs of any viewer that may receive it. Kindly also note that past performance is not a reliable indicator of future results. Actual results may differ materially from those anticipated in forward-looking or past performance statements. We assume no liability as to the accuracy or completeness of any of the information and/or content provided herein and the Company cannot be held responsible for any omission, mistake nor for any loss or damage including without limitation to any loss of profit which may arise from reliance on any information supplied by Everest Fortune Group.

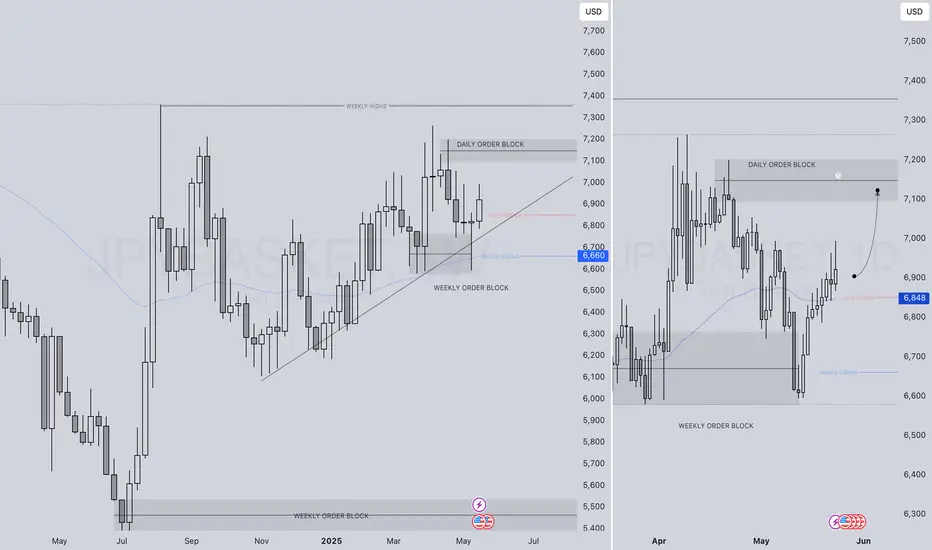
WHO LOVES A STRONG JPY ( YEN )BASKET FORECAST Q2 W22 Y25WHO LOVES A STRONG JPY ( YEN )BASKET FORECAST Q2 W22 Y25
Professional Risk Managers👋
Welcome back to another FRGNT chart update📈
Diving into some Forex setups using predominantly higher time frame order blocks alongside confirmation breaks of structure.
Let’s see what price action is telling us today!
✅The JPY Basket tracks the overall strength of the JPY against a weighted average of other currencies.
✅It can be used as an indicator of YEN strength which can be a tool for analysing and potentially hedging for or against the Index.
✅ Pairs to watch - GBPJPY, USDJPY EURJPY, CADJPY, AUDJPY
🔑 Remember, to participate in trading comes always with a degree of risk, therefore as professional risk managers it remains vital that we stick to our risk management plan as well as our trading strategies.
📈The rest, we leave to the balance of probabilities.
💡Fail to plan. Plan to fail.
🏆It has always been that simple.
❤️Good luck with your trading journey, I shall see you at the very top.
🎯Trade consistent, FRGNT X
EUR/JPY Technical Breakdown: Rising Wedge Breakdown + Target🔺 1. Rising Wedge Pattern Explained
A Rising Wedge is formed when:
Price action creates higher highs and higher lows, but
The slope of the support line is steeper than the resistance line.
This signals that buyers are losing strength, and momentum is fading.
In this chart:
The wedge began forming around mid-February 2025.
Price was compressing within converging trendlines.
After multiple failed breakouts near resistance (~165.50), the pair finally broke below the lower trendline, confirming a bearish breakout.
This pattern is considered reliable because it traps late buyers and shifts sentiment from bullish to bearish quickly once the lower boundary is breached.
🔻 2. Key Technical Zones
📌 Major Resistance Zone (~165.00 – 166.00)
Strong supply area; price has rejected here multiple times since late 2023.
Resistance was confirmed again during the wedge formation.
High volume spike noted near this level, followed by a steep drop—evidence of distribution and smart money exiting long positions.
📌 Major Support Zone (~156.00 – 157.00)
Historically held as a demand zone.
Previous bounces suggest it is structurally significant.
However, repeated tests can weaken the zone, increasing the likelihood of a breakdown.
🎯 Target Price: 153.433
Measured by taking the height of the wedge and projecting it from the breakout point.
Coincides with a previously tested level (support turned target).
Bears could aim for this level as a swing target.
📉 3. Market Psychology Behind the Pattern
As price climbs inside a rising wedge, volume often declines, showing buyer exhaustion.
False breakouts near the top of the wedge trap breakout traders, adding fuel to the downside move once price breaks the lower boundary.
The sharp selloff post-breakout is often driven by stop-loss cascades and aggressive short positioning.
🔁 4. Potential Price Path & Trade Plan
Retest in Progress: Price may retest the broken wedge support (now resistance) near 163.00–164.00 before further decline. This retest zone offers a high-probability short entry opportunity with tight risk management.
Immediate Downside Levels: 160.00 (psychological level), 157.00 (support zone), and final target at 153.43.
Bearish Continuation Scenario: If the pair maintains below the wedge and forms lower highs, it confirms ongoing bearish sentiment.
🛑 5. Risk Factors to Monitor
ECB or BOJ monetary policy shifts (rate cuts/hikes, yield curve control updates).
Risk-on vs risk-off flows, especially in times of geopolitical or macroeconomic shocks.
Intervention by the Bank of Japan to protect JPY from excessive weakening.
✅ Conclusion: A Tactical Short Opportunity
The EUR/JPY chart is setting up for a potential medium-term short swing trade following a confirmed rising wedge breakdown. With clear rejection from a long-standing resistance zone and fading bullish momentum, the technicals align for a move toward 153.43 over the coming weeks.
Traders should watch for clean retests and structure-based entries, managing risk around 164.50 with profit-taking at key support zones along the path.

EURJPY - Look for Short (SWING) 1:XX!It’s been a while since I last shared a trading idea — here’s one for you.
EURJPY has spent the past few weeks in an accumulation phase and now looks poised to shift into a distribution phase to the downside. Let’s see how it unfolds.
Disclaimer:
This is simply my personal technical analysis, and you're free to consider it as a reference or disregard it. No obligation! Emphasizing the importance of proper risk management—it can make a significant difference. Wishing you a successful and happy trading experience!

EURJPY: Expecting Bearish Movement! Here is Why:
The analysis of the EURJPY chart clearly shows us that the pair is finally about to tank due to the rising pressure from the sellers.
Disclosure: I am part of Trade Nation's Influencer program and receive a monthly fee for using their TradingView charts in my analysis.
❤️ Please, support our work with like & comment! ❤️
