DeGRAM | EURJPY decline in the channelEURJPY is in a descending channel between the trend lines.
The price is moving from the upper boundary of the channel and dynamic resistance, which has previously acted as a point of decline.
The chart keeps the harmonic pattern relevant, as well as the descending structure.
We expect the decline to continue.
-------------------
Share your opinion in the comments, and support the idea with a like. Thanks for your support!
EURJPY

DeGRAM | EURJPY retest of trend lineEURJPY is above the descending channel between the trend lines.
The price broke the upper boundary of the channel, formed a harmonic pattern and approached the dynamic resistance.
The chart maintains the descending structure.
We expect the decline to continue after consolidation under the nearest support level.
-------------------
Share your opinion in the comments, and support the idea with a like. Thanks for your support!

Bearish drop?EUR/JPY is rising towards the pivot which is a pullback resistance and could drop to the 1st support.
Pivot: 162.24
1st Support: 160.36
1st Resistance: 164.02
Risk Warning:
Trading Forex and CFDs carries a high level of risk to your capital and you should only trade with money you can afford to lose. Trading Forex and CFDs may not be suitable for all investors, so please ensure that you fully understand the risks involved and seek independent advice if necessary.
Disclaimer:
The above opinions given constitute general market commentary, and do not constitute the opinion or advice of IC Markets or any form of personal or investment advice.
Any opinions, news, research, analyses, prices, other information, or links to third-party sites contained on this website are provided on an "as-is" basis, are intended only to be informative, is not an advice nor a recommendation, nor research, or a record of our trading prices, or an offer of, or solicitation for a transaction in any financial instrument and thus should not be treated as such. The information provided does not involve any specific investment objectives, financial situation and needs of any specific person who may receive it. Please be aware, that past performance is not a reliable indicator of future performance and/or results. Past Performance or Forward-looking scenarios based upon the reasonable beliefs of the third-party provider are not a guarantee of future performance. Actual results may differ materially from those anticipated in forward-looking or past performance statements. IC Markets makes no representation or warranty and assumes no liability as to the accuracy or completeness of the information provided, nor any loss arising from any investment based on a recommendation, forecast or any information supplied by any third-party.

EURJPY - Expecting Retraces Before Prior Continuation HigherHi Traders, on March 12th I shared this "EURJPY Short Term Buy Idea"
We expected to see correction prior to the bullish continuation. You can read the full post using the link above.
Price is moving as per the plan!!!
Based on the current scenario my bullish view still remains the same here.
We have bearish divergence in play based on the moving averages and histogram of the MACD and I expect to see retraces now before further continuation higher.
If you enjoy this idea, don’t forget to LIKE 👍, FOLLOW ✅, SHARE 🙌, and COMMENT ✍! Drop your thoughts and charts below to keep the discussion going. Your support helps keep this content free and reach more people! 🚀
---------------------------------------------------------------------------------------------------------------------
Disclosure: I am part of Trade Nation's Influencer program and receive a monthly fee for using their TradingView charts in my analysis.-

EURJPY 4H | Bullish Breakout & Retest – Next Big Move?The EUR/JPY 4-hour chart presents a compelling bullish breakout setup following a structured downtrend. The market recently broke through a significant resistance zone, indicating potential further upside movement. This analysis outlines key price levels, market structure, and an actionable trading plan.
📊 Market Structure Overview
🔸 Downtrend Reversal: The price was previously trading within a descending channel (highlighted in green), forming lower highs and lower lows.
🔸 Support Confirmation : The price bounced from a strong support zone around 158.500 - 160.000, confirming buyers' interest in this region.
🔸 Breakout & Retest : A strong bullish impulse broke through the 164.500 - 165.000 resistance zone, suggesting a shift in market sentiment.
📌 Key Trading Levels
🔹 Support Zone: 158.500 - 160.000
This area previously acted as a demand zone where buyers aggressively pushed the price higher.
It now serves as a safety net for long positions.
🔹 Resistance Zone (Now Potential Support): 164.500 - 165.000
Price has broken above this level, but a retest could provide an ideal entry for confirmation.
🔹 Next Major Resistance (Target Levels):
TP1: 165.000 → A psychological level and previous resistance.
TP2: 166.020 → A higher resistance zone where price may struggle to break through.
📈 Trading Plan – Long Setup
✅ Entry Confirmation:
Wait for price to pull back to the 164.500 - 165.000 zone.
Look for bullish candlestick patterns (e.g., pin bars, engulfing candles) to confirm buyers stepping in.
🎯 Take Profit Targets:
TP1: 165.000 (Initial resistance level)
TP2: 166.020 (Potential extended bullish move)
🛑 Stop Loss Strategy:
Below 160.038 (Previous structure low & key support level)
Ensures protection against potential fakeouts or trend reversals.
📢 Risk-Reward Ratio:
Aiming for 2:1 or better risk-reward ratio for an optimal trade setup.
📝 Market Outlook & Conclusion
📌 The recent breakout above resistance suggests bullish momentum is strong. However, traders should be patient and wait for a pullback to enter at a better risk-reward level. If price successfully retests and holds above 164.500, there is a high probability of continuation towards 166.020.
🚀 Trading Bias: Bullish – Until market structure shifts or a major rejection occurs at resistance.
📢 Final Trading Tip
🔹 Patience is key! Don’t rush into a trade immediately after a breakout. Wait for confirmation, as false breakouts are common in volatile markets. A successful retest of the broken resistance will provide a low-risk, high-reward entry opportunity.

EURJPY sell signal. Don't forget about stop-loss.
Write in the comments all your questions and instruments analysis of which you want to see.
Friends, push the like button, write a comment, and share with your mates - that would be the best THANK YOU.
P.S. I personally will open entry if the price will show it according to my strategy.
Always make your analysis before a trade

Bullish momentum to extend?EUR/JPY is falling towards the pivot which has been identified as a pullback support and could bounce to the 1st resistance which is a pullback resistance.
Pivot: 162.21
1st Support: 160.29
1st Resistance: 164.35
Risk Warning:
Trading Forex and CFDs carries a high level of risk to your capital and you should only trade with money you can afford to lose. Trading Forex and CFDs may not be suitable for all investors, so please ensure that you fully understand the risks involved and seek independent advice if necessary.
Disclaimer:
The above opinions given constitute general market commentary, and do not constitute the opinion or advice of IC Markets or any form of personal or investment advice.
Any opinions, news, research, analyses, prices, other information, or links to third-party sites contained on this website are provided on an "as-is" basis, are intended only to be informative, is not an advice nor a recommendation, nor research, or a record of our trading prices, or an offer of, or solicitation for a transaction in any financial instrument and thus should not be treated as such. The information provided does not involve any specific investment objectives, financial situation and needs of any specific person who may receive it. Please be aware, that past performance is not a reliable indicator of future performance and/or results. Past Performance or Forward-looking scenarios based upon the reasonable beliefs of the third-party provider are not a guarantee of future performance. Actual results may differ materially from those anticipated in forward-looking or past performance statements. IC Markets makes no representation or warranty and assumes no liability as to the accuracy or completeness of the information provided, nor any loss arising from any investment based on a recommendation, forecast or any information supplied by any third-party.

DeGRAM | EURJPY continues to grow in the channelEURJPY is in a descending channel between the trend lines.
The price is moving from the lower boundary of the channel, support level and lower trend line.
The chart has held above the 38.2% retracement level, the harmonic pattern persists.
We expect the growth to continue.
-------------------
Share your opinion in the comments, and support the idea with a like. Thanks for your support!

EURJPY | 17.03.2025SELL 162.000 | STOP 162.500 | TAKE 161.300 | Intraday movement signal from local resistance.

EUR/JPY Trade Setup: Buying the Dip Toward 160 for a 1:2.5 R/RSince reaching a low around 155 at the beginning of August, EUR/JPY has been trading within a defined range.
Earlier this March, the pair once again tested the lower boundary of this range and, as before, rebounded strongly. A higher low was established at the start of this week, suggesting that 159 may now serve as a new base of support.
In my view, EUR/JPY is likely to continue its upward trajectory, and a move toward 165 could materialize in the near future.
Conclusion:
Pullbacks toward the 160 area should be considered potential buying opportunities. With a stop-loss set around 158 and a target at 165, this setup offers an attractive risk-to-reward ratio of approximately 1:2.5.
Disclosure: I am part of Trade Nation's Influencer program and receive a monthly fee for using their TradingView charts in my analyses and educational articles.

EURJPY forming a top?EURJPY - 24h expiry
Although the bulls are in control, the stalling positive momentum indicates a turnaround is possible.
There is no sign that this bullish momentum is faltering but the pair has stalled close to a previous swing high of 162.36.
This is negative for short term sentiment and we look to set shorts at good risk/reward levels for a further correction lower.
Preferred trade is to sell into rallies.
Although the anticipated move lower is corrective, it does offer ample risk/reward today.
We look to Sell at 162.30 (stop at 163.22)
Our profit targets will be 159.68 and 157.60
Resistance: 164.15 / 166.70 / 169.90
Support: 160.75 / 159.35 / 157.60
Risk Disclaimer
The trade ideas beyond this page are for informational purposes only and do not constitute investment advice or a solicitation to trade. This information is provided by Signal Centre, a third-party unaffiliated with OANDA, and is intended for general circulation only. OANDA does not guarantee the accuracy of this information and assumes no responsibilities for the information provided by the third party. The information does not take into account the specific investment objectives, financial situation, or particular needs of any particular person. You should take into account your specific investment objectives, financial situation, and particular needs before making a commitment to trade, including seeking advice from an independent financial adviser regarding the suitability of the investment, under a separate engagement, as you deem fit.
You accept that you assume all risks in independently viewing the contents and selecting a chosen strategy.
Where the research is distributed in Singapore to a person who is not an Accredited Investor, Expert Investor or an Institutional Investor, Oanda Asia Pacific Pte Ltd (“OAP“) accepts legal responsibility for the contents of the report to such persons only to the extent required by law. Singapore customers should contact OAP at 6579 8289 for matters arising from, or in connection with, the information/research distributed.

EURJPY TO BUY (JPY BOJ NEWS THIS WEEK)As BOJ news is ahead for the Yen pairs (JPY) this week, we can see EURJPY is looking to rally up against the resistance. Therefore, we are looking to buy.
Entry:162.10
TP: 162.30-163.00

EURJPY hit daily trend line, big resistance!Intraday Update: Following the debt brake news, the EURJPY hit/rejected the daily trend line at 162.33 which does suggest this is massive resistance for the pair.

EURJPY BUY/LONG 2HBy utilizing Fibonacci retracement levels, historical patterns, , we can formulate a hypothesis that the market might follow a similar trajectory if bearish sentiment prevails.

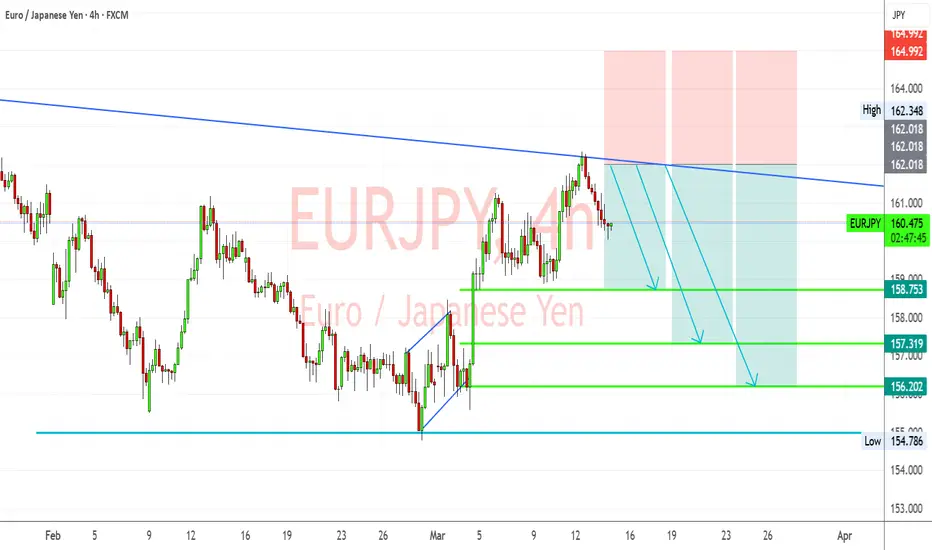
EUR/JPY Rejection at Trendline – Bearish Move Ahead?EUR/JPY 4-hour chart is respecting a long-term descending trendline, acting as dynamic resistance. Price recently tested this trendline near 162.018 - 164.073 and is now rejecting it, indicating a potential bearish move.
Bearish Confirmation & Entry:
Price failed to break above the 162.018 - 164.073 resistance zone, confirming a potential sell opportunity.
A downward movement is expected, targeting key support levels as marked.
Target Levels:
First Take Profit (TP1): 158.753 (Minor support zone)
Second Take Profit (TP2): 157.319 (Stronger support)
Third Take Profit (TP3): 156.202 (Significant demand area)
Final Take Profit (TP4): 154.786 (Major support and previous low)
Risk Management:
Stop-loss: Above 162.018 to protect against a potential breakout.
The trade setup offers a high risk-to-reward ratio, making it a strong candidate for a short position.
EURJPY INTRADAY bullish breakout confirmation neededThe EUR/JPY currency pair price action sentiment remains bullish, underpinned by the prevailing long-term uptrend. Recent intraday movements indicate a bullish breakout above the previous resistance level, which has now established itself as a new support zone.
Key Levels and Price Action
The critical trading level to watch is 160.26, representing the previous consolidation range. A corrective pullback to this level, followed by a bullish rebound, could signal continued upward momentum. In this scenario, the pair may aim for upside resistance levels at 162.58, 163.22, and 163.66 over a longer timeframe.
However, if the 161.26 support level fails to hold and there is a confirmed daily close below it, the bullish outlook would be invalidated. This breakdown could trigger a deeper retracement, targeting the 160.55 support level, followed by 159.10.
Conclusion
The sentiment remains bullish as long as the 161.26 support level holds, with potential upside targets at 162.58, 163.22, and 163.66. A break below 161.26, however, would shift the outlook to bearish, signaling a potential move towards 160.55 and 159.10. Traders should closely monitor price action and daily closes around the key support to assess sentiment shifts and trading opportunities.
This communication is for informational purposes only and should not be viewed as any form of recommendation as to a particular course of action or as investment advice. It is not intended as an offer or solicitation for the purchase or sale of any financial instrument or as an official confirmation of any transaction. Opinions, estimates and assumptions expressed herein are made as of the date of this communication and are subject to change without notice. This communication has been prepared based upon information, including market prices, data and other information, believed to be reliable; however, Trade Nation does not warrant its completeness or accuracy. All market prices and market data contained in or attached to this communication are indicative and subject to change without notice.

EUR/JPY Technical Analysis | 2H Chart
📉 EUR/JPY is currently showing signs of rejection from a key descending trendline (green) after a strong bullish move.
📌 Key Observations:
✅ Resistance Zone (Purple Box): Price attempted to break but faced rejection.
✅ Support Levels: Watching 160.617 and lower 158.519 for potential downside targets.
✅ Bearish Momentum: The price is reacting from resistance, suggesting a possible short-term pullback.
✅ Breakout Scenario: A break above 161.834 could trigger bullish continuation toward 162.500+.
💡 Trading Plan:
🔸 If price re-tests resistance and holds, expecting a potential drop toward the 158.500 region.
🔸 A confirmed breakout above 161.834 could invalidate the bearish bias and lead to further upside.
📊 Keep an eye on upcoming economic events for volatility!
---

EUR_JPY WILL GROW AFTER PULLBACK|LONG|
✅EUR_JPY is trading in an
Uptrend and the pair made a
Bullish breakout of the key
Horizontal level of 161.000
Which is now a support
And the pair is now making
A local pullback but we
Are bullish biased and after
The retest of the new support
We will be expecting a
Further move up
LONG🚀
✅Like and subscribe to never miss a new idea!✅

EURJPY: Will Start Falling! Here is Why:
Remember that we can not, and should not impose our will on the market but rather listen to its whims and make profit by following it. And thus shall be done today on the EURJPY pair which is likely to be pushed down by the bears so we will sell!
Disclosure: I am part of Trade Nation's Influencer program and receive a monthly fee for using their TradingView charts in my analysis.
❤️ Please, support our work with like & comment! ❤️

EURJPY INTRADAY Bullish breakout supported at 161.26The EUR/JPY currency pair price action sentiment remains bullish, underpinned by the prevailing long-term uptrend. Recent intraday movements indicate a bullish breakout above the previous resistance level, which has now established itself as a new support zone.
Key Levels and Price Action
The critical trading level to watch is 161.26, representing the previous consolidation range. A corrective pullback to this level, followed by a bullish rebound, could signal continued upward momentum. In this scenario, the pair may aim for upside resistance levels at 162.58, 163.22, and 163.66 over a longer timeframe.
However, if the 161.26 support level fails to hold and there is a confirmed daily close below it, the bullish outlook would be invalidated. This breakdown could trigger a deeper retracement, targeting the 160.55 support level, followed by 159.10.
Conclusion
The sentiment remains bullish as long as the 161.26 support level holds, with potential upside targets at 162.58, 163.22, and 163.66. A break below 161.26, however, would shift the outlook to bearish, signaling a potential move towards 160.55 and 159.10. Traders should closely monitor price action and daily closes around the key support to assess sentiment shifts and trading opportunities.
This communication is for informational purposes only and should not be viewed as any form of recommendation as to a particular course of action or as investment advice. It is not intended as an offer or solicitation for the purchase or sale of any financial instrument or as an official confirmation of any transaction. Opinions, estimates and assumptions expressed herein are made as of the date of this communication and are subject to change without notice. This communication has been prepared based upon information, including market prices, data and other information, believed to be reliable; however, Trade Nation does not warrant its completeness or accuracy. All market prices and market data contained in or attached to this communication are indicative and subject to change without notice.

EURJPY Short Term Buy IdeaH4 - Bullish trend pattern
Expecting corrections now and then potential continuation higher until the two strong support zones hold.

Bullish rise?EUR/JPY has reacted off the pivot which is a pullback resistance and could potentially rise to the 1st resistance which is also a pullback resistance.
Pivot: 161.27
1st Support: 159.43
1st Resistance: 163.74
Risk Warning:
Trading Forex and CFDs carries a high level of risk to your capital and you should only trade with money you can afford to lose. Trading Forex and CFDs may not be suitable for all investors, so please ensure that you fully understand the risks involved and seek independent advice if necessary.
Disclaimer:
The above opinions given constitute general market commentary, and do not constitute the opinion or advice of IC Markets or any form of personal or investment advice.
Any opinions, news, research, analyses, prices, other information, or links to third-party sites contained on this website are provided on an "as-is" basis, are intended only to be informative, is not an advice nor a recommendation, nor research, or a record of our trading prices, or an offer of, or solicitation for a transaction in any financial instrument and thus should not be treated as such. The information provided does not involve any specific investment objectives, financial situation and needs of any specific person who may receive it. Please be aware, that past performance is not a reliable indicator of future performance and/or results. Past Performance or Forward-looking scenarios based upon the reasonable beliefs of the third-party provider are not a guarantee of future performance. Actual results may differ materially from those anticipated in forward-looking or past performance statements. IC Markets makes no representation or warranty and assumes no liability as to the accuracy or completeness of the information provided, nor any loss arising from any investment based on a recommendation, forecast or any information supplied by any third-party.

EURJPY Technical Analysis! SELL!
My dear friends,
EURJPY looks like it will make a good move, and here are the details:
The market is trading on 160.92 pivot level.
Bias - Bearish
Technical Indicators: Supper Trend generates a clear short signal while Pivot Point HL is currently determining the overall Bearish trend of the market.
Goal - 159.03
Recommended Stop Loss - 161.65
About Used Indicators:
Pivot points are a great way to identify areas of support and resistance, but they work best when combined with other kinds of technical analysis
———————————
WISH YOU ALL LUCK
