LONG EUR/JPY from 166.87It may have escaped some traders notice that the JPY has been hammered in the last few months.
So much so that GBP/JPY hit 200.49 earlier today, USD/JPY hit 160.00 and EUR/JPY hit 171.65.
Some of these are historic highs, in fact USD/JPY is a 30 year high.
I'm unaware of any intervention by the BOJ that would cause the 570 pip fall in USD/JPY (mirrored EUR and GBP) but all the signs are that JPY SELLERS are steaming back into this market and we may see a return to the recent highs.
Getting LONG here looks a no brainer as we could see this pair go from WS1 at 166.00 all the way back to WR1 at 171.00 and maybe even higher.
The major concern would be if the BOJ DOES intervene which would see the JPY rise sharply.
So get LONG this pair with breakeven stops and with luck we could see a shed load of pips on offer.
Eurjpyanalysis

I'll show you the EURJPY where the buying force is holding down Hi friends, I brought the FOREX interesting charts
The buying force is making adjustments by beating the sell-off and rising.
If the Fibonacci 0.618 section is set as the primary target and breaks upward, the AB=CD pattern can reach the 1 value D

What is EURJPY's next move that is rising well?!Hello, guys.
This is ESS team.
We are cheering for your safe trading.
So, Let's talk about "EURJPY".
It is pleasure to RISING well.
Of course, We prepare for the EURJPY's next movement.
:::::::::::::::
Currently, It's RISING with middle line's support within the rising channel.
If candle is resisted at the GREEN line,
It could temporarily fall to the bottom line of the channel.
If it breaks strongly through the GREEN line OR the top of the channel, and RETEST,
The LONG position will be safe.

EURJPY - Bearish Crab Pattern Indicates Potential ReversalEURJPY is currently showing signs of a Bearish Crab Harmonic Pattern (XABCD) on the 4-hour chart, indicating a potential reversal in trend. Additionally, the price is approaching a significant trendline, further supporting the bearish bias.
Bearish Crab Harmonic Pattern (XABCD):
The formation of a Bearish Crab Harmonic Pattern suggests that the price is likely to reverse downwards from Point D. This pattern typically indicates a high probability of a trend reversal.
4-Hour Trendline:
The price is currently at a 4-hour trendline, adding confluence to the potential bearish scenario. A breach below this trendline could signal further downside momentum.
Entry, Stop Loss, and Take Profit Levels:
Entry: 165.900
Stop Loss: 167.060
Take Profit Levels:
TP-1: 164.720
TP-2: 163.600
TP-3: 162.450
Risk Management:
It's essential to adhere to proper risk management practices when executing this trade. Position sizing should be adjusted to ensure that potential losses are within acceptable limits relative to account size and risk tolerance.
Conclusion:
In conclusion, the technical analysis suggests a bearish outlook for EURJPY, with the formation of a Bearish Crab Harmonic Pattern and the price approaching a 4-hour trendline. Traders may consider selling at 165.900 with a stop loss at 167.060 and targeting take profit levels at 164.720, 163.600, and 162.450.

EURJPY: Asian foreign exchange increased thanks to the decline oYen falls as USDJPY heads in the direction of a hundred and fifty five
However, the Japanese Yen did little to enhance in opposition to the weaker dollar, with USDJPY buying and selling close to a 34-12 months excessive and close to the a hundred and fifty five level.
The yen weakened whilst a sequence of Japanese officers warned of presidency intervention to help the currency. Traders see USDJPY at a hundred and fifty five as in all likelihood to draw authorities intervention.
Yen weakens beforehand of this Friday`s Bank of Japan Meeting, wherein the important financial institution is predicted to go away hobby prices unchanged after a anciental hike in March. However, the outlook for inflation and boom stays uncertain. The financial system could be carefully watched.

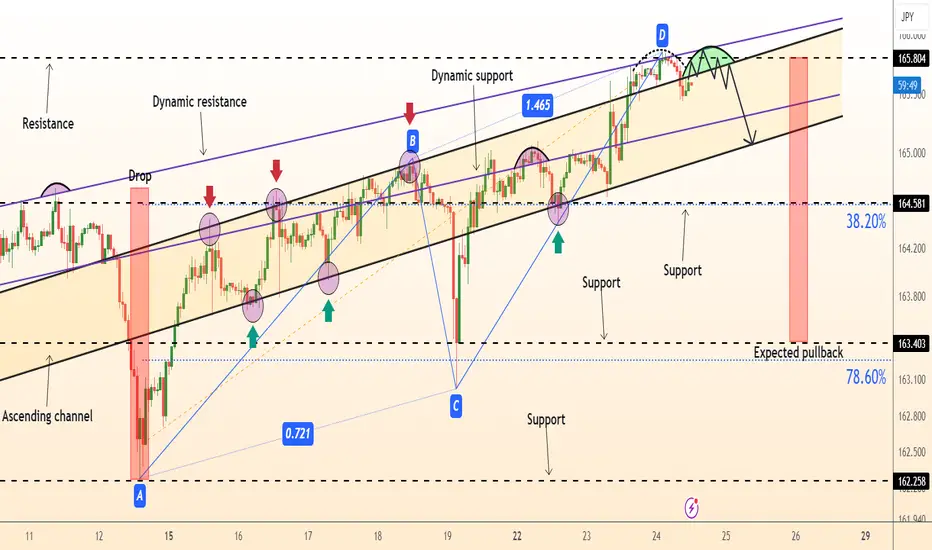
DeGRAM | EURJPY pullback after AB=CD patternEURJPY formed a rounded top near dynamic resistance and returned to the ascending channel.
The chart has formed a pattern AB=CD.
The past touch of the dynamic resistance ended in a reversal of the move.
We are expecting a pullback.
-------------------
Share your opinion in the comments, and support the idea with a like. Thanks for your support!
SHORT EUR/JPY 165.59Trading FX is a risk/reward exercise.
And the greatest reward for the least risk is taking trades that relying on experience.
I've traded Fx for over 20 years so I recognize chart patterns and price movements without really thinking about hem.
If I was teaching how to trade FX I would be advising novice or inexpereinced tarderes NOT to take a trade like this but I'm shorting this pair for the following reasons.
a). Risk/reward is massively in my favour. I can get a SHORT trade on with a 20 pip STOP.
b). We are at WR1 Pivot area and this is a universally known area where SELLERS MAY enter the market.
c). The last 4 15m candles have been doji indecision candles.
d). RSI on multiple time frames is high (70 on H4 and high 60's H1, 30M, 15M).
e). 15M Andean Oscillator sees the red SELL line lifting away from zero.
Put these together and this "looks" a SHORT trade but there's always the chance EUR/JPY BULLS hace not finsihed with this pair.
f). we have a nice candle tweezer pattern on H1 right at resistance.
It should be noted that it's 24 years since this pair was at 165.60 so its highly likely that we are looking at a short term retracement but this could be back to the 200 EMA on M15 which would be 164.91 (+68 pips).
If this trade does take off and there is strong selling momentum then 164.50 is posssible.

DeGRAM | EURJPY pullback from resistanceEURJPY is moving in an ascending channel.
The volatility continues to decline, which means that a new impulse is about to emerge.
The price is approaching the psychological resistance level of 165.
The chart has already reacted twice with a sharp decline after reaching the dynamic resistance.
We expect a pullback to the 50% retracement level after the resistance retest.
-------------------
Share your opinion in the comments and support the idea with like. Thanks for your support!

DeGRAM | EURJPY pullback from the channel boundaryEURJPY is moving in a descending channel.
The chart has reached a strong resistance at 164.500
We think that after retesting the resistance, the price will fall back to the 38% retracement level.
-------------------
Share your opinion in the comments and support the idea with like. Thanks for your support!

EURJPY 1H ProjectionEURJPY 1H Projection
I'm bearish on EURJPY
As per Elliott Wave 1:1 is completed and I can see bearish on EURJPY.
Thanks for support.

EURJPY HEAD AND SHOULDERS BREAKOUT SHORTWe expect further downside on this pair, signalled by the formation head and shoulders pattern breakout. We can also see the breakout of a short-term trendline and key level supports our directional basis

EURJPY SELLWelcome . My analysis of the EURJpy pair on the four-hour frame. Everything is explained in the analysis. Please comment if there is ambiguity in the analysis. Or you didn't understand anything. I will be happy to respond. Good luck everyone

EURJPY SELL | Day Trading AnalysisHello Traders, here is the full analysis.
I think we can soon see more fall from this range! GOOD LUCK! Great SELL opportunity EURJPY
I still did my best and this is the most likely count for me at the moment.
Support the idea with like and follow my profile TO SEE MORE.
Traders, if you liked this idea or if you have your own opinion about it, write in the comments. I will be glad 🤝
Patience is the If You Have Any Question, Feel Free To Ask 🤗
Just follow chart with idea and analysis and when you are ready come in THE GROVE | VIP GROUP, earn more and safe, wait for the signal at the right moment and make money with us

EURJPY Analysis (12th April 2024)
Market Analysis PT2/2 (12th April 2024)
EURJPY Analysis
On the 4 hour timeframe, price action has created a a nice support and resistance of about 40 pips wide. This tells us that price on EJ is currently consolidating.
There are 2 potential scenarios here:
1) Price pushes higher, breaking through the 4 hour resistance, and retesting it before going higher. I am leaning towards a bullish Bias due to how the higher timeframe on the weekly and daily is also bullish.
2) IF price decided to break the support, i will wait until the over all Daily Orderblock fails, before looking for potential Sells.

EURJPY - Long active ✅Hello traders!
‼️ This is my perspective on EURJPY.
Technical analysis: Here we are in a bullish market structure from 4H timeframe perspective, so I look only for long position. I expect bullish price action from here as there is a confluence of rejection from bullish order block + FIBO 0.618 level + institutional big figure 164.000.
Fundamental news: Tomorrow we will see result of Interest Rate in Europe, followed by ECB Press Conference, news with high impact on currency.
Like, comment and subscribe to be in touch with my content!

EURJPY Long (215-275 Pips)Thursday, 04.04.2024
We took the previous weekly low and touched my 8 EMA.
On the daily timeframe, we witnessed a strong rejection with momentum from my daily VWAP low.
Now, I wait for a pullback before buying. Currently, we are at a 4-hour resistance level, so I'll wait patiently, but my bias is long. There's a chance for a push down to hit my 0.382 Fibonacci level.
Passive entry module

EUR/JPY LongsEuro Looks Stronger then the Yen,
And We're Respecting Significant Discount Arrays, So am Long EJ.

EURJPY - Mar. 6th, 2024BUY/LONG ZONE (GREEN): 161.550 - 166.700
DO NOT TRADE/DNT ZONE (WHITE): 159.750 - 161.550
SELL/SHORT ZONE (RED): 155.710 - 159.750
Monthly: Bullish
Weekly: Bullish
Daily: Bullish
4H: Bullish
Previous bearish trend has been labeled along with the DNT area and the initial bullish zone that price broke into to flip the trend. Currently price is onto the next bullish zone and structure is holding well in step up patterns. Price has already tested 163.450 twice on the daily, looking for 4h structure to develop back as bullish and test a third time, or for price to pullback down to the 161.900 level at the top of the zone. It would be more risky if price pulls back to 161.900 level as this would be the second test (daily timeframe) after the 4h price had confirmed it as bullish.
This is what I would personally look at before entering trades, everything is subject to change on a daily basis and as I analyze different timeframes and ideas.
ENTERTAINMENT PURPOSES ONLY, NOT FINANCIAL ADVICE!

EURJPY: the euro weakensIn Europe, EUR/USD fell 0.3% to 1.0789, near a five-week low, after data released earlier on Thursday showed German Retail Sales unexpectedly fell 1.9 % over February, illustrating the difficulties Europe's largest economy is suffering in the first quarter.
European Central Bank officials have become very dovish of late, with board member Piero Cipollone the latest to hint at an interest rate cut as soon as June.
“Wage growth appears to be on a gradual adjustment path over the medium term towards a level consistent with our inflation and productivity growth targets, in line with our inflation and productivity growth targets,” Cipollone told an event in Brussels on Wednesday. consistent with predictions".

EURJPYPair : EURJPY ( Euro / Japanese Yen )
Description :
Completed " 1234 " Impulsive Waves
Break of Structure
RSI - Divergence
Falling Wedge as an Corrective Pattern in Short Time Frame with the Breakout of Upper Trend Line

EURJPY:🟢Another bullish move...🟢(Details on caption)
Well, by examining the 1-hour EURJPY chart we can figure out the price has the potential to rise after collecting the sell-side liquidity.
In this case, we can define the bullish FVG which is below the sell-side liquidity, also this FVG aligns with the 50% previous upward leg and we have a lot of buy-side liquidity that can defined as targets.
All in all, we can expect the price to move lower to collect the sell side liquidity then hit the FVG, and then we will look for an LTF confirmation.
💡Wait for the update!
🗓️01/03/2024
🔎 DYOR
💌It is my honor to share your comments with me💌

EUR-JPY - WEEKLY - Reversal from here?EUR-JPY - WEEKLY - Reversal from here?
I still reaming neutral bullish for EUR-JPY , i'l became bearish when we will see the first cut rate from ECB.

DeGRAM | EURJPY trend continuation opportunity to shortEURJPY tested the upper border of the descending channel, then dropped.
The market bounced off the level of 163.500. The support level became resistance.
Price action is printing lower lows and lower closes, indicating a bearish trend.
We expect completion of the AB=CD pattern, so the price is likely to test the support level.
-------------------
Share your opinion in the comments and support the idea with like. Thanks for your support!
