Retesting Hello everybody!
The price as you can see broke the resistance line and now retesting it.
The price is also at the 60% fib level on 4h chart
There is a high probability that the price will go up.
Always use stop loss
What do you think about this idea?
Eurjpyanalysis

EUR/JPY Short Trade UpdateHey Guys!
As you know, I'm currently waiting for a pullback to at least 131.67 for a short entry with the stop loss at 133.68 and the main target at 114. 40 .
On the last 4h move up I didn't get the pullback to my entry level at 131.67 by roughly 8 pips!(Wha-----t?)
So I've been watching the lower time frames for signs of short term long strength to see if I can get that pullback.
In this video, I show how I was able to tell that we will be getting a move down for the last week or two. Just a short explanation of reading strength of the longs or shorts through price action.
So I'll keep you guys updated with this set up!
Have a great day!
Ken
Disclaimer: This is not Personal Financial Advice.

EURJPY RISKY LONGS 📉📉📉📉 Expecting bullish price action on this pair as price takes out weekly low that means a intra-week reversal should occur, price made a bullish bos retraced back and failed to make the low lower, a h4 bullish closure would be a nice confirmation to long it for 2.5R
What do you think ? Comment below..

Short opportunity on EURJPY for this week??Share your idea in the comment section about this pair and let's debate
Happy New Year, Michel_FRX
DISCLAIMER:
1. Be aware this is not financial advice so trade carefully and have stop loss for sure
2. Past performance is not indicative of future results.

EURJPY - WAVE (I) IS ENDING. BULLISH?Wave (i) should complete soon (Or just completed)
We are looking for Bullish setup this week.
The Entry Level should be the safest area for Long.
Good Luck

Trading Idea Regarding EURJPYThis Pair is going Bullish for Time Being
1-Double Bottom Chart Pattern on 1 hour Time Frame
2-Strong Divergence( indication of possible Reversal of downtrend)
kindly like and fallow it really encourage me to post good stuff for you

EURJPY Short Bias .Waiting for Pullback for Short Entry.Hey Guys!
The Weekly(longterm) bias is short. Or in other words, price is likely to reach 114.40 before reaching 133.68.
So I'm waiting for a pullback to at least 131.67 or ideally to 132.68 for a short entry with a stop loss at 133.68 and its main target at 114.40.
Keep in mind, this is assuming the lower time frame confirmation retains its integrity of short strength confirmation.
I'll keep you guys updated!
Have a great day!
Ken

EURJPY Descending Channel Pattern#EURJPY Hello trader, I hope are good and safe. Today I opened the chart of #EURJPY for 15 MIN and analyzed it then I see that this chart has made a DESCENDING TRIANGLE PATTERN, So I hope #EURJPY will go downside,
Now Nice opportunity for short.
If you have any query then leave a COMMENT, LIKE and FOLLOW.
Keep Supporting And Thank You..

EUR/JPY SELL IDEAHey tradomaniacs,
welcome to a new free trading-setup.
EUR/JPY :Daytrade-Preparation
Notice: Waiting for confirmation!
Market-Sell: 129.435
Stop-Loss: 129.740
Point of Risk-Reduction: 129.145
Take-Profit: 128.030
Stop-Loss: 28 pips
Risk: 0,5% -1%
Risk-Reward: 5,0
LEAVE A LIKE AND A COMMENT - I appreciate every support! =)
Peace and good trades
Irasor
Wanna see more? Don`t forget to follow me

EURJPY Trading IDEAHello Friends,
We are into a very strong selling zone for EURJPY. From my analysis it's a short time for this pair. There are multiple rejection from the trend area. Now it is retesting this pair. I hope after retest price will go short.
It's an analysis and my trading idea. You always trade at your own risk. Where trading is always risky.
Happy Trading!
Thank you!

EURJPY SELLEURJPY waiting for a pull back to the 78.6 fib level and broken support/consolidation before we sell to major support level of 127.650

Eurjpy looking bulish are you ready ?Eurjpy looking bulish are you ready? we expect bullish in 15Mins market break the structure now time to bullish for H4 supply retested

Eurjpy sell setup dont missed entry market failed make HHEurjpy sell setup dont missed entry market failed make HH we expecting bearsih move ready don't missed to follow likes and comments thanks

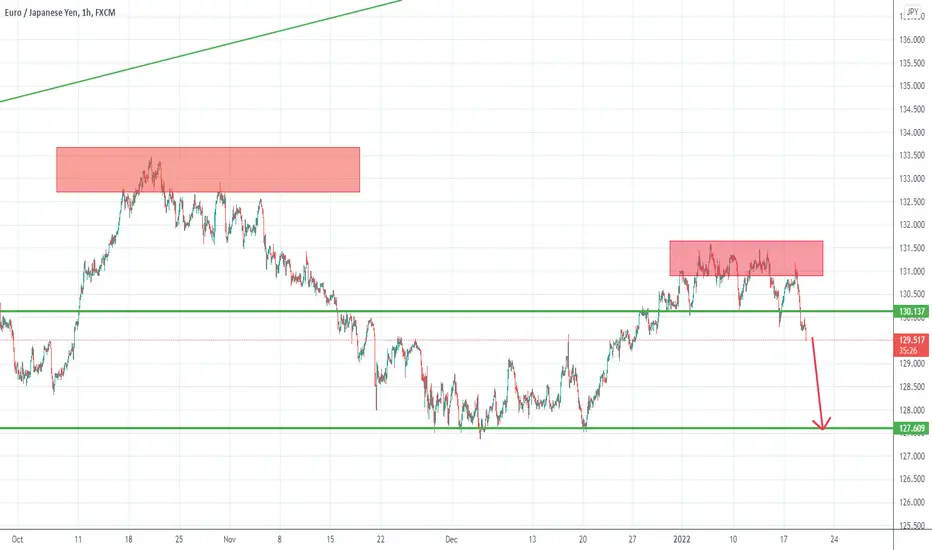
EurJpy can drop to 127.50 zone supportSo far, the month of January was a month of consolidation and distribution for EurJpy, with the price moving between 130 and 131.50
Yesterday the pair has broken under important 130 support and we can expect continuation to the downside
At this moment A lower high is in place for this pair and I favor short trades towards 127.50 support
Sell rallies around 130 can be a good strategy


EURJPY SHORTS 📉📉📉Expecting bearish price action from this area as price shifted the market structure from bullish into bearish, we had a bearish bos. Right now we should retrace back into bearish orderblock h4 + filling the bearish imbalance and then make another leg to the downside.
What do you think ? Comment below..

EURJPY Ascending Channel Pattern#EURJPY Hello trader, I hope are good and safe. Today I opened the chart of #EURJPY for 15 Min and analyzed it then I see that this chart has made a ASCENDING CHANNEL, So I hope #EURJPY will go downside,
Now Nice opportunity for short.
If you have any query then leave a COMMENT, LIKE and FOLLOW.
Keep Supporting And Thank You..

EURJPY ShortEURJPY! Just waiting for a sell confirmation from this zone. Market opens are strange and do have manipulation, so we wait until we get our candle confirmation on the smaller timeframes to sell to the major support level

EURJPY analysis with 2 TPs 03/03/2021as we can see this instrument was up trending in an ascending Parallels channel and there are no majeure resistances on its way,
so we can speculate 2 TPs where we may have some Resistance so we can capitalize our positions there.
one of the most important confirmations are that the price has touched the Fibonacci projection 161.8% extension level and there is a convention that, once the price touches this level there are over 85% of chances that the price will continue its rally to 261.8% of the same Fibonacci projection, where it has confluences with our Price Action defined 1 TP.

EURJPYHello everyone, and welcome to my TradingView profile, my name is TRADiNG_Club_ and today I am going to analyze XAU/USD, a full technical analysis on different time frames using a translation of market information While doing so, let me give you a personal opinion about it. The next most likely market movement and helps you find and manage market opportunities.
My thoughts are for those who are interested in improving their financial education.
Thank you..

EURJPY | Use the Pull Back to get in.When it comes to EURJPY , a while ago, we've seen a strong impulse to the downside. And got rejected from a previous resistance area, which is now acting as support. Looks like we don't have any resistance till T1. I think T1 area is also a tad weak; so there is a good chance price might break T1 and move towards T2. So you should be cautious when price reaches T1. If price breaches T1 then you could keep the position till T2. If not, make sure to close the half of your position. If you are going long, please make sure to place stop below the previous support area. And only buy when you get a pull back.
If you find this technical analysis useful, please like & share our ideas with the community.
What do you think is more likely to happen? Please share your thoughts in comment section. And also give a thumbs up if you find this idea helpful. Any feedback & suggestions would help in further improving the analysis.
Good Luck!
Disclaimer!
This post does not provide financial advice. It is for educational purposes only! You can use the information from the post to make your own trading plan for the market. But you must do your own research and use it as the priority. Trading is risky, and it is not suitable for everyone. Only you can be responsible for your trading.

EURJPY top-down analysisHello traders, this is the full breakdown of this pair. We will take this trade if all the conditions are satisfied as discussed in the analysis. Smash the like button if you find value in this analysis and drop a comment if you have any questions or let me know which pair to cover in my next analysis.
