EURJPY ANALYSIS After seeing the previous weekly candle close bullish and the past few weeks pushing to the upside we could expect the momentum to continue into weekly highs of 175.000
Eurjpybuy

EURJPY Bullish Breakout!
HI,Traders !
#EURJPY is trading in an
Uptrend an the pair made a
Bullish breakout of the key
Horizontal level of 169.790
Which is confirmed so after
pullback we will
Be expecting a further
Bullish continuation !
Comment and subscribe to help us grow !

EURJPY - Looking To Sell Pullbacks In The Short TermM15 - Strong bearish move.
Lower lows on the moving averages of the MACD.
No opposite signs.
Currently it looks like a pullback is happening.
Expecting bearish continuation until the two Fibonacci resistance zones hold.
If you enjoy this idea, don’t forget to LIKE 👍, FOLLOW ✅, SHARE 🙌, and COMMENT ✍! Drop your thoughts and charts below to keep the discussion going. Your support helps keep this content free and reach more people! 🚀
--------------------------------------------------------------------------------------------------------------------

EURJPYAs our followers may remember, we already secured a great profit on EURJPY.
Now, we're once again waiting for price to revisit our key level — so we can potentially catch another high-probability setup.
📌 Always remember:
The market is unpredictable.
We're not here to predict — we're here to react, using technical analysis, clear setups, proper risk and trade management.
❌ If a level breaks, we don’t panic.
✅ Instead, we patiently wait for a pullback and take advantage of the next smart entry.

EURJPY Long Opportunity EURJPY currently has bullish market directionality and is on a retracement. price is trading above the 50 SMA and we can observe bullish momentum from the RSI trading above the 55 level.
Potentially break and retest zone at 167,550. Awaiting a reaction to this level which could see the bullish trend resuming.

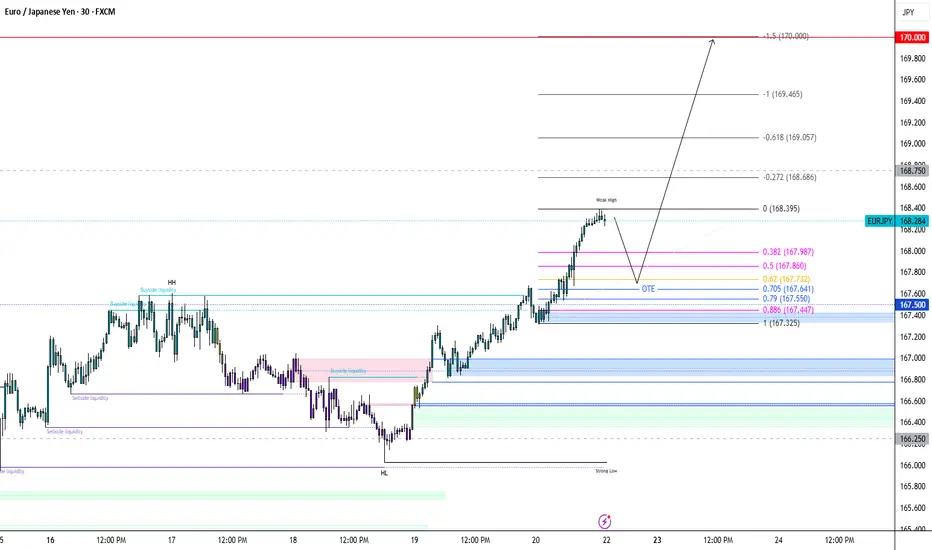
EURJPY: Buy The Dip Or Breakout ContinuationI'm looking to buy EJ...
If price retraces early next week, monitor 167.40–167.70 zone for bullish reaction and confirmation. Wait for M15 bullish BOS after price taps 167.40–167.70. If confirmed, execute long entry from this discounted range.
Entry: 167.40 – 167.70
Stop Loss: 167.10
TP1: 168.60
TP2: 169.20
TP3: 170
If price breaks and closes above 168.60, look for a retest for breakout continuation.
Trigger: Break + H1 candle close above 168.60
Entry on Retest: 168.60 – 168.70
Stop Loss: 168.20
Target: 169.50 – 170.00
Invalidation: H4 structure break below 167.00 would weaken bullish outlook short term
EUR/JPY Breakout Done , Long Setup Valid To Get 200 Pips !Here is my opinion on EUR/JPY , We have a very clear breakout and now i`m waiting for retest to broken res and new support and waiting for good bullish price action to enter a buy trade and targeting at least previous high , if the price go back below my support with daily closure then this idea will not be valid .

EURJPY Trade IdeaEURJPY is maintaining a strong bullish structure on the 1H chart, with price action consistently forming higher highs and higher lows.
My targets are set at the next resistance levels for partial and extended profits, with a final target at the upper resistance if bullish momentum persists.
Stop loss is placed just below the previous swing low.

EUR/JPY 1H: Bullish Falling Wedge Breakout + Target 🧠 Overview of the Setup
The EUR/JPY currency pair has recently completed a Falling Wedge pattern, a classic and powerful bullish reversal formation. This chart structure typically signals the end of a downtrend and the potential beginning of a strong upward impulse.
In this setup, multiple confluences point toward a bullish move, including pattern breakout, structure shift, retest of a dynamic support level, and alignment with major supply/resistance zones.
🔍 Pattern Analysis: Falling Wedge
Definition: A falling wedge is a technical pattern formed by two downward-sloping trendlines — one representing resistance and the other support — that converge. It signals a slowdown in bearish momentum, often preceding a bullish reversal.
Chart Observation: The wedge is well-defined, spanning several trading sessions. As price action tightened toward the apex, bearish momentum began to weaken.
Breakout Trigger: Price broke convincingly above the upper wedge boundary, suggesting the start of a bullish reversal.
✅ Implication: The breakout confirms that buyers have taken control, especially as this move is supported by a structural Change of Character (CHOCH).
📈 Price Action Structure & Key Zones
1. Minor Resistance (Broken)
After the breakout, price encountered a minor resistance zone just above the wedge. This area is now likely to flip into support (a classic breakout retest).
2. Major CHOCH (Change of Character)
A CHOCH indicates a break in market structure — from lower highs and lower lows to higher highs and higher lows.
The break above this level confirms a shift from bearish to bullish sentiment.
3. Curved Support (Black Min Curve)
A rising curved trendline has formed below current price, acting as a parabolic support structure.
This suggests not just a trend reversal, but increasing bullish momentum, as buyers step in at higher levels with each correction.
4. Major Resistance Zone (Target Area)
Price Target: ~164.50 – 165.50
This zone has historically acted as strong supply and is marked for potential take-profit or observation for reversal signals.
The target is derived from both horizontal resistance and the projected height of the wedge pattern.
🎯 Trading Strategy
Component Details
Entry Zone 162.50 – 162.60 (retest of minor resistance + curve support)
Stop Loss Below 162.00 (beneath wedge and curve)
Take Profit 164.50 – 165.50 (major resistance)
Risk/Reward Approx. 1:2.5 to 1:3
🔸 Conservative Entry: Wait for bullish confirmation (bullish engulfing candle or pin bar) on the support retest.
🔸 Aggressive Entry: Market buy after confirmation of curve bounce or on lower timeframe bullish signals.
📊 Volume & Momentum Consideration
Although volume isn’t shown on this chart, volume confirmation on the breakout would significantly strengthen the bullish bias. Look for:
Increasing buy volume on breakout
Lower sell volume on pullbacks
Bullish divergence (if using RSI or MACD)
⚠️ Risk Management & Event Awareness
Be cautious of unexpected JPY-related economic releases (e.g., BOJ announcements, inflation data) that may cause volatility.
If the curved support is broken decisively, this could invalidate the setup, suggesting further consolidation or downside risk.
🧠 Psychological Perspective
The Falling Wedge reflects a market where sellers are gradually losing control — pushing price lower, but with less conviction. As the wedge tightens, bulls prepare to step in. The breakout confirms that sentiment has shifted, and many traders use such setups as entry points for swing or momentum trades.
The curved support line suggests a transition from accumulation to markup phase, which typically leads to faster price expansion as confidence in the uptrend grows.
✅ Summary
✅ Pattern: Falling Wedge (Bullish)
✅ Breakout: Confirmed with CHOCH
✅ Support: Curve trendline acting as dynamic support
✅ Target: 164.50 – 165.50 major resistance
✅ Bias: Bullish (until curve support is broken)
📣 Final Thoughts
This is a high-probability bullish continuation setup backed by price structure, pattern breakout, and support alignment. The risk is well-defined, and reward potential is strong — making this a favorable setup for swing traders or short-term position traders.
💬 Let me know what you think in the comments — are you going long EUR/JPY?
👍 Like and Follow for more setups and breakdowns.

EURJPY Analysis: Range Bounces & BreakoutHello traders!
EURJPY is in a daily range and is offering three trading scenarios.
The first scenario suggests the pair may react bearishly from the currently approached zone, setting up a bounce opportunity that could drive price lower toward the 162.130 area.
The second scenario anticipates a bounce toward the 158.400 area, if price reaches the support zone of the range.
The third scenario anticipates a breakout above the resistance zone, followed by a retest, which could present a strong opportunity for continuation toward the 169.300 area.
Discretionary Trading: Where Experience Becomes the Edge
Discretionary trading is all about making decisions based on what you see, what you feel, and what you've learned through experience. Unlike systematic strategies that rely on fixed rules or algorithms, discretionary traders use their judgment to read the market in real time. It's a skill that can't be rushed, because it's built on screen time, pattern recognition, and the ability to stay calm under pressure.
There's no shortcut here. You need to see enough market conditions, wins, and losses to build that intuition—the kind that tells you when to pull the trigger or sit on your hands. Charts might look the same, but context changes everything, and that's something only experience can teach you.
At the end of the day, discretionary trading is an art, refined over time, sharpened through mistakes, and driven by instinct. It's not for everyone, but for those who've put in the work, it can be a powerful way to trade.

EURJPY Short Term Buy Idea Update!!!Hi Traders, on March 27th I shared this idea "EURJPY - Expecting The Price To Bounce Higher Further"
Expected bullish continuation higher until the two Fibonacci support zones hold. You can read the full post using the link above.
Price moved as per the plan here!!!
Price respected the second Fibonacci support zone and bounced higher.
If you enjoy this idea, don’t forget to LIKE 👍, FOLLOW ✅, SHARE 🙌, and COMMENT ✍! Drop your thoughts and charts below to keep the discussion going. Your support helps keep this content free and reach more people! 🚀
--------------------------------------------------------------------------------------------------------------------
Disclosure: I am part of Trade Nation's Influencer program and receive a monthly fee for using their TradingView charts in my analysis.

EURJPY Short Term Buy Idea Update!!!Hi Traders, on March 27th I shared this idea "EURJPY - Expecting The Price To Bounce Higher Further"
Expected bullish continuation higher until the two Fibonacci support zones hold. You can read the full post using the link above.
Price is moving as per the plan!!!
Price respecting the second Fibonacci support zone and bounces higher. My bullish view still remains.
If you enjoy this idea, don’t forget to LIKE 👍, FOLLOW ✅, SHARE 🙌, and COMMENT ✍! Drop your thoughts and charts below to keep the discussion going. Your support helps keep this content free and reach more people! 🚀
--------------------------------------------------------------------------------------------------------------------
Disclosure: I am part of Trade Nation's Influencer program and receive a monthly fee for using their TradingView charts in my analysis.

EUR/JPY Falling Wedge Breakout | Bullish Potential Ahead🔍 Chart Overview: EUR/JPY – Daily Timeframe
This chart illustrates the price action of the Euro against the Japanese Yen and highlights a Falling Wedge Pattern developing over several months. This is a classic bullish continuation/reversal setup, supported by key technical levels.
📐 1. Chart Pattern: Falling Wedge
A falling wedge is a bullish chart pattern that occurs when the market consolidates between two downward-sloping trendlines.
Characteristics Seen in the Chart:
Converging Trendlines: The upper (resistance) and lower (support) boundaries are both sloping downward, indicating a narrowing price range.
Volume (not shown) usually decreases during the formation, followed by a surge on breakout.
Multiple Touch Points: The price action respects both boundaries multiple times, confirming the pattern's validity.
🏛️ 2. Key Levels
✅ Support Level (Demand Zone):
Marked around 156.000 – 158.000
Multiple bounces from this area, indicating strong buying interest.
Aligned with the lower wedge trendline and historical price reaction zones.
🚫 Resistance Level (Supply Zone / Breakout Zone):
Around 164.500 – 166.000
Price repeatedly failed to break this level, confirming it as a strong supply area.
Confluence of horizontal resistance and the upper wedge boundary.
📊 3. Trade Setup
💼 Entry Strategy:
Confirmation Buy: Enter a long position upon a daily candle close above the wedge resistance (around 166.000).
Aggressive traders may consider an earlier entry near the wedge’s support with a tight stop.
🎯 Target:
The projected target is 172.962, calculated based on the height of the wedge pattern added to the breakout point.
This aligns with a previous swing high area, serving as a logical profit-taking zone.
🛑 Stop Loss:
Positioned at 155.576, just below the key support zone.
This allows the trade room to breathe while protecting against a full pattern failure.
⚖️ 4. Risk Management
Risk-to-Reward Ratio (RRR): Target around 172.962 and Stop Loss at 155.576 offer a favorable RRR of approximately 2.5:1 or more, depending on entry.
Position Sizing: Use appropriate lot size based on your account risk tolerance (e.g., 1-2% of equity per trade).
📅 5. Timeframe Outlook
Medium to Long-Term Setup: Since this is a daily chart, the trade may take weeks to months to fully play out.
Patience and proper trade management are essential.
🔎 6. Additional Notes
Retest Opportunity: If price breaks out, look for a retest of the resistance zone as new support before continuation to the upside.
Fundamental Factors: Keep an eye on EUR and JPY economic data, ECB and BoJ policy announcements, and global risk sentiment, which can influence the pair.
🧭 Professional Takeaway
This is a textbook bullish falling wedge pattern within a well-defined technical structure. The chart provides:
A clear pattern breakout level,
Strong historical support/resistance zones,
A defined risk management plan,
And a realistic price target based on technical projection.
If you are a swing trader or position trader, this setup offers a high-probability opportunity with favorable risk-reward dynamics—provided a breakout is confirmed.

EURJPY Weekly Forecast: Triple Bottom Breakout & Bullish Target Overview of the Chart & Market Structure
The EUR/JPY daily timeframe chart presents a Triple Bottom Pattern, a powerful bullish reversal formation that suggests a potential shift in market sentiment. This pattern occurs when price tests a key support level three times and fails to break lower, indicating strong buying interest at that zone.
Historically, a Triple Bottom leads to a significant trend reversal as sellers lose strength and buyers gain control. If confirmed by a breakout above resistance, this setup could provide a high-probability trading opportunity for swing traders and position traders.
Key Chart Components & Price Action Analysis
1. Triple Bottom Formation
The three bottoms marked on the chart represent repeated failed attempts by sellers to push the price lower:
Bottom 1 (August 2024): The first rejection from the support zone (~155.000) led to a temporary bounce.
Bottom 2 (October 2024): Price retested the same level, but buyers stepped in again, preventing a breakdown.
Bottom 3 (March 2025): The final test of support confirmed a strong accumulation zone, setting the stage for a potential bullish breakout.
In technical analysis, a Triple Bottom is considered a stronger reversal signal than a Double Bottom, as it represents prolonged buying pressure at key levels.
2. Support & Resistance Levels
Support Zone (~155.086): This level has been tested multiple times and remains a solid demand zone, where buyers have consistently entered the market.
Resistance Zone (~166.000): This level represents the neckline of the pattern, which must be breached to confirm a bullish reversal.
Breakout Target (~179.233): If price breaks out above 166.000, the projected target is set at 179.233, based on the height of the Triple Bottom pattern.
Trading Strategy & Entry Plan
1. Entry Point – Waiting for Confirmation
A buy trade should be initiated ONLY after a confirmed breakout above the resistance level (~166.000). Traders should wait for a daily candle close above this level, preferably with high volume, to confirm the breakout.
2. Stop Loss Placement
A stop-loss should be placed below the third bottom (support level) at 155.086 to minimize risk.
This placement ensures that if price invalidates the pattern by moving below the support level, the trade is exited early.
3. Profit Target Calculation
The measured move technique is applied to estimate the target. The height of the pattern (distance from support to resistance) is projected upward from the breakout point.
Target price: 179.233, aligning with historical resistance.
4. Risk-to-Reward Ratio & Position Sizing
The risk-to-reward ratio (RRR) for this setup is favorable, making it an attractive swing trade opportunity.
Traders should adjust position sizes based on risk tolerance, ensuring proper money management principles are applied.
Additional Confirmation Factors
1. Volume Analysis
A breakout with increasing volume will confirm strong bullish momentum.
Weak volume during breakout could indicate a false breakout, requiring caution.
2. RSI & Momentum Indicators
RSI trending above 50 suggests growing bullish strength.
Bullish divergence on RSI or MACD would add further confidence to the trade.
3. Retest of Resistance as Support
Often, after breaking resistance, price retests the breakout level before moving higher.
This could offer a secondary entry opportunity for traders who miss the initial breakout.
Potential Risks & Market Conditions to Watch
False Breakouts – If price fails to sustain above resistance, the pattern could be invalidated.
Macroeconomic Events – Major news events, such as ECB or BOJ policy decisions, could impact EUR/JPY movement.
Geopolitical Uncertainty – Unexpected events may cause volatility and deviation from technical patterns.
Conclusion – High-Probability Bullish Setup
The Triple Bottom Pattern in EUR/JPY is shaping up as a strong bullish reversal setup. If the price successfully breaks above 166.000, a rally toward 179.233 is expected.
📌 Trading Plan Recap:
✅ Entry: Buy above 166.000 (confirmed breakout).
✅ Target: 179.233 (measured move projection).
✅ Stop Loss: 155.086 (below support).
✅ Risk-Reward Ratio: Favorable for swing traders.
This setup aligns well with technical and price action strategies, making it an attractive trade idea for the upcoming weeks.

EUR/JPYWaiting for these levels to tapped in, for a buy to the upside,
Let me know what you guys think?

EURJPY Discretional Analysis: It's Gonna Go UpHonestly, I can’t fully explain it, but my intuition says it’s gonna go up. If I’m right, I’ll make a profit, and if not, I’ll take the loss and move on to the next trade.
Just my opinion, not financial advice.

EURJPY - Expecting The Price To Bounce Higher FurtherH4 - Bullish trend pattern in the form of higher highs, higher lows structure
Strong bullish momentum
Expecting retraces and further continuation higher until the two key Fibonacci support zones hold.
If you enjoy this idea, don’t forget to LIKE 👍, FOLLOW ✅, SHARE 🙌, and COMMENT ✍! Drop your thoughts and charts below to keep the discussion going. Your support helps keep this content free and reach more people! 🚀
--------------------------------------------------------------------------------------------------------------------
Disclosure: I am part of Trade Nation's Influencer program and receive a monthly fee for using their TradingView charts in my analysis.

EUR/JPY Triple Bottom Breakout – Bullish SetupThis chart represents the EUR/JPY currency pair on the daily timeframe. It highlights a Triple Bottom pattern, a bullish reversal formation that signals a potential upward trend after testing strong support multiple times.
1. Chart Pattern Analysis – Triple Bottom Formation
The Triple Bottom is a classic reversal pattern that forms after a downtrend and consists of three distinct lows at nearly the same level. This indicates that sellers attempted to push the price lower but failed three times, suggesting that buying pressure is increasing.
Bottom 1 (August 2024): The price reached a low near 150.344, forming the first support zone.
Bottom 2 (September 2024): The price dropped again to the same support level but bounced back, indicating strong demand.
Bottom 3 (March 2025): The price retested the support for the third time and rebounded, confirming the pattern.
💡 Key Takeaway: The repeated failure to break below the support level suggests that sellers are losing control, and buyers are preparing for a strong move up.
2. Support & Resistance Levels
Understanding support and resistance levels is crucial for identifying entry and exit points:
Support Level (150.344 - 150.125): This zone has acted as a strong demand area where price consistently bounced back.
Resistance Level (167.500 - 170.000): This is the neckline of the Triple Bottom pattern. A breakout above this level confirms the bullish trend.
If the price breaks above the resistance level, it will trigger buying momentum and open the doors for further upside.
3. Trading Strategy & Price Targets
✅ Entry Criteria
The ideal buy entry is after the price breaks above the resistance level (~167.500 - 170.000) with strong bullish momentum and increased volume.
Wait for a daily candle close above the resistance level to confirm the breakout.
🎯 Target Levels (Take Profit - TP)
TP1 (173.001) – First profit-taking level, as the price may encounter some resistance.
TP2 (179.266) – Final bullish target if the breakout holds strong.
📉 Stop Loss (Risk Management)
Stop Loss (SL): Below 150.125, just below the previous support level. This minimizes losses if the price fails to break out.
Risk-to-Reward Ratio: This setup offers a high risk-reward ratio, making it a favorable trade.
4. Market Psychology & Confirmation Signals
The Triple Bottom indicates a strong shift in market sentiment from bearish to bullish.
Confirmation signals to watch for:
✅ Bullish breakout above resistance
✅ Increase in trading volume
✅ Formation of bullish candlesticks (e.g., Engulfing, Marubozu, or Breakout Retest Confirmation)
5. Summary & Final Thoughts
🔹 The Triple Bottom pattern signals a strong reversal with clear upside potential.
🔹 The breakout above resistance (~167.500 - 170.000) will confirm a bullish trend.
🔹 Entry: Buy after breakout confirmation with volume support.
🔹 TP1: 173.001, TP2: 179.266
🔹 SL: Below 150.125 to protect capital.
🚀 Conclusion : This setup presents an excellent long opportunity with a well-defined risk-reward strategy. If the breakout holds, EUR/JPY could see a strong uptrend in the coming weeks.

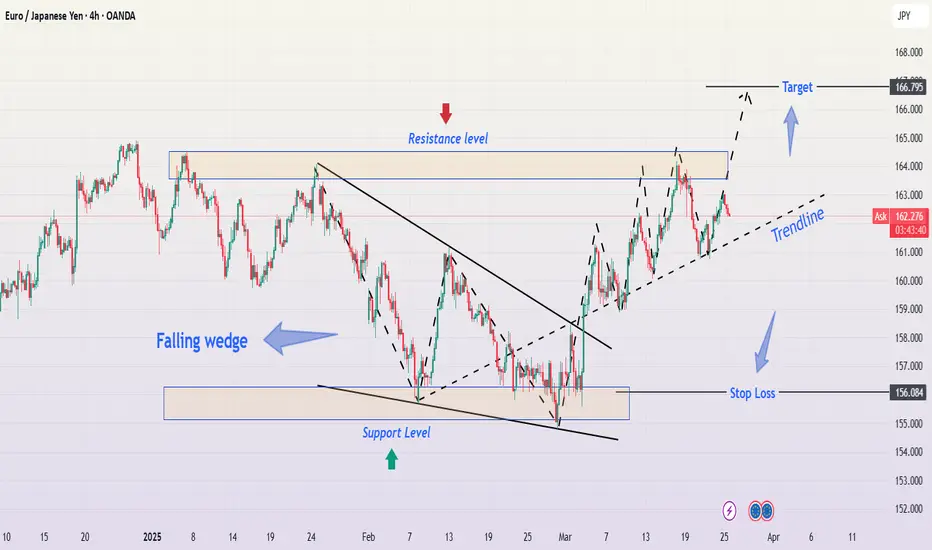
EUR/JPY Breakdown: Falling Wedge Breakout & Bullish SetupThe EUR/JPY 4-hour chart is presenting a well-structured price action setup, featuring a falling wedge breakout, a strong bullish trendline, and key resistance and support levels. This detailed analysis will walk through each aspect of the chart to provide a professional trading perspective.
1. Market Context & Price Action Overview
At the beginning of the chart, EUR/JPY was experiencing a downtrend, characterized by a series of lower highs and lower lows, forming a falling wedge pattern. This pattern is typically a bullish reversal signal, indicating that sellers are losing strength and buyers may take control.
Once the price reached a key support zone near 156.08, it bounced, leading to a breakout of the falling wedge. Since the breakout, the price has been moving in a bullish trend, forming higher highs and higher lows, respecting an ascending trendline.
2. Technical Patterns & Key Levels
🔹 Falling Wedge Pattern – Bullish Breakout
The falling wedge is identified by two converging trendlines sloping downward.
It indicates that bearish momentum is weakening as price compresses.
A breakout above the upper wedge line confirmed the shift in trend direction.
The breakout candle had strong bullish momentum, suggesting increased buyer interest.
🔹 Support and Resistance Levels
📉 Major Support Level (~156.08):
This level acted as a demand zone, where buyers aggressively stepped in.
The price formed multiple rejections at this level before breaking upwards.
A stop-loss placement below this level is ideal for bullish trades.
📈 Resistance Level (~163.50 - 164.00):
This zone has been tested multiple times as price approaches from below.
A break and retest of this resistance would confirm further bullish momentum.
If price faces strong rejection, a short-term pullback to the trendline may occur.
🎯 Final Target (~166.79):
This is the next major resistance level, aligning with previous swing highs.
It serves as a strong take-profit (TP) level for long positions.
If price reaches this level, we may see a consolidation phase or possible reversal.
3. Trend Analysis & Market Structure
📈 Bullish Trendline:
The price has been respecting an ascending trendline, acting as dynamic support.
This trendline connects higher lows, confirming a strong bullish trend.
As long as price stays above this line, buyers remain in control.
📊 Market Structure:
Since breaking out from the falling wedge, the price is forming a classic bullish structure of higher highs and higher lows.
This indicates sustained buyer pressure and a potential continuation toward resistance levels.
4. Trading Setup & Risk Management
📌 Entry Strategy:
Aggressive Entry: After the wedge breakout with a tight stop-loss.
Conservative Entry: Wait for a pullback to the trendline support or a break and retest of resistance at 163.50 - 164.00.
🔻 Stop Loss Placement:
Below 156.08 (previous support zone) to protect against trend invalidation.
Alternatively, below the rising trendline for a dynamic SL approach.
🎯 Take Profit Targets:
TP1: 163.50 - 164.00 resistance zone (Partial profits).
TP2: 166.79 final target, aligning with historical resistance.
5. Market Outlook & Potential Scenarios
✅ Bullish Scenario (High Probability)
If price holds above the trendline and breaks 163.50 - 164.00, we expect a continuation towards 166.79.
The structure remains intact as long as higher highs and higher lows persist.
❌ Bearish Scenario (Low Probability, but Possible)
If price fails at resistance and breaks below the trendline, it could signal a deeper retracement.
A break below 156.08 would completely invalidate the bullish setup, leading to a potential downtrend.
6. Summary & Key Takeaways
Trend Bias: Bullish, supported by a falling wedge breakout and higher highs.
Key Levels: Support at 156.08, resistance at 163.50 - 164.00, final target at 166.79.
Trading Strategy: Buy on retests of trendline or resistance breakouts.
Risk Management: Use dynamic stop-loss levels to minimize downside exposure.
🔹 Final Verdict:
If price remains above support and successfully breaks 163.50 - 164.00, a strong move toward 166.79 is expected. However, traders should remain cautious of trendline breakdowns and manage risk accordingly.
📊 Stay disciplined, follow your trading plan, and always use stop-loss protection! 🚀 #EURJPY #Forex #TradingStrategy #PriceAction
EUR/JPY – Double Bottom Breakout & Trendline Retest, Trade Setup📊 Chart Type: 1-Hour (H1)
💹 Asset: EUR/JPY
📈 Technical Patterns: Double Bottom, Trendline Breakout, Retest
📌 Overview of the Chart
The EUR/JPY chart showcases a bullish reversal setup, characterized by a Double Bottom pattern, a trendline breakout, and a successful retest. This combination suggests a potential continuation towards higher price levels, making it an ideal setup for traders looking for breakout entries.
The price action initially followed a downtrend, but buyers stepped in at key support zones, leading to the formation of a strong reversal pattern. Now, the price is testing a key resistance level, and if it breaks out, we could see a significant upward move.
🟢 Key Technical Analysis Breakdown
1️⃣ Double Bottom Formation – A Bullish Reversal Signal
🔹 The Double Bottom is a classic reversal pattern that forms after an extended downtrend.
🔹 In this case, price found strong support at 160.139, forming two lows (Bottom 1 & Bottom 2), indicating buyer dominance.
🔹 The confirmation of the pattern comes with a break above the neckline at around 162.000, suggesting a shift from bearish to bullish momentum.
2️⃣ Trendline Breakout & Retest
🔹 A descending trendline had been acting as dynamic resistance, pushing prices lower.
🔹 Recently, the price broke above the trendline, signaling a potential trend shift.
🔹 Now, price is retesting the trendline, which is a key factor in confirming whether the breakout is valid.
🔹 If the retest holds, it could trigger a strong bullish move towards the next resistance zone.
📍 Support & Resistance Zones
🔹 Support Level (160.139):
The lowest point in the chart, where price tested twice and formed the Double Bottom.
Buyers stepped in aggressively at this level, preventing further decline.
Stop Loss Placement: Below this support zone for long trades.
🔹 Resistance Zone (163.725 - Target Level):
The previous swing high and a major supply zone.
A breakout above this area could lead to further bullish momentum.
📈 Trading Strategy – How to Trade This Setup?
✅ Bullish Trade Setup (Breakout & Retest Confirmation)
This setup is ideal for traders looking to capitalize on breakout and retest strategies.
📌 Entry:
Wait for a strong bullish candle to confirm the retest of the trendline.
A break above the 162.500 level could be a good entry confirmation.
📌 Target:
First target: 163.725 (Resistance Zone).
If momentum continues, the next upside target could be around 164.500.
📌 Stop Loss:
Below 160.139 (previous support level) to minimize risk.
Alternatively, place it below the trendline retest zone if entering aggressively.
📌 Risk-to-Reward Ratio (RRR):
This trade offers a strong RRR, as the downside risk is limited, while the upside potential is higher.
🔴 Bearish Scenario – What if the Retest Fails?
While the bias is bullish, traders must be prepared for a fake breakout scenario. If price fails to hold above the trendline and neckline, the structure might break down.
📌 Bearish Entry:
If price rejects the retest zone and closes back below 161.500, it could indicate a false breakout.
📌 Target:
160.139 (Support Level).
📌 Stop Loss:
Above the trendline retest zone to protect against unexpected bullish moves.
🔎 Key Takeaways & Final Thoughts
✅ The Double Bottom pattern signals a potential trend reversal.
✅ The trendline breakout & retest adds further confirmation to the bullish bias.
✅ A breakout above 162.500 could accelerate buying pressure toward 163.725.
✅ Risk management is essential: A well-placed stop loss below the support level ensures minimal downside risk.
✅ If price rejects the retest zone, traders should be prepared for a possible bearish reversal.
📌 Overall Bias: Bullish ✅
📌 Trade Confirmation: Needs trendline retest hold + bullish breakout 📈
📌 Key Level to Watch: 162.500 (Breakout Confirmation Zone) 🔥
💡 Pro Tip : Always wait for confirmation before entering a trade. A strong bullish candlestick pattern (e.g., engulfing candle) on the H1 or H4 timeframe could provide extra confidence in the setup! 🚀

EURJPY BUY/LONG 2HBy utilizing Fibonacci retracement levels, historical patterns, , we can formulate a hypothesis that the market might follow a similar trajectory if bearish sentiment prevails.

EURJPY - Bullish Continuation Toward 160.850OANDA:EURJPY is trading within a well-defined ascending channel, with price action respecting both the upper and lower boundaries. The recent bounce off support suggests buyers are maintaining control, supporting a potential continuation of the uptrend.
As long as the price remains above the support level and the channel's lower boundary holds, the bullish structure remains intact.
A potential upside target is 160.850, aligning with the upper boundary of the channel. A break and close above this level could signal further bullish momentum.
However, a breakdown below the support zone would invalidate the bullish scenario and may open the door for a deeper pullback.
Remember, always confirm your setups and trade with solid risk management.
Best of luck!

EURJPY buy signal. Don't forget about stop-loss.
Write in the comments all your questions and instruments analysis of which you want to see.
Friends, push the like button, write a comment, and share with your mates - that would be the best THANK YOU.
P.S. I personally will open entry if the price will show it according to my strategy.
Always make your analysis before a trade
