EURJPY analysisEURJPY quick analysis..
many outcomes.
await a breakout of the consolidation zone being formed..
patience is key, lets see what the markets give up
cheers..
Eurjpybuy

EURJPY SELLPLEASE SEE PREVIOUS BELOW
i am expecting this to go a lot low in a couple of weeks. but as you all know, there will be a reversal.

EURJPY - LONG POSSIBILITYTRENDLINE RETEST + RETRACEMENT ZONE + SUPPORT LINE + YOU CAN TRACE AN HARMONIC PATTERN FOR STRONGER CONFIRMATION, I ALWAYS SUGGEST TO WAIT FOR A COUPLE PULLBACK CANDLES BEFORE ENTRY.//
PS: PLEASE CONFIRM BY YOUR OWN ANALYSIS BEFORE TAKING ANY DECISION ON THIS TRADE


EURJPY - HEAD SHOULDER POSSIBILITYTREND RETEST + SUPPORT + RETRACEMENT ZONE + PULLBACK BULLISH CANDELS
PS: PLEASE CONFIRM BY YOUR OWN ANALYSIS BEFORE TAKING ANY DECISION ON THIS TRADE


EURJPY - MONTHLY TREND - 05. SEPTEMBER 2018WELCOME TO DACAPITAL TRADING!!
GBPUSD 0.89% 0.10% just started moving as expected, quick Timeframe breakdown for free and everybody.
4 HOUR
Bullish movement after taking out 128.350 kl.
DAILY
Price changed direction after taking out low expecting bullish pressure now
WEEKLY
We had a bearish closure taking out some buyers last week, good entry for us!
LEVELS
BUY EURJPY @ 129.580
SL @ 128.110 (145 Pips)
TP @ 131.190 (160 Pips)
MOVE SL TO BE @ HIT OF 100% FIB!
Monthly Trend follow with small RR and Higher Winrate. Be patient!
Enjoy our limited Free Content and Setups,
leave us a like and Comment!!
DACAPITAL TRADING


EUR/JPY Long Term Bullish OpportunityEUR/JPY moves around between support & resistance price between 129.658 to 133.123. Not market price retraces from support to bullish trend, So there is a good opportunity for bullish until price @ 133.123

EURJPY BUY SETUP WITH FAKE BAr this a good signal ( bullish fakey with pin bar)
Trend: Bullish
Level: 131.529 ( long term support since sep 2017)
Signal: bullish fakey

EURJPY 4H TECHNICAL ANALYSISThree Drive Pattern ...
Buy @ 133.20 for 100 & 200 PIPS ..
Let's Watch !!


EURJPY drop expected towards key level of supportWe’re seeing major support at 131.73 (Multiple 100% Fibonacci extensions, 61,8% Fibonacci extension, horizontal swing low support) and a possible bounce could occur at this level. Our next major level of resistance is 132.73 (Fibonacci retracement, horizontal swing high resistance) and our next major level of support is at 131.16 (Major swing low support).
Stochastic (55,3,1) is seeing major support at 1.8%.
Trading CFDs on margin carries high risk.
Losses can exceed the initial investment so please ensure you fully understand the risks.


EURJPY Break OutEurJpy is showing a nice break-out on the 1 hour time frame and seems to be heading back to 132-132.50. Use these as possible take profits. A stop should be at 131.40 the next support

Buy EURJPY Short Term Based On Multiple TimeframesThis research is for informational purposes and should not be construed as personal advice. Trading any financial market involves risk. Trading on leverage involves risk of losses greater than deposits.
Please comment below and Like if you agree with my analysis.

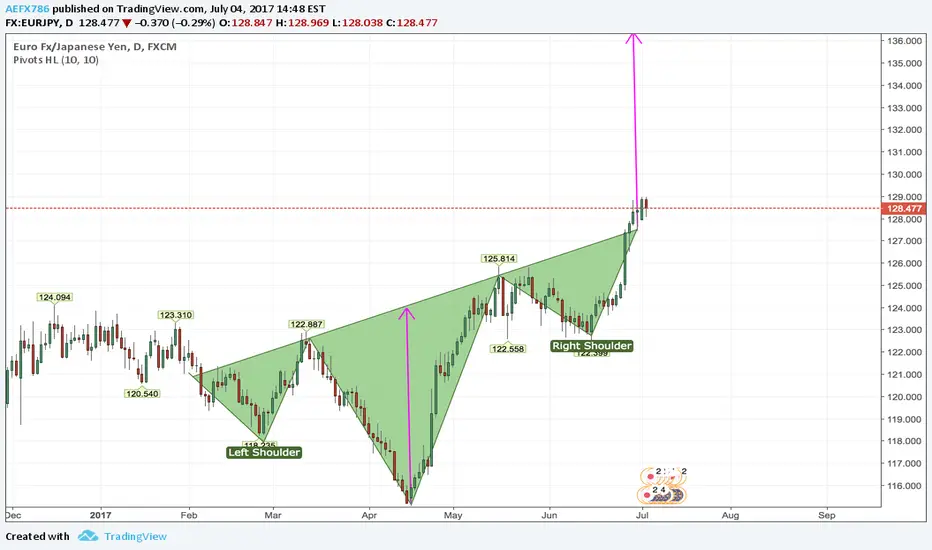
Long EURJPY Inverted H&S Formation Based on Daily +Weekly ChartsWe've got an inverted H&S pattern formation completed on the Daily + Weekly time frames for the EURJPY with a potential long term target of 800+ pips.
This research is for informational purposes and should not be construed as personal advice. Trading any financial market involves risk. Trading on leverage involves risk of losses greater than deposits.
Please comment below and Like if you agree with my analysis.
EURJPY Sell OffAfter weeks of climbing it looks like EURJPY has reached the stop. If failed to break the resistance and after lots of sideways trading it failed to break it again. We can now expect a retest of 126.60. So EURJPY will follow the other JPY pairs.
Use the various mentioned support level as possible take profits. Try to add a long the way down more sell positions (pyramid stacking) and lower your stop loss accordingly.
SL: 131

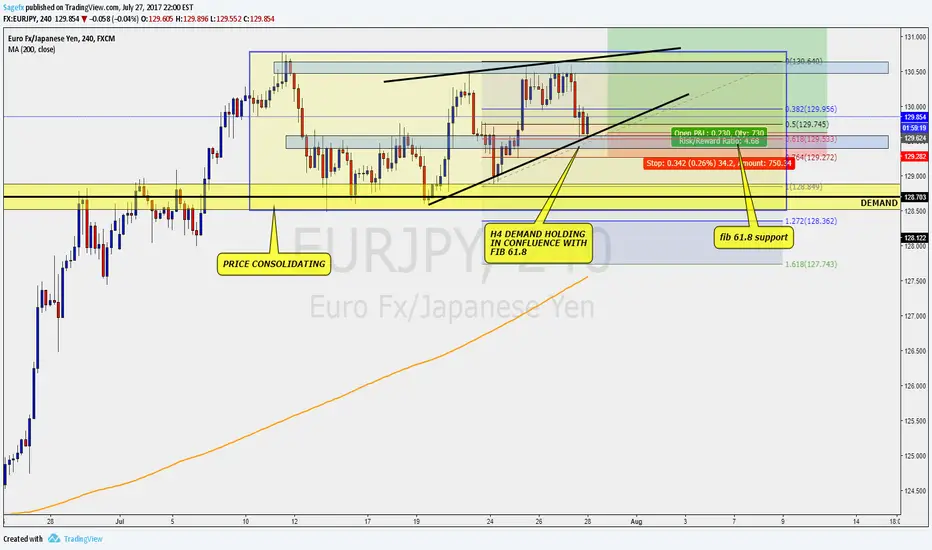
EURJPY - H4 - BUY SETUPEurJpy H4 chart - bullish structure expecting break out to the upside. follow sagefx on instagram for more technical forecasts
EURJPY potential bat pattern and an opportunity for a buy good day everyone
i got on the radar since yesterday an opportunity for a buy
however there was a consolidation that is leading to a bat pattern as a sign for a buy to
the targets is in the showing chart.

EURJPYOur preference: position bought above 127.00 with targets at 128.25 & 129.05 in extension.
Alternative scenario: in break of 127,00, a continuation of the decrease will be envisageable with 126,35 & 125,65 in line of sight.
Comment: a support base on the 127.00 formed and allowed temporary stabilization.
