EURJPY H1 SHORT PRICE ACTION FORECASTPrice structure has formed an "M" pattern with a double top and supported by a bearish divergence from MACD signaling the bearish momentum hovering the pair. Expecting a healthy correction to continue its downward movement allowing the setup for a short entry
The order:
Type: sell-limit
S/L: 29 pips - R:R | 1:2 -
T/P: support level
--
*** If you like the idea, don't be shy, click on like and comment. If you do not agree, just comment ;-) | Thanks for your support!!! ***
Eurjpyforecast

EURJPY Signal - BUY LIMIT !EURJPY
Take 1-2% risk of your account capital.
Personal Note:I do not guarantee for a win or loss, my trading style has over 60% win ratio which is phenomenal for a successful trading career. I simply follow the pure knowledge and let market do its own thing. I am not attached to the results, because i know over a set of trades i always become profitable.
Best Regards.

EURJPY Signal - BUY ZONE !EURJPY
Take 1-2% risk of your account capital.
Personal Note:I do not guarantee for a win or loss, my trading style has over 60% win ratio which is phenomenal for a successful trading career. I simply follow the pure knowledge and let market do its own thing. I am not attached to the results, because i know over a set of trades i always become profitable.
Best Regards.

EURJPY H4 LONG PRICE ACTION FORECAST Although the Euro is currently showing some indecision after some exhaustion from the bulls rally on the London session, the pair remains under bullish dominance. The EMA about to form a golden cross to arrange the uptrend bias from the book finally, with its perfectly HH & HL the price action allows a long entry to the previous demand zone
The order:
Type: buy-limit
S/L: 55 pips - R:R | 1:3 -
T/P: aiming towards the resistance level
--
*** If you like the idea, don't be shy, click on like and comment. If you do not agree, just comment ;-) | Thanks for your support!!! ***

EURJPY Broke Out of Trend!!! Bullish Continuation!!!As we can EURJPY has broken our of trendline and now heading back for a BULLISH Climb. Previously, we expected price level to reach 61.8 fib level before retracement however what we say today was a price rejection off 50.0 fib level breaking 38.2 fib level and currently showing a good potential to reach 23.6 fib level. At which, we have to take note of further bullish signs to for it to break that level or else we could be seeing another rejection off that level.
Kindly hit the LIKE Button if you agree with my analysis and feel free to COMMENT your idea below. As for those who are keen to get daily updates and analysis from me feel free to FOLLOW me. Cheers and Happy Trading!!!


EUR/JPY : Watch Breakout and BUYAfter Bullish engulfing candle can Buy or Wait for Breakdown and Wait for tiny correction bear flag to confirm SHORT Opportunity.
ThankYou

BEARISH Looking For EURJPY...Good Short Opportunity!!!We can see that after the bullish breakout of the trend, we start to see BEARISH retracement taking place. Taking that to consideration, lets keep a BEARISH bias before we look into the technical analysis part of EURJPY. Interestingly, fibonacci retracement shows a nice pattern with price level retesting 23.6 fib level and 38.2 fib level as it falls. Definitely, by drawing a nice trend line we can also yet to see any form of breakout of this BEARISH trend and I expect a continuation in BEARISH movement breaking 50.0 fib level and potentially retesting it. I believe we will see a lower head forming as it heads downward to potentially 61.8 fib level. At the level, there is also a rather strong support level @118.50. Between 61.8 level and the support level forms my strong support area (Red area), if we see a breakout definitely 78.6 is possible. As of now, I will look into a short position to around 61.8 fib level where it could also potentially meet the lower band.
Kindly hit the LIKE Button if you agree with my analysis and feel free to COMMENT your idea below. As for those who are keen to get daily updates and analysis from me feel free to FOLLOW me. Cheers and Happy Trading!!!

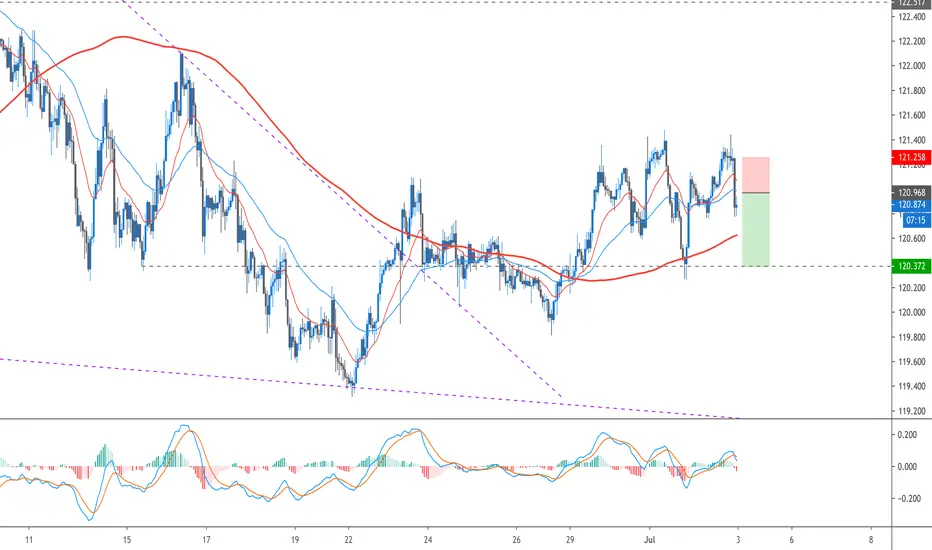
EUR/JPY Short-term Update: 120 pips profit target, SL/TPPrice Action Analysis in EUR/JPY shows that it is ready to drop to the next support level. It is a good time to look for sell trades because the risk is low and the chance of making a profitable sell trade is quite high now.
Sell Entry: 120.45-120.60, SL: 121.20, TP: 119.35

EurJpy- to 125?The long term trend for EurJpy is clearly up and the correction seems to be over.
A new leg up could be underway and the pair could try to conquer 125 again in the next week or so.
Buy dips as long as the price is above 119

EURJPYEURJPY is hovering around a key area of support/resistance. Which we broke through and now is resistance, we might see a retest of the area which aligns with my ascending channel. Will be looking for a third tap of the top of the trend line for a short entry if it gets to that in a corrective manner. If it breaks the structure impulsively will be waiting to see if it is a possible retest of the ray line above and will be watching how it gets to that area.

EUR/JPY, we are heading to prior highs very soon.This pair looks very bullish after breakout of hourly downtrend and I am looking to go long here after breakout of pullback trendline after ABC correction wave is completed.


EURJPY BUY/LONG ANALYSIS!!!Once We see a clear retest and close above the @120.464, we will go long. This is because yesterdays daily bull candle closed just below the resistance, meaning that it is not yet a support. but there is still a-lot of bullish pressure, with a fantastic risk to reward ratio.

EURJPY DAILY TIMEFRAME!!! (LONG)Once We see a clear retest and close above the @120.464, we will go long. This will confirm strong bullish move to the upside. However Bulls are still evident and active. The weekly, monthly and daily all show bullish reversals to the upside. Buying momentum is also off the charts, so lets go long. This trade also holds a fantastic risk/reward ratio.
Price has also retraced and supported above the daily 50% Fib.

EURJPY ShortsPrice At Mini Resistance
Looking For Shorts Alternatively Price Might Break To The Upside

EURJPY Possible Sell/ShortGOLD BOX POSSIBLE ENTRY FOR SELL
1. Restest area of broken support
2. At the 38.2 (right rejection/continuation area)
3. Price could possible wick up into the 50% retracement (LOOK FOR RECECTION FIRST)
4. High confluence area
5. Divergence possibly happening on 4HR
I'll personally be looking for reversal candles/ rejection on 4HR around the trend line (38.2 -50.0 rejection.

EURJPY - BUY or SELL ?EURJPY
Full Analysis Description : We’re bullish on monthly momentum, we have also hit monthly resistance and made a pullback last week to previous support which is holding now. Currently, we are having a bullish move which can turn into a Lower High to continue going lower OR it holds within that area to continue to the upside.
At the moment, we wait on 4 Hour timeframe to see a clear picture for anticipating buy or sell trade opportunity.
------------
If you are following this pair, please comment below.
Also, if you have any question related to this idea feel free to ask in the comment section.
Follow for more free ideas like this, if you want me to analysis any FX pair, Gold , Oil , US30 let me know.
Best Regards.

EUR/JPY, awesome opportunity for a Swing Short tradeEuro is weakening heavily and JPY is looking still very bullish. From technical perspective, this is great opportunity for seller to go in and start adding to short positions.

EURJPY potential for 300 pips move to the upsideOkay traders,
We have seen a recent push up on EURJPY pair and it has broken the trendline. The pair pulled back and retested the support already and showing bullish signs which suggest we might as well see another leg of bullish run and this time it should aim for the upper resistance level.
As there's plenty of pips we are talking about hence it is prudent to open 2/3 smallest lots and close each trade on 100 pips. (IE 1st trade close at 100 pips, 2nd trade close at 200 pips & 3rd one close at 300 pips to avoid disappointment. In Forex, thing always doen't play out the way we want but we can take advantages when thing fall in places.
Once it reaches 100 pips, the trader should move their stop loss to entry position to enjoy risk free trade.
Let me know your thoughts.
Trade safe and good luck.


EURJPY short for 220 pipsGood trade this. Price action pushed up to a major level with a bearish engulfing candle printed on the 4h chart. RSI also overbought position. We might see a double top but yes, it looks a good shorting opportunity.
Please have patience on this trade and there are plenty of pips.
Let me know your thoughts.
Trade safe and good luck.
