EURJPY Long Opportunity EURJPY currently has bullish market directionality and is on a retracement. price is trading above the 50 SMA and we can observe bullish momentum from the RSI trading above the 55 level.
Potentially break and retest zone at 167,550. Awaiting a reaction to this level which could see the bullish trend resuming.
Eurjpylong

EURJPY Setup Alert!
We’re waiting for the price to reach our marked level.
No emotional trades — let the setup come to you! ⏳
Levels are shown on the chart.
Follow us here: forexCSP

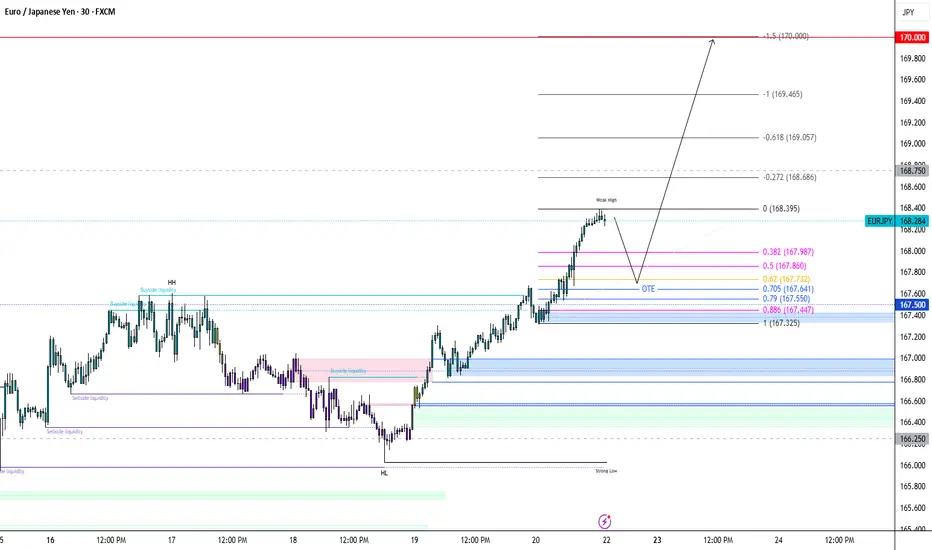
EURJPY: Buy The Dip Or Breakout ContinuationI'm looking to buy EJ...
If price retraces early next week, monitor 167.40–167.70 zone for bullish reaction and confirmation. Wait for M15 bullish BOS after price taps 167.40–167.70. If confirmed, execute long entry from this discounted range.
Entry: 167.40 – 167.70
Stop Loss: 167.10
TP1: 168.60
TP2: 169.20
TP3: 170
If price breaks and closes above 168.60, look for a retest for breakout continuation.
Trigger: Break + H1 candle close above 168.60
Entry on Retest: 168.60 – 168.70
Stop Loss: 168.20
Target: 169.50 – 170.00
Invalidation: H4 structure break below 167.00 would weaken bullish outlook short term
EUR/JPY Breakout Done , Long Setup Valid To Get 200 Pips !Here is my opinion on EUR/JPY , We have a very clear breakout and now i`m waiting for retest to broken res and new support and waiting for good bullish price action to enter a buy trade and targeting at least previous high , if the price go back below my support with daily closure then this idea will not be valid .

EURJPY – The Sweep That Sparked the ShiftSometimes the cleanest moves start with discomfort.
This EURJPY setup began with a sweep below the Previous Day’s Low (PDL), clearing out weak hands and gathering liquidity. That was our first clue.
Then came the Break of Structure (BOS), a confirmation that the market had shifted bullish.
Now will be waiting for price to retrace back to the FVG, where it found its footing and launched upward. Smart money cleared the lows, shifted structure .
Stick to the process. Trust what the chart is telling you.
Don’t chase, align.

EURJPY LONG FORECAST Q2 W25 D19 Y25EURJPY LONG FORECAST Q2 W25 D19 Y25
Professional Risk Managers👋
Welcome back to another FRGNT chart update📈
Diving into some Forex setups using predominantly higher time frame order blocks alongside confirmation breaks of structure.
Let’s see what price action is telling us today! 👀
💡Here are some trade confluences📝
✅Weekly 50 EMA
✅15' Order block identification
✅Daily Order block rejection
✅4H order block identification
🔑 Remember, to participate in trading comes always with a degree of risk, therefore as professional risk managers it remains vital that we stick to our risk management plan as well as our trading strategies.
📈The rest, we leave to the balance of probabilities.
💡Fail to plan. Plan to fail.
🏆It has always been that simple.
❤️Good luck with your trading journey, I shall see you at the very top.
🎯Trade consistent, FRGNT X

EURJPY Long Opportunity EURJPY has Bullish market directionality and is currently on a retracement per the 4 hour charts. Potential entry location at 166,425
Bullish confluences include price trading above the 50 SMA, Bullish momentum from the RSI with the current indication of price sitting within the sweet spot region between 45-55 which signals the need of the retracement. Bullish market structure also present with Higher Low and respective Higher Highs
166,425 is also a break and retest zone which provides an extra layer of confluence from the 4 hour perspective, will be looking at how price action reacts to this level on the 1 hour/ 15min chart for a potential bullish signal.

EURJPY Long Position EURJPY is currently in a bullish trend from a higher timeframe perspective with the potential for a further long opportunity at the end of the current retracement. On the 1 hour timeframe, EURJPY is trading above the 50 SMA and is approaching the 55 zone of the RSI indicating the end of the retracement and continuation of the bullish trend. addition confluences include the breakout level at 166,566 being tested and the the bullish trendline at play... Will be looking for an entry at 166,566 with stop loss below structure, riding the bullish trend towards the 167,190 resistance zone.

EURJPY ANALYSISAfter seeing the previous weekly candle close bullish, and the daily and 4hr showing bullish structure and a continuation to the upside, a quick pullback is expected for this pair before a further long as the pair is currently at a HH area

EURJPY Breaks Out From Major Zone, Eyes Higher LevelsEURJPY Update, structure remains bullish
The pair has officially broken above a key resistance zone, showing solid bullish intent. This breakout is even more meaningful when you look at how price has been consistently supported by the long-term rising trendline. Every time price touched this trendline, it bounced with strength — and this time is no different.
The recent move suggests that buyers are firmly in control, and with the structure now pushing above resistance, momentum could continue to build.
As long as EURJPY holds above this breakout zone, the path of least resistance is to the upside.
DYOR, NFA

EURJPY Trade IdeaEURJPY is maintaining a strong bullish structure on the 1H chart, with price action consistently forming higher highs and higher lows.
My targets are set at the next resistance levels for partial and extended profits, with a final target at the upper resistance if bullish momentum persists.
Stop loss is placed just below the previous swing low.

EUR/JPY Short🎯 Trade Setup Plan
👇 Aggressive Entry (Riskier)
Sell Limit: 164.90
SL: 165.90
TP1: 160.00
TP2: 157.00
TP3 (optional): 155.00
Use this only if you want to catch the wick, but recognize the higher chance of being swept.
✅ Conservative Entry (Recommended)
Wait for a daily candle close under 162.00 after touching 164. That confirms rejection.
Entry: On next day’s minor retest (e.g., 162.50–163.00)
SL: 165.50 (above recent highs)
TP1: 160.00
TP2: 157.00
TP3: 155.00
Risk: 1–2% depending on confirmation strength
📌 Optional Breakout Plan (In case resistance breaks cleanly)
Buy Stop: 165.60
SL: 164.30
TP: 170.00 (weekly resistance)
Use only if a strong daily close above 165 confirms breakout.

EURJPY ANALYSISAfter seeing the previous daily candle close really bullish above 165.000 key weekly are, we could expect the bullish momentum to continue with confirmations on the 4hr structure making HH and HL

EURJPY Long opportunity at 164.250EURJPY currently has bullish market directionality and is on a retracement from the 165.000 level toward the break and retest zone at 164.250. on the 4 hour timeframe price is trading above the 50 SMA and is in the Bullish RSI zone above 55 below 70. The 164.250 price points lays in the sweet spot between 45-55 in the RSI which signals the potential end of the retracement and pivot back towards the bullish momentum. Looking to ride this long position back towards the 165.000 resistance level.

eurjpy sell signal. Don't forget about stop-loss.
Write in the comments all your questions and instruments analysis of which you want to see.
Friends, push the like button, write a comment, and share with your mates - that would be the best THANK YOU.
P.S. I personally will open entry if the price will show it according to my strategy.
Always make your analysis before a trade

LONG | EUR/JPY | 1D Macro Context: With ECB neutral and BoJ dovish, EUR/JPY favored to drift upward slowly as Yen weakness persists.
Structure: In a long-term bullish channel and recently bounced off the 50‑day MA near 163.0–163.5 .
Trigger:
Entry: Long on pullback to 163.50–164.00.
Stop: 162.80 (below channel support & LVN).
Target: 166.70 (upper channel range) → 168.00 zone.
R:R: ~1:2.5.
Framework: Entry aligns with liquidity sweep and bounce off HVN/50MA, supported by Elliott/Elliott-wave count and broader bullish range.
EURJPY SELL Signal. Don't forget about stop-loss.
Write in the comments all your questions and instruments analysis of which you want to see.
Friends, push the like button, write a comment, and share with your mates - that would be the best THANK YOU.
P.S. I personally will open entry if the price will show it according to my strategy.
Always make your analysis before a trade

TEXT BOOK LTF PA EURJPY LONG FORECAST Q2 W21 D22 Y25TEXT BOOK LTF PA EURJPY LONG FORECAST Q2 W21 D22 Y25
Professional Risk Managers👋
Welcome back to another FRGNT chart update📈
Diving into some Forex setups using predominantly higher time frame order blocks alongside confirmation breaks of structure.
Let’s see what price action is telling us today!
💡Here are some trade confluences📝
✅Weekly 50 EMA
✅Daily 50 EMA
✅Tokyo ranges to be filled
✅Intraday 15' order block
✅Tokyo ranges to be filled
🔑 Remember, to participate in trading comes always with a degree of risk, therefore as professional risk managers it remains vital that we stick to our risk management plan as well as our trading strategies.
📈The rest, we leave to the balance of probabilities.
💡Fail to plan. Plan to fail.
🏆It has always been that simple.
❤️Good luck with your trading journey, I shall see you at the very top.
🎯Trade consistent, FRGNT X

EUR/JPY 1H: Bullish Falling Wedge Breakout + Target 🧠 Overview of the Setup
The EUR/JPY currency pair has recently completed a Falling Wedge pattern, a classic and powerful bullish reversal formation. This chart structure typically signals the end of a downtrend and the potential beginning of a strong upward impulse.
In this setup, multiple confluences point toward a bullish move, including pattern breakout, structure shift, retest of a dynamic support level, and alignment with major supply/resistance zones.
🔍 Pattern Analysis: Falling Wedge
Definition: A falling wedge is a technical pattern formed by two downward-sloping trendlines — one representing resistance and the other support — that converge. It signals a slowdown in bearish momentum, often preceding a bullish reversal.
Chart Observation: The wedge is well-defined, spanning several trading sessions. As price action tightened toward the apex, bearish momentum began to weaken.
Breakout Trigger: Price broke convincingly above the upper wedge boundary, suggesting the start of a bullish reversal.
✅ Implication: The breakout confirms that buyers have taken control, especially as this move is supported by a structural Change of Character (CHOCH).
📈 Price Action Structure & Key Zones
1. Minor Resistance (Broken)
After the breakout, price encountered a minor resistance zone just above the wedge. This area is now likely to flip into support (a classic breakout retest).
2. Major CHOCH (Change of Character)
A CHOCH indicates a break in market structure — from lower highs and lower lows to higher highs and higher lows.
The break above this level confirms a shift from bearish to bullish sentiment.
3. Curved Support (Black Min Curve)
A rising curved trendline has formed below current price, acting as a parabolic support structure.
This suggests not just a trend reversal, but increasing bullish momentum, as buyers step in at higher levels with each correction.
4. Major Resistance Zone (Target Area)
Price Target: ~164.50 – 165.50
This zone has historically acted as strong supply and is marked for potential take-profit or observation for reversal signals.
The target is derived from both horizontal resistance and the projected height of the wedge pattern.
🎯 Trading Strategy
Component Details
Entry Zone 162.50 – 162.60 (retest of minor resistance + curve support)
Stop Loss Below 162.00 (beneath wedge and curve)
Take Profit 164.50 – 165.50 (major resistance)
Risk/Reward Approx. 1:2.5 to 1:3
🔸 Conservative Entry: Wait for bullish confirmation (bullish engulfing candle or pin bar) on the support retest.
🔸 Aggressive Entry: Market buy after confirmation of curve bounce or on lower timeframe bullish signals.
📊 Volume & Momentum Consideration
Although volume isn’t shown on this chart, volume confirmation on the breakout would significantly strengthen the bullish bias. Look for:
Increasing buy volume on breakout
Lower sell volume on pullbacks
Bullish divergence (if using RSI or MACD)
⚠️ Risk Management & Event Awareness
Be cautious of unexpected JPY-related economic releases (e.g., BOJ announcements, inflation data) that may cause volatility.
If the curved support is broken decisively, this could invalidate the setup, suggesting further consolidation or downside risk.
🧠 Psychological Perspective
The Falling Wedge reflects a market where sellers are gradually losing control — pushing price lower, but with less conviction. As the wedge tightens, bulls prepare to step in. The breakout confirms that sentiment has shifted, and many traders use such setups as entry points for swing or momentum trades.
The curved support line suggests a transition from accumulation to markup phase, which typically leads to faster price expansion as confidence in the uptrend grows.
✅ Summary
✅ Pattern: Falling Wedge (Bullish)
✅ Breakout: Confirmed with CHOCH
✅ Support: Curve trendline acting as dynamic support
✅ Target: 164.50 – 165.50 major resistance
✅ Bias: Bullish (until curve support is broken)
📣 Final Thoughts
This is a high-probability bullish continuation setup backed by price structure, pattern breakout, and support alignment. The risk is well-defined, and reward potential is strong — making this a favorable setup for swing traders or short-term position traders.
💬 Let me know what you think in the comments — are you going long EUR/JPY?
👍 Like and Follow for more setups and breakdowns.

EURJPY ABC BULLISH PATTERNEURJPY Market momentum is going to make a ABC Bullish pattern with the specific target and against the target 🎯
Target 🎯 166.000
Stop loss. 161.500
Conclusion: It's a strong bullish pattern market analysis use this for making money and use proper strategies.

EUR/JPY Long Setup – Bullish Reversal from Key Support Zone Entry Point: 162.227
Stop Loss: 161.629
Take Profit (Target): 166.778
Current Price: ~162.798
Risk/Reward Ratio:
Risk: ~60 pips
Reward: ~455 pips
Risk/Reward ≈ 1:7.6 (strong setup)
🔍 Technical Insights
Support Zone:
The purple rectangle around 162.227 to 162.000 is identified as a key demand zone or support area.
Price has tested this zone previously and appears to be bouncing off it.
Price Structure:
The pattern suggests a potential double-bottom or reversal structure forming.
A rounded recovery projection is drawn, implying bullish momentum is expected.
Moving Averages:
A red (shorter period) moving average is crossing below the price.
A blue (longer period) moving average near the support zone could act as dynamic support.
Target Area:
166.778 marks a clear resistance or prior high and is labeled as the “EA Target Point”.
This is a logical profit-taking zone based on past price action.
✅ Bullish Trade Bias Justification
Strong support reaction near entry.
Favorable risk/reward ratio.
Reversal pattern potential.
Confluence with moving average support.
⚠️ Considerations
Ensure confirmation from a bullish candle or reversal signal before entry.
Be mindful of macroeconomic events or EUR/JPY fundamentals that might impact volatility.

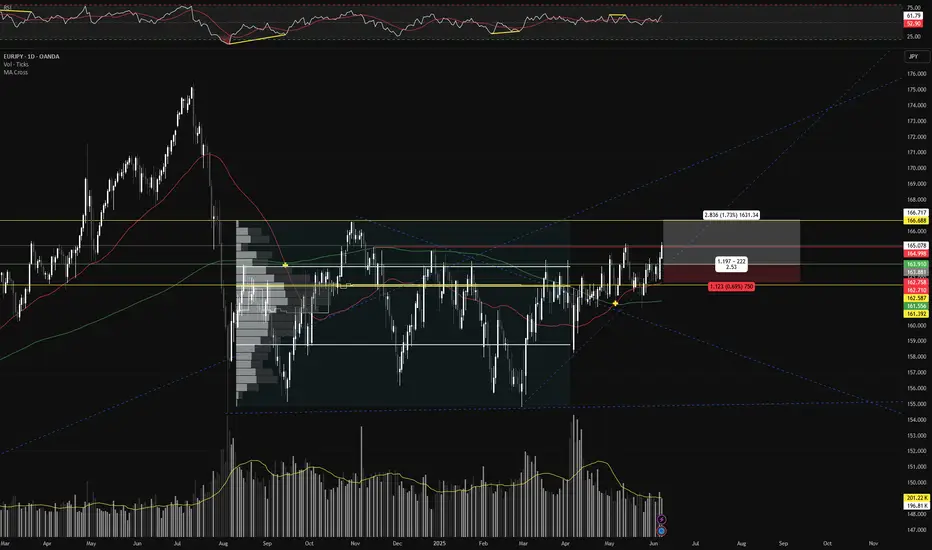
Trendzilla vs Chop Kong (EUR/JPY)The bias for EUR/JPY - in our view - is higher
On the weekly timeframe:
A) WMA has flattened out and price held above it B) downtrend line broken and held
On daily timeframe:
EUR/JPY just broke resistance for possible breakout trade up to the olf high to 166 - and possibly beyond
Thoughts ?

EURJPY Short Term Buy Idea Update!!!Hi Traders, on March 27th I shared this idea "EURJPY - Expecting The Price To Bounce Higher Further"
Expected bullish continuation higher until the two Fibonacci support zones hold. You can read the full post using the link above.
Price moved as per the plan here!!!
Price respected the second Fibonacci support zone and bounced higher.
If you enjoy this idea, don’t forget to LIKE 👍, FOLLOW ✅, SHARE 🙌, and COMMENT ✍! Drop your thoughts and charts below to keep the discussion going. Your support helps keep this content free and reach more people! 🚀
--------------------------------------------------------------------------------------------------------------------
Disclosure: I am part of Trade Nation's Influencer program and receive a monthly fee for using their TradingView charts in my analysis.
