EURJPY - BULLISHAfter our successful forecast last week,
We expect EURJPY would changing trend this week.
Wave ii may be just completed.
You may go for Long from here.
Good luck
Eurjpylong

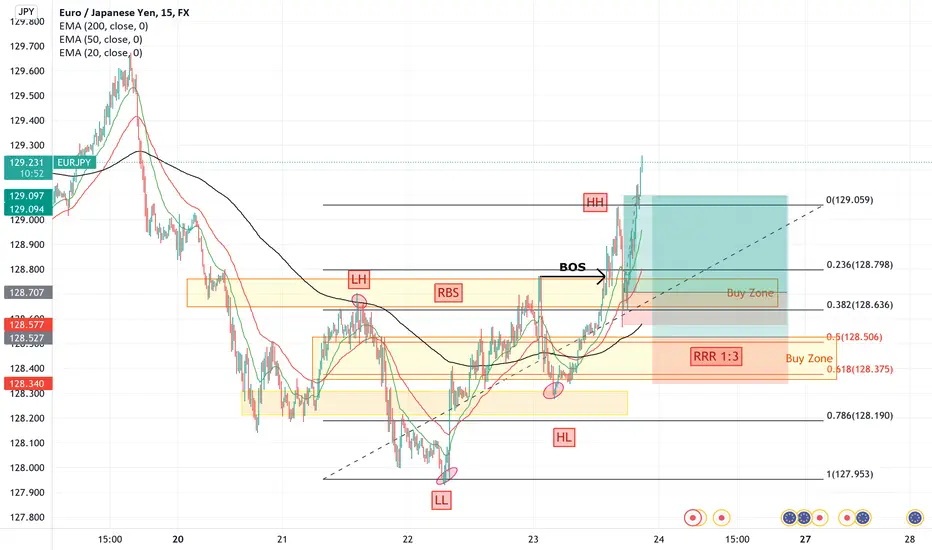
EurJpy Intraday Trading Idea (TF15 RRR 1:3)Trend Up
- HH & HL
- Above EMA 200, 50, and 20
Buy Zone: 129.580 - 129.450
Target: 129.900 at Top of Expected range Intraday Trading (Daily Volatility 0.31%
RRR 1:3
Move the stop loss to breakeven after 2% profit

EURJPY - LONG#EURJPY LONG
More Clearly Look On EURJPY Chart
We Are entering In Buy If the Support area Will Be Break

EURJPY - LONG#EURJPY LONG
Here is That Clearly Double Bottom On Support Area
We Are Looking More Buy

EURJPY Dual-Direction AnalysisWait for confirmation on level 129.500 for buy/sell
Overall Reasoning:
- Level 129.500 has shown good reactions in the past (Scroll back to see)
Sell Reasoning
- Trend line was broken with a strong bullish push causing a S&D imbalance which is expected to be filled and retest trendline
- Overall trend is still bearish (Unless price rejects level 129.500 and moves higher)
- Wait for a break and retest of 129.500 level to sell.
Buy Reasoning:
- Price formed a long-term double bottom on level 128.000
- Broke previous lover high (Red), waiting on a retest.
- If price retest level 129.500 with bullish confirmation, look to go long. (Aggressive)
- Wait for a considerable retracement between 129.000-129.5000

EurJpy Trade Intraday Trading Idea1st Buy Zone: 128.700 - 128.555 (at RBS)
2nd Buy Zone: 128.577 - 128.336 (at Fibo 61.8 - 50)
Target 129.100 (RRR 1:3)
Weekly Analysis eurjpyOANDA:EURJPY
technical chart is show long position and i think this position is high risk but we have money managment so no problem

MM's daily technical analysis- 24.09.2021 Long EURJPYHi traders,
As we have witnessed in the past few days, EURJPY retested resistance area 127.90-128.00 and encountered strong pushback pulling its price back to the 129.70.
The strong upward momentum on the 23th of Sep creates a double bottom pattern for EURJPY and it is highly likely the end of a short term downward trend.
My own trading system Clam has given a long signal so a trading idea has now established(live) to go long on EURJPY.
It is possible for EURJPY to encounter resistance around 130.760 area and in that case, EURJPY may follow a channel pattern. In such circumstance profit may be cut earlier,
but under current situation our TP is still set on 133.90 and further adjustment may be applied based on further market observation.
OP: 129.638 TP: 133.90 SL: 127.890 RR: 2.55


EURJPY ANALYSISEURJPY is in a current downtrend and the 0.618 retracement level is at 129.0 level. If EURJPY continues in this current trend we can expect another 128 support test. If we do manage to close above this downtrend and break it we can expect some reversal and with 2 possible TP’s. If we respect the downtrend we can expect a move to 128 and possibly 127 as our 2 TP’s.


EUR/JPY Running In 55 Pips From Last Analysis And New Update NowThis is an educational + analytic content that will teach why and how to enter a trade
Make sure you watch the price action closely in each analysis as this is a very important part of our method
Disclaimer : this analysis can change at anytime without notice and it is only for the purpose of assisting traders to make independent investments decisions


Best Area To Put Your Buy Order On EUR/JPY And Get 200 Pips !This is an educational + analytic content that will teach why and how to enter a trade
Make sure you watch the price action closely in each analysis as this is a very important part of our method
Disclaimer : this analysis can change at anytime without notice and it is only for the purpose of assisting traders to make independent investments decisions

Incoming Bulls : EURJPYFX:EURJPY
We expect a little drop to clear out liquidity at the EQLs from LTFs, tap the OB then continue bullish.

EURJPY - LONG POSITION (8HR)CONFLUENCES:
- Breakout and retest of black box in 1hr
- Inverse Head & Shoulder pattern
- Rejection of weekly 51 EMA
- Not happy with fib rejection but the extension lines up nicely with area of resistance

EURJPY might rise to 130 if the support holdsTraders, I found a treasure😁
EURJPY is currently at the strong horizontal support of March 2021. The question is will it bounce up and rise or violate this support and fall to January low? Only time will tell. Where bullish reversal signs get printed on the support we can see a strong recovery, which will push price back up to the high (Resistance) at 130.00. If support fails then 125.00 low will be in focus. We only trade when the market present us good opportunities. When the market doesn't we sit and watch it do its thing, preserving our capital for better days. Hahahaha😁
Enjoying the ideas? Please leave your thoughts in the comment section below. Do please like this idea to show your support. Thank you.

EURUSD LONG (Euro Recovery?) to 1.2800European Economy Recovery amid the PLAN-demic,
will we be able to see the recovery of the Euro against the greenback?
Long-Term Analysis.

EURJPY-Long#EURJPY
time to buy it already we have secure 120+ PIPS in sell. Now we can buy from support.

EURJPY - Buying EUR whilst it is good value.Small Sunday trade to buy EURJPY.
A couple of confluence areas.
Fair value area to fill for the range.
A sensible low risk fibo retrace to the up. Again on the larger time frame.
A higher timeframe trend touch is done (despite local down trend).
RSI pointing up.
Will try grab some at 129.50 target partial then sail over to TP2 (maybe 🏴☠🌊).
We will see, good loot management needed on this one.

EURJPY Trading Plan - 17/Sep/2021Hello Traders,
Hope you all are doing good!!
I expect EURJPY to go UP after this correction
Look for your BUY setups.
Please follow me and like if you agree or this idea helps you out in your trading plan.
Disclaimer: This is just an idea. Please do your own analysis before opening a position. Always use SL & proper risk management.
Market can evolve anytime, hence, always do your analysis and learn trade management before following any idea.
